Key Points
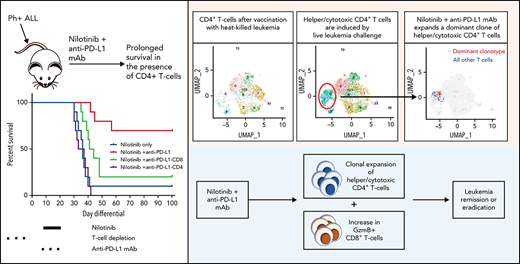
Anti–PD-L1 blockade significantly improves the efficacy of nilotinib against BCR-ABL+ B-ALL in a CD4+ T-cell–dependent manner.
Anti–PD-L1 clonally expands leukemia-specific CD4+ T cells with a helper/cytotoxic phenotype and reduced expression of exhaustion markers.
Abstract
Patients with acute lymphoblastic leukemia have experienced significantly improved outcomes due to the advent of chimeric antigen receptor (CAR) T cells and bispecific T-cell engagers, although a proportion of patients still relapse despite these advances. T-cell exhaustion has been recently suggested to be an important driver of relapse in these patients. Indeed, phenotypic exhaustion of CD4+ T cells is predictive of relapse and poor overall survival in B-cell acute lymphoblastic leukemia (B-ALL). Thus, therapies that counter T-cell exhaustion, such as immune checkpoint blockade, may improve leukemia immunosurveillance and prevent relapse. Here, we used a murine model of Ph+ B-ALL as well as human bone marrow biopsy samples to assess the fundamental nature of CD4+ T-cell exhaustion and the preclinical therapeutic potential for combining anti–PD-L1 based checkpoint blockade with tyrosine kinase inhibitors targeting the BCR-ABL oncoprotein. Single-cell RNA-sequence analysis revealed that B-ALL induces a unique subset of CD4+ T cells with both cytotoxic and helper functions. Combination treatment with the tyrosine kinase inhibitor nilotinib and anti–PD-L1 dramatically improves long-term survival of leukemic mice. Depletion of CD4+ T cells prior to therapy completely abrogates the survival benefit, implicating CD4+ T cells as key drivers of the protective anti-leukemia immune response. Indeed, treatment with anti–PD-L1 leads to clonal expansion of leukemia-specific CD4+ T cells with the aforementioned helper/cytotoxic phenotype as well as reduced expression of exhaustion markers. These findings support efforts to use PD1/PD-L1 checkpoint blockade in clinical trials and highlight the importance of CD4+ T-cell dysfunction in limiting the endogenous anti-leukemia response.
Introduction
B-cell acute lymphoblastic leukemia (B-ALL) has been postulated to be refractory to immune checkpoint blockade due to a paucity of somatic mutations and presumed low frequency of neoantigen-specific T cells.1 Recent observations have challenged this paradigm, prompting a reexamination of the endogenous anti-leukemia T-cell response.2 While CD8+ T cells undoubtedly impart significant anti-leukemia activity, independent observations showed that the presence of phenotypically exhausted (TIM3+PD1+/−) CD4+, rather than CD8+, T cells was highly predictive of subsequent relapse.3-5 This exhaustion phenotype was observed prior to treatment initiation in multiple age cohorts and leukemia subtypes, implying that TIM3+CD4+ T cells harbor unknown functional deficits that may contribute to leukemia progression.
Exhaustion of CD4+ T cells is influenced by checkpoint molecule expression on leukemia cells and professional antigen presenting cells . Upregulation of PD-L1 on leukemic blasts correlates with shortened survival in murine models of Ph+ ALL and is associated with inferior relapse-free survival in patients treated with traditional chemotherapy or the bispecific T-cell engager blinatumomab.6,7 Because CD4+ T cells provide key helper signals to optimize humoral immunity and CD8 priming, their dysfunction may hinder the anti-leukemia immune response. Altogether, these findings suggest that immune checkpoint blockade may reduce CD4+ T-cell dysfunction, thereby enhancing leukemia immunosurveillance.
This study aimed to discover functional deficits in exhausted CD4+ T cells that contribute to leukemia progression and whether rescue of these exhausted CD4+ T cells with immune checkpoint blockade prevents subsequent relapse. Using murine models of BCR-ABL+ leukemia and human bone marrow biopsy samples, we found that phenotypic exhaustion is primarily confined to a novel subset of CD4+ T cells capable of providing key helper signals and mediating direct cytotoxicity toward leukemic blasts. Phenotypic exhaustion of CD4+ T cells depends on chronic T-cell receptor (TCR) stimulation and is associated with a diminished capacity for effector cytokine synthesis as well as deficits in helper signals that optimize CD8+ T-cell function. Addition of anti–PD-L1 monoclonal antibodies (mAbs) in combination with BCR-ABL tyrosine kinase inhibitors largely reversed these defects and resulted in the expansion of dominant leukemia-specific CD4+ T-cell clones. This culminated in significant prolongation of survival in murine models. Thus, CD4+ T-cell dysfunction plays a critical role in enabling relapse but can be reversed by the addition of immune checkpoint therapies, resulting in rescue of anti-leukemia activity.
Methods
Leukemia model
Nilotinib, anti–PD-L1 mAb treatment, and T-cell depletion
C57BL/6 mice were injected with 2500 LM138 cells via tail vein. Mice were bled at 14 days post-leukemia challenge and then treated with 75 mg/kg of nilotinib via oral gavage 5 days/week for 2 weeks. Some mice were treated with 10 mg/kg of InVivoPlus anti-mouse PD-L1 (BioXCell, clone: 10F.9G2) or an isotype control antibody (Rat IgG2b, κ) via intraperitoneal injection on days 14, 16, and 18 post-leukemia establishment. For the 1-week treatment schedule, mice were treated with nilotinib 5 days/week for 1 week starting at day 14 post-leukemia establishment and with anti–PD-L1 or isotype control antibodies. For the CD4+ and CD8+ T-cell depletion studies, mice were treated with 22 mg/kg of InVivoPlus anti-CD4 (BioXCell, clone: GK1.5) or InVivoPlus anti-CD8 (BioXCell, clone: YTS169.4) depleting antibodies. CD4+ or CD8+ T-cell depletion was confirmed on day 14 post-leukemia challenge by flow cytometry using antibodies against CD4 or CD8 that do not sterically conflict with the depletion antibodies (CD4: RM4-4, CD8: 53-6.7).
Single-cell RNA/TCR sequencing of murine CD4+ T cells
CD44+CD4+ T cells from the indicated arms of mice were sorted using a BD FACSAria sorter. Cells from different treatment arms were labeled with hashtag antibodies as well as CITE-Seq antibodies to CD25, OX40, TIGIT, PD1, TIM3, and LAG3 (Biolegend). Sorted CD44+CD4+ T cells were resuspended at 106/mL in 50% fetal bovine serum in phosphate-buffered saline and captured using 10× Genomics Single Cell 5′ Solution. Single-cell (sc) TCR sequencing was performed using the Chromium Next GEM Single Cell V(D)J Reagent Kits version 1.1 (10× Genomics) according to the manufacturer’s instructions.
scRNA/TCR sequencing of human bone marrow samples
Leukemia blasts, T cells (CD45+CD3+), and other immune cells (CD45+CD3−CD10−) were sorted from bone marrow biopsy samples from 5 patients with leukemia using a BD FACSAria sorter. Ten thousand cells from each of the 3 sorted fractions were pooled together and resuspended at 106/mL in 50% fetal bovine serum in phosphate-buffered saline before capture using 10X Genomics Single Cell 5′ Solution. scTCR sequencing was performed using the Chromium Next GEM Single Cell V(D)J Reagent Kits version 1.1 (10× Genomics). All patients provided written informed consent, and the studies were conducted in accordance with the Declaration of Helsinki and with Human Research Ethics Committee approval.
Results
Murine models of B-ALL exhibit features of T-cell phenotypic exhaustion
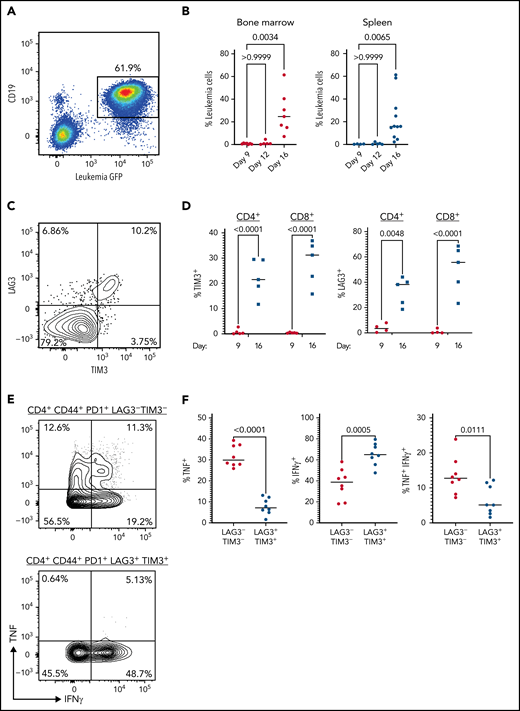
To investigate mechanisms of T-cell exhaustion and leukemia immunoevasion, we used the Ph+ B-ALL LM138 cell line, previously generated by our group.6,10 LM138 cells were injected into nonirradiated immunocompetent host mice and rapidly expanded in bone marrow and secondary lymphoid organs. Leukemia cells were present at low frequencies (<1% of bone marrow or spleen) at days 9 and 12 after injection but abundant (>10% of bone marrow/spleen) by day 16 (Figure 1A-B). Leukemia burden paralleled the development of CD4+ and CD8+ T cells with an exhausted phenotype. Specifically, multiple activating/inhibitory receptors including PD1, TIM3, and LAG3 were significantly upregulated by day 16 (Figure 1C-D). Phenotypically exhausted CD4+ T cells did not demonstrate significant deficits in Interferon-gamma (IFNγ) production but did lose capacity for tumor necrosis factor (TNF) synthesis, as measured using in vitro restimulation assays (Figure 1E-F). Similar results were obtained with an independent Ph+ cell line (ST-26, data not shown) as well as an unrelated B-ALL that arose spontaneously in Pax5+/− x Ebf1+/− mice (supplemental Figure 1; available on the Blood Web site).9 Thus, murine B-ALL induces phenotypic CD4+ and CD8+ T-cell exhaustion, mimicking clinical observations.
Leukemia induces an exhaustion phenotype in activated T cells. (A) CD45.2+ mice were injected with 2500 CD45.1+ LM138 leukemia cells. A representative flow plot of CD19+GFP+ leukemic cells in the spleen from mice at day 16 after injection is shown. (B) Percent leukemia cells in bone marrow (left panel) and spleen (right panel) at days 9, 12, and 16 (n = 7 per timepoint from 2 independent experiments). Median is displayed, P values determined by Kruskal-Wallis test. (C) A representative example of LAG3 and TIM3 expression on CD4+ T cells from mice injected with 2500 leukemia cells and harvested 16 days later. (D) Percent of TIM3+ (left panel) or LAG3+ (right panel) CD4+ and CD8+ T cells at days 9 and 16 after injection with 2500 leukemia cells. Median is displayed (n = 5 per time point from 2 independent experiments). P value determined by 2-way analysis of variance. (E) Mice were injected with 2500 leukemia cells and CD4+ T cells harvested 16 days later. Shown is a representative example of TNF and IFN-γ expression in CD4+CD44+PD1+LAG3−TIM3− and CD4+CD44+PD1+LAG3+TIM3+ splenocytes after in vitro stimulation with PMA and ionomycin. (F) Percent of CD4+ T cells expressing TNF (left panel), IFN-γ (middle panel), and both cytokines (right panel) after in vitro stimulation as in E. Median values are shown (n = 8 from 2 independent experiments). P values determined by unpaired t-test.
Leukemia induces an exhaustion phenotype in activated T cells. (A) CD45.2+ mice were injected with 2500 CD45.1+ LM138 leukemia cells. A representative flow plot of CD19+GFP+ leukemic cells in the spleen from mice at day 16 after injection is shown. (B) Percent leukemia cells in bone marrow (left panel) and spleen (right panel) at days 9, 12, and 16 (n = 7 per timepoint from 2 independent experiments). Median is displayed, P values determined by Kruskal-Wallis test. (C) A representative example of LAG3 and TIM3 expression on CD4+ T cells from mice injected with 2500 leukemia cells and harvested 16 days later. (D) Percent of TIM3+ (left panel) or LAG3+ (right panel) CD4+ and CD8+ T cells at days 9 and 16 after injection with 2500 leukemia cells. Median is displayed (n = 5 per time point from 2 independent experiments). P value determined by 2-way analysis of variance. (E) Mice were injected with 2500 leukemia cells and CD4+ T cells harvested 16 days later. Shown is a representative example of TNF and IFN-γ expression in CD4+CD44+PD1+LAG3−TIM3− and CD4+CD44+PD1+LAG3+TIM3+ splenocytes after in vitro stimulation with PMA and ionomycin. (F) Percent of CD4+ T cells expressing TNF (left panel), IFN-γ (middle panel), and both cytokines (right panel) after in vitro stimulation as in E. Median values are shown (n = 8 from 2 independent experiments). P values determined by unpaired t-test.
We used Nur77 GFP-reporter mice to evaluate whether CD4+ T-cell phenotypic exhaustion required TCR engagement of cognate antigen. After injection of LM138 cells, we observed significantly more phenotypic exhaustion of CD4+ and CD8+ T cells in the NUR77-GFPhi compartment (supplemental Figure 2A-B); TIM3 and/or LAG3 positivity was less frequently observed in NUR77-GFPlo/− cells. As NUR77-GFPlo/− cells may include either cells that have never encountered antigen or cells that previously encountered antigen but have now downregulated TCR signaling, we next used vaccination models to fully ascertain the dependence of phenotypic exhaustion on TCR stimulation. SM1 transgenic mice express a fixed TCR in CD4+ T cells specific for an irrelevant antigen, the Salmonella FliC protein.11 Injection of LM138 cells into SM1 mice did not induce phenotypic exhaustion (supplemental Figure 2C). We reasoned that SM1 cells may not have been capable of upregulating inhibitory receptors because of a lack of priming. We therefore conducted a third experiment in which SM1 cells were adoptively transferred into wild-type recipient mice and primed concurrent with leukemia establishment (supplemental Figure 2D). This also induced minimal upregulation of activating/inhibitory receptors on SM1+ T cells, although the transferred SM1 cells did upregulate CD44, confirming that they had encountered cognate antigen (supplemental Figure 2D-E). We conclude that phenotypic exhaustion is tightly coupled to TCR recognition of leukemia antigens and not due to nonspecific effects of the leukemia microenvironment in leukemic mice.
PD-L1 targeting therapies prolong survival when combined with BCR-ABL inhibition
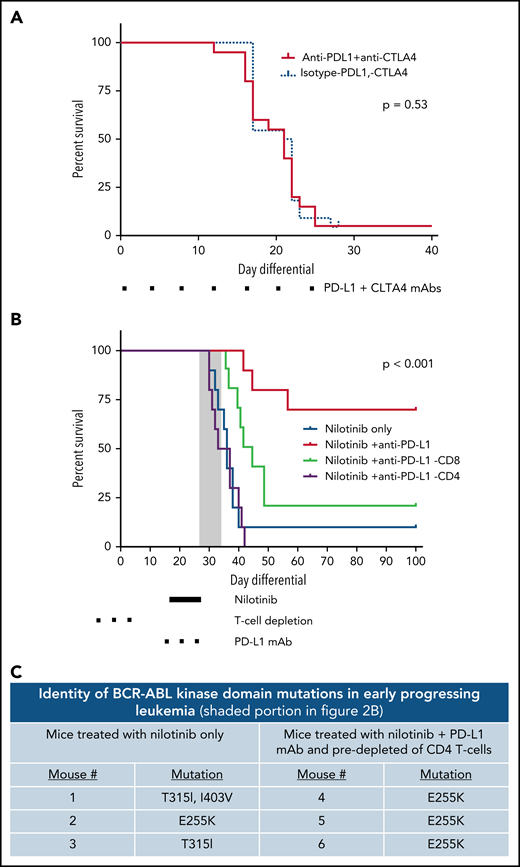
Because leukemia establishment rapidly induced phenotypic exhaustion of T cells, we next investigated whether immune checkpoint blockade therapy could provide a therapeutic benefit. In prior studies, little preclinical activity from PD-L1 or CTLA4 checkpoint therapy was observed, alone or in combination.8,12 Combined PD1/PD-L1 and CTLA4 targeting therapies, started concurrently with leukemia initiation, again showed no survival benefit (Figure 2A; supplemental Figure 3). However, due to the rapid kinetics inherent in this model, leukemia progresses extensively before naïve T cells can differentiate to memory/effector states, which may preclude checkpoint blockade efficacy. We hypothesized that reducing the leukemic burden with nilotinib would enhance the ratio of T cells to leukemic cells and allow terminal T-cell differentiation to occur, potentially enabling synergy with checkpoint blockade. As hypothesized, combining nilotinib and PD-L1 therapy did result in significant prolongation of survival, with ∼70% of mice surviving long-term in repeat experiments (Figure 2B).
Nilotinib plus PD-L1 blockade induces a protective anti-leukemia immune response in a CD4+ T-cell–dependent manner. (A) CD45.2+ mice were injected with 2500 LM138 leukemia cells. Dual PD-L1/CTLA-4 targeting antibody therapy (10 mg/kg each) was given simultaneously and continued twice per week. Statistical significance was analyzed using the Mantel-Cox Log-rank test. Results representative of 2 independent experiments (n = 10 mice per condition). (B) CD45.2+ mice were injected with 2500 LM138 leukemia cells. Starting at day 14 after leukemia injection, the mice were treated with either nilotinib and a PD-L1 blocking antibody (10 mg/kg) or nilotinib plus an isotype control antibody. In a cohort of mice, depleting antibodies against CD4+ or CD8+ T cells were administered before the start of treatment with nilotinib plus PD-L1 blockade. Survival of the mice in each of the treatment arms is shown. Statistical significance was analyzed using the Mantel-Cox log-rank test. Results representative of 2 independent experiments (n = 10 mice/arm). (C) Six mice became moribund while still receiving nilotinib or within 3 days of completing therapy (gray box indicated in 2B) and were euthanized. Spleens were harvested, genomic DNA was extracted, and the BCR-ABL kinase domain was amplified by polymerase chain reaction. Amplicons were cloned into plasmids that were transformed into Escherichia coli and streaked on agar plates. Individual colonies were picked, and plasmids sequenced in both forward and reverse directions using Sanger sequencing approaches. At least 2 clones per mouse were sequenced.
Nilotinib plus PD-L1 blockade induces a protective anti-leukemia immune response in a CD4+ T-cell–dependent manner. (A) CD45.2+ mice were injected with 2500 LM138 leukemia cells. Dual PD-L1/CTLA-4 targeting antibody therapy (10 mg/kg each) was given simultaneously and continued twice per week. Statistical significance was analyzed using the Mantel-Cox Log-rank test. Results representative of 2 independent experiments (n = 10 mice per condition). (B) CD45.2+ mice were injected with 2500 LM138 leukemia cells. Starting at day 14 after leukemia injection, the mice were treated with either nilotinib and a PD-L1 blocking antibody (10 mg/kg) or nilotinib plus an isotype control antibody. In a cohort of mice, depleting antibodies against CD4+ or CD8+ T cells were administered before the start of treatment with nilotinib plus PD-L1 blockade. Survival of the mice in each of the treatment arms is shown. Statistical significance was analyzed using the Mantel-Cox log-rank test. Results representative of 2 independent experiments (n = 10 mice/arm). (C) Six mice became moribund while still receiving nilotinib or within 3 days of completing therapy (gray box indicated in 2B) and were euthanized. Spleens were harvested, genomic DNA was extracted, and the BCR-ABL kinase domain was amplified by polymerase chain reaction. Amplicons were cloned into plasmids that were transformed into Escherichia coli and streaked on agar plates. Individual colonies were picked, and plasmids sequenced in both forward and reverse directions using Sanger sequencing approaches. At least 2 clones per mouse were sequenced.
To ascertain the relative importance of CD4+ versus CD8+ T cells to treatment efficacy in this setting, we depleted each subset prior to leukemia establishment in parallel treatment arms. Depletion of CD8+ T cells led to loss of much of the protective effect of PD-L1 treatment, while depletion of CD4+ T cells led to complete loss of protection (Figure 2B). Thus, CD4+ T cells and, to a lesser extent, CD8+ T cells play a critical role in preventing relapse in leukemic mice treated with the combination of nilotinib plus anti–PD-L1 blockade.
Treatment with nilotinib alone induced only a transient remission, and 90% of mice relapsed. Surprisingly, several mice became moribund or developed hind-limb paralysis within 1 to 2 days of completing a course of nilotinib or while still receiving treatment. This rapid relapse also occurred in 3 mice that received nilotinib only and were depleted of CD4+ T cells. Prior studies have demonstrated that spontaneous BCR-ABL tyrosine kinase domain mutations occur in Ph+ ALL models when mice are treated with dasatinib, leading to relapse.10 We therefore hypothesized that this may also occur with nilotinib monotherapy. Genomic DNA was isolated from the spleens of moribund mice that had progressed early, and Sanger sequencing was performed on the BCR-ABL tyrosine kinase domain. This revealed the universal presence of well-known tyrosine domain escape mutations, including T315I and E255K, in 6 mice that developed leukemia at early timepoints (Figure 2C). PD-L1-targeting mAb therapy therefore appears to largely overcome this commonly encountered clinical mechanism of resistance.
To investigate whether mice surviving long-term after treatment with nilotinib and PD-L1 had developed a memory response, we rechallenged such mice with a second injection of 2500 LM138 cells. Results of these studies showed elicitation of a protective memory response sufficient to prevent leukemia reestablishment in ∼78% of the long-term surviving mice (supplemental Figure 4). Similar experiments were conducted with depletion of CD4+ T cells shortly before rechallenge. Depletion of CD4+ T cells led to leukemic relapse in 50% of mice. In 2 additional mice, relapse occurred upon T-cell depletion even before rechallenge (data not shown). We conclude that mice surviving long-term after nilotinib and anti–PD-L1 therapy can eradicate measurable residual disease but alternatively may enter a state of equilibrium in which low-level leukemia is controlled by the elicited T-cell response.
scRNAseq reveals multiple subsets of CD4+ T cells elicited during leukemia development and treatment
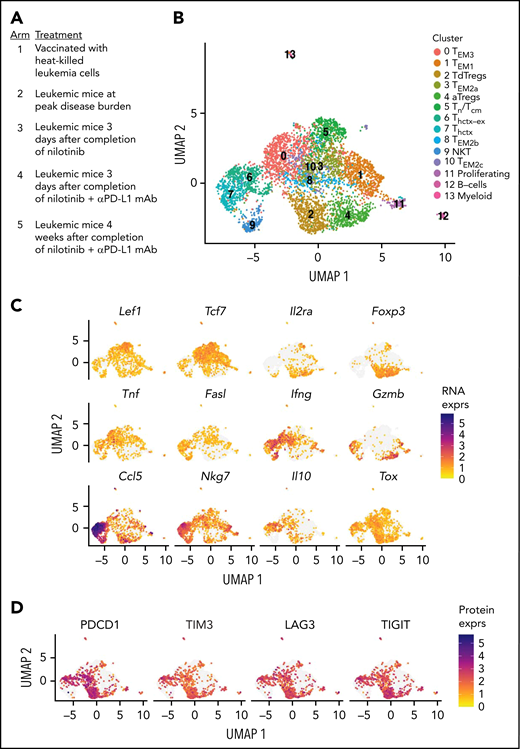
To characterize the effects of leukemia challenge and PD-L1 therapy on CD4+ T cells in the bone marrow and spleen, we performed scRNAseq/CITE-Seq/TCRseq. CD4+ T cells were sorted with FACS and captured simultaneously from 5 parallel treatment arms (Figure 3A). Sorted cells were enriched for CD44 positivity to focus on antigen-experienced cells. Mice in arm 1 were vaccinated with heat-killed leukemia. Mice in arm 2 received no therapy and were analyzed at day 16 after leukemia injection. Mice in arms 3 and 4 were injected with leukemia and then on day 14 after injection treated with nilotinib or nilotinib plus anti–PD-L1 mAb, respectively, for 2 weeks. Mice in arm 5 were long-term survivors that had successfully been treated with nilotinib plus anti–PD-L1 mAb. We used oligonucleotide-conjugated tags (“hashtag” antibodies) to identify the treatment arm and anatomical compartment (spleen or bone marrow) from which each cell originated. Additionally, we included CITE-Seq antibodies toward surface proteins PD1, TIM3, CD25, LAG3, and TIGIT. After quality control, transcriptomes from 5349 combined single CD4+ T cells were fully analyzed. A dimensional reduction with graph-based clustering approach was applied to combined data from all 5 treatment arms to identify CD4+ T-cell subsets. This generated 13 clusters of cells (Figure 3B). Comparison of differentially expressed transcripts between bone marrow- and splenic-derived CD4+ T cells revealed minimal differences (supplemental Figure 5; supplemental Table 1).
scRNA sequencing reveals heterogeneous CD4+ T-cell subsets in leukemic mice. (A) CD44+CD4+ T cells from the indicated treatment arms were sorted for scRNA and scTCR sequencing (n = 4 mice/arm). Results of a single scRNAseq experiment. All cells were harvested and processed for scRNAseq simultaneously to avoid batch effects in downstream processing. Leukemia establishment and subsequent treatments were offset, relative to each other, to allow for this. (B) UMAP plots showing the subsets of CD4+ T cells identified. (C) UMAP feature plots showing the expression of key genes in the different clusters of CD4+ T cells. (D) Normalized CITE-Seq antibody expression of the indicated exhaustion markers on CD4+ T cells.
scRNA sequencing reveals heterogeneous CD4+ T-cell subsets in leukemic mice. (A) CD44+CD4+ T cells from the indicated treatment arms were sorted for scRNA and scTCR sequencing (n = 4 mice/arm). Results of a single scRNAseq experiment. All cells were harvested and processed for scRNAseq simultaneously to avoid batch effects in downstream processing. Leukemia establishment and subsequent treatments were offset, relative to each other, to allow for this. (B) UMAP plots showing the subsets of CD4+ T cells identified. (C) UMAP feature plots showing the expression of key genes in the different clusters of CD4+ T cells. (D) Normalized CITE-Seq antibody expression of the indicated exhaustion markers on CD4+ T cells.
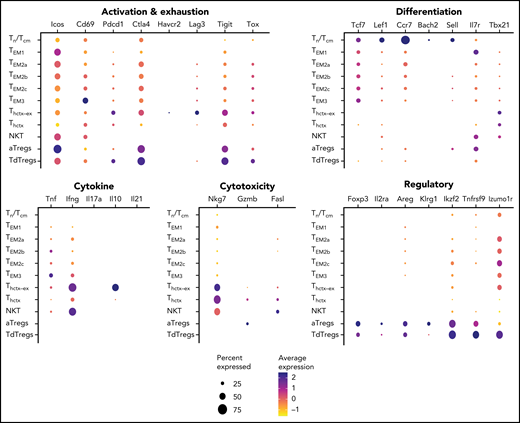
We assessed the transcriptomic differences between clusters to identify known and novel T-cell subsets (Figure 4; supplemental Figure 6). Naïve/central-memory T cells (Tn/cm) were identified by the expression of Ccr7, Ltb, and Sell in cluster 5. Clusters 0, 1, 3, 8, and 10 harbored transcriptomes of effector-memory subsets, based on shared expression of Tbx21, Runx3, Stat6, Tcf7, CD40lg, and Gata3. Other genes recently associated with effector-memory CD4+ T cells were also well represented in these clusters, including Lgals1, S100a4, and Itgbp1.13,14 Three clusters (3, 8, and 10) composed of small numbers of cells, centrally located in the combined Uniform Manifold Approximation and Projection (UMAP) plot, overexpressed limited numbers of genes that did not allow further specification by comparison with existing datasets. These included CD200, Tnfsf8 (CD30L), and Izumo1r (supplemental Figure 7) Cells at the opposite boundaries of clusters 0 and 1 reached terminal differentiation status, suggesting continuous but opposing gradients of differentiation. For example, Il17a expression was confined to a peripheral location of cells in cluster 1, but Ifng production was largely limited to cluster 0 cells. Genes associated with the TCR-signaling axis, including CD69, Dusp1, and Klf2, were also relatively overexpressed in cluster 0 versus other TEM subsets. Altogether, these 5 clusters of TEM cells harbored transcriptomes more complex than those observed by elicitation of CD4+ T-cell subsets in strict cytokine-polarizing culture conditions (Figure 4).15 We conclude that TEM cells elicited by B-ALL are not well defined by classic TH subtypes but instead express gradients of canonical transcription factors, similar to TEM responding to complex microbial infections.
Dot plots showing the expression of the indicated genes in the different CD4+ T-cell clusters. The size of the spot indicates the proportion of cells in that cluster that express the indicated gene, while the color of the spot indicates the mean level of expression per cell.
Dot plots showing the expression of the indicated genes in the different CD4+ T-cell clusters. The size of the spot indicates the proportion of cells in that cluster that express the indicated gene, while the color of the spot indicates the mean level of expression per cell.
Clusters 2 and 4 were identified as regulatory T cells based on Foxp3 and Il2ra expression. Both clusters appeared to have reached a late stage of differentiation, based on shared upregulation of Areg, Il10, Penk, Ikzf2, Ctla4, Tigit, Klrg1, and Pdcd1.16 Comparison of differentially expressed genes between clusters 2 and 4 revealed slightly higher expression of markers associated with terminal differentiation in cluster 4, including Klrg1, Icos, and GzmB (supplemental Figure 8). Additionally, a subset of natural killer T cells (cluster 9) was identified by their differential overexpression of killer cell lectin receptor superfamily members Klrb1c, Klrk1, Klrd1, Klrc1, Klrk1, along with Xcl1, Il4, Cd160, and TCR genes known to be associated with CD1d binding, including Trbv13-2 and Trbv2. A small number of cells (cluster 11) were dominated by expression of Mki67 and other transcripts related to active proliferation.
Clusters 6 and 7 were of particular interest. These 2 clusters were closely related, with both overexpressing transcripts associated with cytotoxicity, including Gzmb, Gzmk, Nkg7, Eomes, and Fasl, as well as cytokines Ifng, Tnf, Il10, Il21, and chemokines Ccl3, Ccl4, and Ccl5 (Figures 3C and 4; supplemental Table 2). Expression of the master transcription factor Tbx21 (Tbet) was also highest in these clusters. We therefore considered both clusters to represent helper/cytotoxic cells (Thctx). Cluster 6 was notably differentiated from cluster 7 by the relative overexpression of surface activating/inhibitory receptor transcripts Pdcd1, Lag3, and Havcr2. Relative overexpression of their protein products PD1, TIM3, and LAG3 was also specifically observed in cluster 6 cells by CITE-Seq analysis (Figure 3D). Cluster 6 cells were therefore considered phenotypically exhausted cytotoxic/effectors (Thctx-ex).
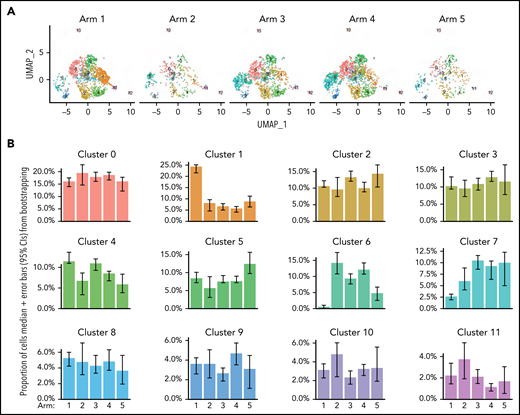
We next separated cells based on their treatment arm of origin (Figure 5A). We compared the proportion of cell subsets across all 5 treatment arms (supplemental Table 3). Strikingly, mice vaccinated with heat-killed LM138s plus CFA were found to have a higher frequency of TEM1 cells but had relatively few Thctx or Thctx-ex cells (Figure 5B). In contrast, among treatment arms 2 to 5 (all of which had experienced live leukemia challenge), a higher frequency of Thctx and Thctx-ex cells was consistently observed.
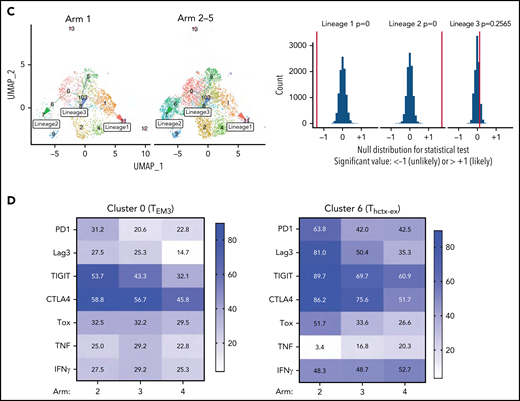
Leukemia induces a unique T-helper/cytotoxic subset that is impacted by nilotinib and anti–PD-L1. (A) UMAP plots showing the CD4+ T-cell subsets stratified by treatment arm. The number of cells in each arm is as follows: n = 1591 cells for arm 1; n = 417 cells for arm 2; n = 1290 cells for arm 3; n = 1692 cells for arm 4; and n = 359 cells for arm 5. (B) Plots showing the proportion of cells in each cluster that came from each treatment arm. Error bars represent 95% confidence intervals generated using a bootstrapping approach. (C) UMAP plots (left) showing the trajectory relationships between clusters via slingshot, stratified by either CD4+ T cells from arm 1 (heat-killed leukemia immunized mice) or arms 2 to 5 (mice with live leukemia). Histogram (right) of permutation test statistics under the null hypothesis (gray bars) and the initial test statistic (red line). Test statistics were calculated as the difference in means of lineage-weighted pseudotime values between CD4+ T cells from arms 2 to 5 (mice with live leukemia) following lineages 1, 2, or 3, relative to CD4+ T cells from arm 1 (heat-killed leukemia). (D) Heat maps showing the proportion of CD4+ T cells in the indicated cluster from the respective treatment arms that express the indicated gene.
Leukemia induces a unique T-helper/cytotoxic subset that is impacted by nilotinib and anti–PD-L1. (A) UMAP plots showing the CD4+ T-cell subsets stratified by treatment arm. The number of cells in each arm is as follows: n = 1591 cells for arm 1; n = 417 cells for arm 2; n = 1290 cells for arm 3; n = 1692 cells for arm 4; and n = 359 cells for arm 5. (B) Plots showing the proportion of cells in each cluster that came from each treatment arm. Error bars represent 95% confidence intervals generated using a bootstrapping approach. (C) UMAP plots (left) showing the trajectory relationships between clusters via slingshot, stratified by either CD4+ T cells from arm 1 (heat-killed leukemia immunized mice) or arms 2 to 5 (mice with live leukemia). Histogram (right) of permutation test statistics under the null hypothesis (gray bars) and the initial test statistic (red line). Test statistics were calculated as the difference in means of lineage-weighted pseudotime values between CD4+ T cells from arms 2 to 5 (mice with live leukemia) following lineages 1, 2, or 3, relative to CD4+ T cells from arm 1 (heat-killed leukemia). (D) Heat maps showing the proportion of CD4+ T cells in the indicated cluster from the respective treatment arms that express the indicated gene.
To identify potential lineage relationships between clusters in the different treatment arms, we carried out pseudotime analysis (Figure 5C). This was performed by anchoring our start point in the naïve-like T-cell cluster (cluster 5) and using slingshot to establish projected differentiation pathways. This approach revealed a bifurcation in differentiation toward either a TEM1 state (clusters 1 and 11) or a helper/cytotoxic T-helper state (clusters 6 and 7). This result fit with our data above, suggesting that these lineages arise under different priming conditions: immunization with CFA drove a TEM1 response whereas live leukemia induced Thctx and Thctx-ex cell subsets.
PD-L1 targeting therapies expand a clone of leukemia-specific CD4+ T cells with capacity for both T-helper and cytotoxic functions
Comparison of differentially expressed genes between clusters from different treatment arms revealed few statistically significant changes. However, comparison of a panel of preselected targets of interest revealed coordinated decreases in inhibitory receptor transcript levels and increased effector cytokine levels in mice treated with nilotinib with or without anti–PD-L1 mAb (Figure 5D). This was most notable for clusters 0 and 6, which exhibited reduced expression of Pdcd1, Lag3, Tigit, Ctla4, and Tox and increased expression of Tnf in arms 3 and 4 (Nilotinib +/− anti–PD-L1) versus arm 2 (no treatment). Thus, treatment with nilotinib was associated with diminished CD4+ T-cell exhaustion.
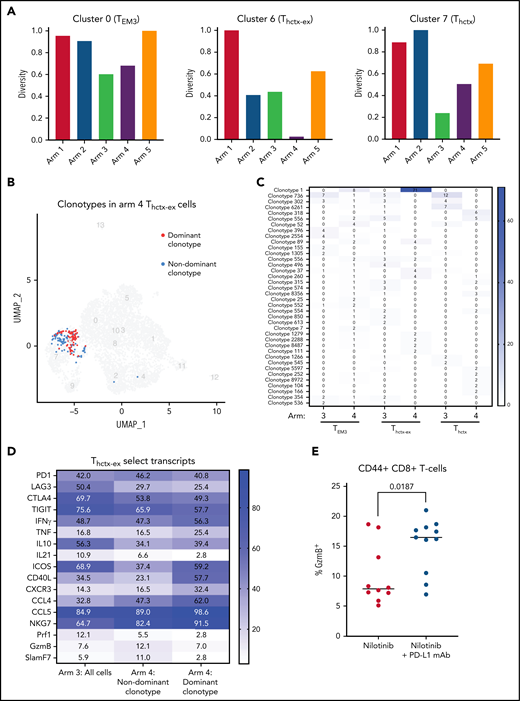
To examine whether nilotinib and anti–PD-L1 alter the clonality of the previously identified CD4+ T-cell populations, we turned to scTCRseq. This revealed significant alterations in repertoire diversity across treatment arms and cell clusters. Clonotype diversity was relatively unaffected in arm 2 (leukemia alone) for clusters 0 (TEM3) and 7 (Thctx) but decreased dramatically in cluster 6 (Thctx-ex), suggesting clonal expansion of leukemia specific clones. In arms 3 (nilotinib) and 4 (nilotinib plus anti–PD-L1), TCR diversity decreased in all 3 clusters, suggesting the expansion of leukemia-specific clones upon treatment. Finally, at much later time points when leukemia was either cleared or below detectable levels (arm 5), TCR diversity increased, consistent with contraction of a leukemia-specific immune response (Figure 6A; supplemental Figure 9).
PD-L1 blockade is associated with an expansion of a dominant CD4+ Thctx clone. (A) TCR diversity (Inverse Simpson’s coefficient) in the T cells from clusters 0, 6, and 7 stratified by treatment arm. (B) UMAP plot showing the dominant clonotype (red; n = 71 cells) vs other T cells (blue; n = 91 cells) in cluster 6 of nilotinib plus PD-L1 mAb-treated mice (arm 4). (C) Heatmap showing the numerical representation of the expanded T-cell clones present in the indicated clusters from mice treated with nilotinib plus isotype (arm 3) or nilotinib plus PD-L1 blockade (arm 4). An expanded clone was defined as one that had more than 2 cells present in at least 1 cluster from 1 treatment arm. Each box represents the number of T cells in the indicated treatment arm that belongs to the indicated T-cell clone. (D) A heatmap showing the proportion of the dominant clonotype T cells expressing the indicated genes, relative to other T cells in cluster 6 of nilotinib plus anti–PD-L1–treated mice (arm 4) or T cells in cluster 6 of nilotinib plus isotype-treated mice (arm 3). (E) Flow plots and graphs showing the proportion of GZMB+CD8+ T cells in mice treated with nilotinib and PD-L1 blockade or nilotinib and an isotype control antibody. Mice were analyzed 1 day after completion of treatment with nilotinib +/− PD-L1 blockade. The median is displayed, and statistical significance was determined using an unpaired t-test (n = 10 mice per treatment arm; results represent 2 independent experiments).
PD-L1 blockade is associated with an expansion of a dominant CD4+ Thctx clone. (A) TCR diversity (Inverse Simpson’s coefficient) in the T cells from clusters 0, 6, and 7 stratified by treatment arm. (B) UMAP plot showing the dominant clonotype (red; n = 71 cells) vs other T cells (blue; n = 91 cells) in cluster 6 of nilotinib plus PD-L1 mAb-treated mice (arm 4). (C) Heatmap showing the numerical representation of the expanded T-cell clones present in the indicated clusters from mice treated with nilotinib plus isotype (arm 3) or nilotinib plus PD-L1 blockade (arm 4). An expanded clone was defined as one that had more than 2 cells present in at least 1 cluster from 1 treatment arm. Each box represents the number of T cells in the indicated treatment arm that belongs to the indicated T-cell clone. (D) A heatmap showing the proportion of the dominant clonotype T cells expressing the indicated genes, relative to other T cells in cluster 6 of nilotinib plus anti–PD-L1–treated mice (arm 4) or T cells in cluster 6 of nilotinib plus isotype-treated mice (arm 3). (E) Flow plots and graphs showing the proportion of GZMB+CD8+ T cells in mice treated with nilotinib and PD-L1 blockade or nilotinib and an isotype control antibody. Mice were analyzed 1 day after completion of treatment with nilotinib +/− PD-L1 blockade. The median is displayed, and statistical significance was determined using an unpaired t-test (n = 10 mice per treatment arm; results represent 2 independent experiments).
Examination of the paired α and β TCR sequences among Thctx-ex cells (cluster 6) revealed significant expansion of a single TCR clone (Figure 6B-C; supplemental Figure 10). In fact, approximately half of the T cells in cluster 6 of mice treated with nilotinib plus anti–PD-L1 (arm 4) expressed 1 dominant TCR. Comparison of gene expression patterns between Thctx-ex cells expressing the dominant TCR clonotype vs all other Thctx-ex cells revealed that T cells expressing the dominant clonotype upregulated cytokines, chemokines, and receptors associated with helper/effector function, including Ifng, Tnf, Cd40l, Ccl4, and Cxcr3 (Figure 6D). Likewise, T cells expressing the dominant clonotype also showed the strongest downregulation of inhibitory receptors, including Lag3, Ctla4, and Tigit. Thus, CD4+ T cells expressing this dominant TCR clonotype appear to exhibit potent effector function. The increased expression of T-helper molecules by expanded CD4s coincided with increased granzyme B (GZMB) positivity among CD8+ T cells, suggesting that PD-L1 mAb therapy may ultimately augment both CD4+ and CD8+ T-cell activity (Figure 6E).
To determine whether T cells expressing this dominant clonotype recognized leukemia antigens, we cloned the paired α and β sequences of this TCR and generated retroviruses expressing this unique TCR. The retrovirus used included a LoxP-STOP-LoxP cassette in front of the TCR α gene to allow for more physiological “on-time” T-cell development in the thymus (supplemental Figure 11).17 Using this retrovirus, we made retrogenic mice with Cd4-Cre x Rag2−/− for donor bone marrow (supplemental Figure 12A). CD4+ T cells from the donor bone marrow in these mice all expressed TCRVb7 (supplemental Figure 12B). To determine if this TCR recognized leukemia antigens, we cultured purified T cells with IFN-γ–exposed leukemia cells or splenic B cells from naïve mice. Dominant clonotype expressing T cells upregulated CD44 after coculture with leukemia cells but not normal splenic B cells, confirming their specificity for leukemia antigens (supplemental Figure 12C-D).
Human patients with B-ALL harbor CD4+ Thctx-ex cells at diagnosis
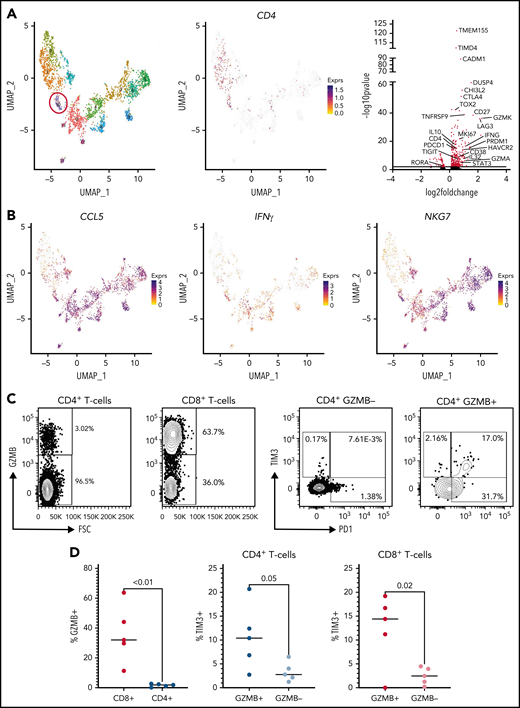
To investigate whether phenotypically exhausted T cells from patients with B-ALL were similar to those observed in our murine model, we performed scRNAseq analysis of T cells isolated from diagnostic bone marrow biopsy samples from 5 different patients. scRNAseq identified a small population of CD4+ T cells expressing cytotoxicity-associated transcripts, including NKG7, GZMA, and GZMK (Figure 7A-B). Like murine Thctx-ex cells (supplemental Figure 13), this cluster demonstrated relative overexpression of activation/exhaustion markers PDCD1, HAVCR2, LAG3, and TIGIT as well as the chemokine receptor CCL5. IFNG expression was also preserved. Analysis of surface protein markers by flow cytometry confirmed that a small population of GZMB+CD4+ T cells was present and preferentially expressed TIM3 (Figure 7C-D). Thus, markers of phenotypic exhaustion identify a population of Thctx cells among patients with B-ALL that expresses a similar core transcriptional program as Thctx cells observed in murine models.
Helper/cytotoxic exhausted CD4+ T cells are observed in human patients with B-ALL. (A) UMAP plot of CD3+ T cells sorted from diagnostic bone marrow biopsy samples of 5 patients with B-ALL. A population of CD4+ T cells expressing markers of cytotoxicity was identified (red circle; left panel). Feature plot showing CD4 expression (middle panel). The volcano plot illustrates significantly differentially expressed genes between this cluster (n = 69 cells) as compared with all others (n = 2442 cells); transcripts identified with a false discovery rate (FDR) >2 are highlighted in red (right panel). (B) Feature plots showing expression of CD4, CCL5, IFNG, and NKG7. (C) Representative plots using flow cytometry to profile the frequency of GZMB+ cells between CD4+ and CD8+ T cells (left panels) and the relative distribution of TIM3 positivity in either GZMB− or GZMB+ cells (right panels). (D) Graphs showing the frequency of GZMB+ cells in CD4+ and CD8+ T cells and the relative distribution of TIM3+ events in either GZMB− or GZMB+ cells. The median is displayed, and statistical significance was determined using an unpaired t-test. The data from diagnostic samples from 5 patients are summarized.
Helper/cytotoxic exhausted CD4+ T cells are observed in human patients with B-ALL. (A) UMAP plot of CD3+ T cells sorted from diagnostic bone marrow biopsy samples of 5 patients with B-ALL. A population of CD4+ T cells expressing markers of cytotoxicity was identified (red circle; left panel). Feature plot showing CD4 expression (middle panel). The volcano plot illustrates significantly differentially expressed genes between this cluster (n = 69 cells) as compared with all others (n = 2442 cells); transcripts identified with a false discovery rate (FDR) >2 are highlighted in red (right panel). (B) Feature plots showing expression of CD4, CCL5, IFNG, and NKG7. (C) Representative plots using flow cytometry to profile the frequency of GZMB+ cells between CD4+ and CD8+ T cells (left panels) and the relative distribution of TIM3 positivity in either GZMB− or GZMB+ cells (right panels). (D) Graphs showing the frequency of GZMB+ cells in CD4+ and CD8+ T cells and the relative distribution of TIM3+ events in either GZMB− or GZMB+ cells. The median is displayed, and statistical significance was determined using an unpaired t-test. The data from diagnostic samples from 5 patients are summarized.
Discussion
The treatment of B-ALL has been revolutionized by therapies that harness T-cell–mediated attack, in particular CAR T cells and the bispecific T-cell engager blinatumomab. However, the nature of the endogenous anti-leukemia T-cell response and its potential for augmentation by checkpoint blockade have been relatively uncharacterized. Studies of patients with B-ALL across all clinical demographics have consistently determined that phenotypically exhausted CD4+ T cells are a negative prognostic factor, implying that their reinvigoration may impart enhanced activity and efficacy.3-5
Here we discovered several insights into the nature of leukemia-induced T-cell dysfunction and the actions of PD-L1 blockade in B-ALL. Murine leukemia induced PD1+TIM3+CD4+ T cells in a TCR-dependent manner. This was associated with a significant loss of TNF production but largely preserved capacity for IFN-γ synthesis. It contrasts with typical patterns of effector cytokine loss in terminally exhausted CD8+ T cells observed in solid malignancies.18,19 It is possible that our murine leukemia challenge experiments may have missed more advanced states of CD4+ terminal T-cell exhaustion due to the rapid progression of disease. However, analysis of CD4+ T cells from human samples revealed similar transcriptional patterns, which included preserved IFNG transcription. Furthermore, CD8+ T cells in murine models of advanced acute myeloid leukemia were recently found to maintain proliferative capacity and effector cytokine transcription despite upregulation of multiple inhibitory receptors.20 Finally, recent observations of 2 patients with chronic lymphocytic leukemia who survived in prolonged remission (∼10 years) after CAR T-cell therapy were found to harbor a sizeable population of phenotypically exhausted but functional CD4+ CAR T cells.21 Altogether, these findings reveal that phenotypically exhausted anti-leukemia T cells maintain functional properties despite expressing multiple inhibitory receptors.
CD4+ T cells elicited by live leukemia challenge were heterogeneous and included a subset of cells expressing transcripts related to both cytotoxicity and T-helper functions (Thctx). We demonstrate that phenotypically exhausted CD4+ T cells, known to predict adverse outcomes in ALL, predominantly derive from cells with such cytotoxic potential. Furthermore, Thctx and Thctx-ex cells were characterized by Tcf7 downregulation and Tox upregulation, similar to observations of exhausted CD8+ T cells and long-term persisting CD4+ CAR T cells.21-25 In addition to their cytotoxic signature and potential, expanded CD4+ Thctx-ex clones of this subset were found to have relatively preserved expression of the helper cytokine Cd40l after PD-L1 checkpoint blockade. This was associated with preserved GZMB expression among CD8+ T cells, implying that T-helper activity is also an important property of this subset. Finally, Thctx and Thctx-ex cells from both mice and humans also uniquely expressed high levels of the chemokine Ccl5. Altogether, this implies that Thctx CD4+ cells play critical roles in recruiting multiple cell types to fully orchestrate a complete anti-leukemia immune response. This is congruent with multiple recent observations that cytotoxic CD4+ T cells play critical broad roles in tumor immunity.26-30 Treatment with anti–PD-L1 mAb therapy led to clonal expansion of CD4+ Thctx-ex cells, reminiscent of clonal expansion of exhausted CD8+ T cells after checkpoint blockade.31 Future studies using leukemia-specific retrogenic or transgenic T-cell clones may be able to delineate the molecular mechanisms governing the expansion and function of this subset.
The synergy observed by combining tyrosine kinase inhibitors with checkpoint blockade is likely multifactorial. Tyrosine kinase inhibitor–mediated reduction of leukemia burden increases the ratio of effector/target T cells to favor T cells, whose function is further augmented by the addition of PD-L1 blockade. Additionally, individual tyrosine kinase inhibitors have a multitude of effects on T-cell activity, which may ultimately enhance or detract from their efficacy. For example, dasatinib can inhibit activation of CAR T cells as well as endogenous T cells responding to bispecific T-cell engagers in vitro, yet it is clinically effective when given in combination with blinatumomab.32-34 These effects may be mediated via off-target effects on SRC kinase family members or by diminishing the frequency of T-regulatory cells.35-38 Finally, tyrosine kinase inhibitors may promote anti-leukemia immune responses by inducing MHCII on the leukemia cells and by inducing proinflammatory cell death.39,40 Efforts to counter exhaustion among patients with B-ALL will need to consider rational drug combination and sequencing of cytotoxic chemotherapies, immunotherapies, and tyrosine kinase inhibitors.
Our findings support ongoing efforts to use PD1/PD-L1 checkpoint blockade in the clinical setting and emphasize a need for further research to understand the origins and functions of cytotoxic CD4+ T cells in the setting of hematologic malignancies.41,42
Acknowledgments
The authors thank G. Hubbard for assistance with mouse procedures; T. Martin, J. Motl, and P. Champoux for cell sorting and maintenance of the Flow Cytometry Core Facility at the University of Minnesota (5P01AI035296); and E. Stanley and UMGC core for assistance with scRNAseq. The authors also acknowledge the Minnesota Supercomputing Institute (MSI) at the University of Minnesota for providing computational resources.
This work was supported by a hematology training grant (T32HL007062) (S.I.T.). Funding was provided by the Masonic Cancer Center and an R01 grant (R01 CA232317), a grant from Merck (M.A.F.), and a grant from the Children’s Cancer Research Fund (M.A.F. and S.I.T.).
Authorship
Contribution: S.I.T., M.A.F., C.H., and H.V. designed experiments; S.I.T., H.V., L.M.H.-H., and C.H. performed experiments and analyzed data; V.B. provided tissue samples, designed experiments, and reviewed the manuscript; T.P.K. analyzed data; and S.I.T., H.V., and M.A.F. wrote the manuscript.
Conflict-of-interest disclosure: C.H. is currently an employee of Orion Pharma, Finland. V.B. received research funding from Bristol Myers Squib, Incyte, Gamida Cell, and FATE Therapeutics, received consultancy fees from Karyopharma and Gamida Cell, and is a board member of Miltenyi DSMB. M.A.F. received research funding from Merck. The remaining authors declare no competing financial interests.
Correspondence: Michael A. Farrar, 2101 6th St SE, 2-116 Wallin Medical Biosciences Building, Minneapolis, MN 55455; e-mail: farra005@umn.edu.
All scRNAseq/CITE-Seq/TCRseq has been deposited in GEO with the accession number GSE195964.
The online version of this article contains a data supplement.
There is a Blood Commentary on this article in this issue.
The publication costs of this article were defrayed in part by page charge payment. Therefore, and solely to indicate this fact, this article is hereby marked “advertisement” in accordance with 18 USC section 1734.
REFERENCES
Author notes
S.I.T. and H.V. contributed equally to this study.

This feature is available to Subscribers Only
Sign In or Create an Account Close Modal