

Page 663: In Figure 2A, due to an error in figure assembly, the representative plot of a knockout (KO) mouse on the right is a duplicate of the plot of a heterozygous (HET) mouse (middle plot), and the plots represent the total splenic lymphocytes stained for B220 and the germinal-center (GC) marker peanut agglutinin (PNA), while the percentages in the plots indicate the percentages of PNA+ cells within the B220+ population, as also shown in Figure 2B. A corrected Figure 2A is shown below and displays, for each genotype, the strategy used to identify GC B cells by PNA staining upon gating for B220+ cells. The percentages of GC B cells identified with this strategy are reported in Figure 2B of the original article for all mice in the cohort. This error does not affect the conclusions of the study.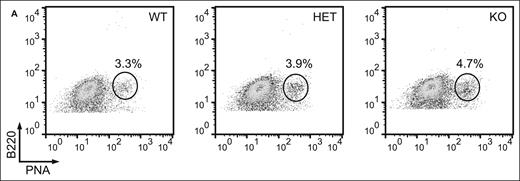 Close modal
Figure 2

FBXO11 deletion leads to an increase in GC B cells and affects the DZ/LZ ratio. (A) Flow cytometry analysis of splenic mononuclear cells from age-matched FBXO11+/+-Cγ1cretg/+ (WT), FBXO11fl/+-Cγ1cretg/+ (HET), and FBXO11fl/fl-Cγ1cretg/+ (KO) for lectin PNA and the B-cell marker B220. Mice were immunized with SRBCs 10 days prior to the analysis.
Figure 2
FBXO11 deletion leads to an increase in GC B cells and affects the DZ/LZ ratio. (A) Flow cytometry analysis of splenic mononuclear cells from age-matched FBXO11+/+-Cγ1cretg/+ (WT), FBXO11fl/+-Cγ1cretg/+ (HET), and FBXO11fl/fl-Cγ1cretg/+ (KO) for lectin PNA and the B-cell marker B220. Mice were immunized with SRBCs 10 days prior to the analysis.

This feature is available to Subscribers Only
Sign In or Create an Account Close Modal