Key Points
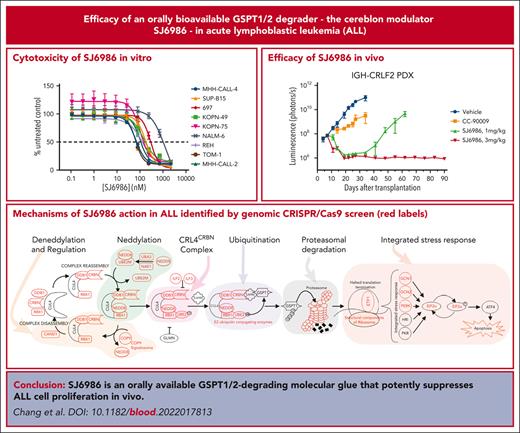
SJ6986 is an orally available GSPT1/2-degrading molecular glue that potently suppresses lymphoblastic leukemia cell proliferation in vivo.
CRISPR/CRISPR-associated protein 9 screening identified the mechanisms of action of SJ6986.
Abstract
Advancing cure rates for high-risk acute lymphoblastic leukemia (ALL) has been limited by the lack of agents that effectively kill leukemic cells, sparing normal hematopoietic tissue. Molecular glues direct the ubiquitin ligase cellular machinery to target neosubstrates for protein degradation. We developed a novel cereblon modulator, SJ6986, that exhibits potent and selective degradation of GSPT1 and GSPT2 and cytotoxic activity against childhood cancer cell lines. Here, we report in vitro and in vivo testing of the activity of this agent in a panel of ALL cell lines and xenografts. SJ6986 exhibited similar cytotoxicity to the previously described GSPT1 degrader CC-90009 in a panel of leukemia cell lines in vitro, resulting in apoptosis and perturbation of cell cycle progression. SJ6986 was more effective than CC-90009 in suppressing leukemic cell growth in vivo, partly attributable to favorable pharmacokinetic properties, and did not significantly impair differentiation of human CD34+ cells ex vivo. Genome-wide CRISPR/Cas9 screening of ALL cell lines treated with SJ6986 confirmed that components of the CRL4CRBN complex, associated adaptors, regulators, and effectors were integral in mediating the action of SJ6986. SJ6986 is a potent, selective, orally bioavailable GSPT1/2 degrader that shows broad antileukemic activity and has potential for clinical development.
Introduction
Targeted protein degradation has emerged as a highly promising therapeutic approach to selectively degrade previously intractable cancer drivers for therapeutic benefit.1 Such degraders use the ubiquitin ligase machinery to target proteins for proteosomal degradation and fall into 2 main categories. Proteolysis-targeting chimeras (PROTACs) are heterobifunctional molecules that couple a moiety interacting with a ligandable domain of a target protein through a linker to a second moiety that interacts with ubiquitin ligase, most commonly cereblon (CRBN) or von Hippel-Lindau (VHL). Molecular glues (MGs) are small molecules that directly interact with ubiquitin ligases such as CRBN and modify its substrate specificity.2 The most extensively characterized MGs are thalidomide and derivatives, the immunomodulatory drugs (IMiDs), and more recent MGs based on the IMiD scaffold, such as CC-90009.3 These MGs commonly degrade neosubstrates such as IKZF1 (Ikaros), IKZF3 (Aiolos), GSPT1/2 (G1 to S–phase transition 1/2) and/or casein kinase 1 alpha (CSNK1A1, or CK1A). Several groups have pursued rational design approaches to develop novel CRBN-interacting MGs, using IMiD or alternative structures, to influence the spectrum and selectivity of degraded neosubstrates.4-6 We previously reported the development of a MG library, screening of which in childhood cancer cell lines led to the discovery of SJ6986, a MG that demonstrated selective degradation of GSPT1/2 and potent cytotoxicity in cell-line models of medulloblastoma and KMT2A-rearranged leukemia.7 Here, we report the potent antileukemic efficacy and mechanism of action of SJ6986 in a range of in vivo models of acute lymphoblastic leukemia (ALL), supporting the potential for translation of this agent into clinical trials.
Methods
In vivo preclinical studies
Female NOD.Cg-PrkdcscidIl2rgtm1Wjl/SzJ (NSG) mice aged 8 to 12 weeks were used for xenotransplantation. All experimental work was carried out in accordance with Office of Laboratory Animal Welfare guidelines and was approved by the Institutional Animal Care and Use Committee of St Jude Children's Research Hospital. NSG mice aged 8 to 12 weeks were inoculated by tail vein injection with 1 × 10⁶ leukemic cells transduced with a lentiviral vector containing the firefly luciferase and yellow fluorescent protein genes (CL20SF2-Luc2aYFP).8 Leukemia burden was determined by weekly bioluminescence imaging using a Xenogen IVIS-200 system and Living Image software (Caliper Life Sciences). Treatment was commenced when the luminescence signal of whole body averaged ∼1 × 10⁸ photons per second. Mice were dosed by oral gavage with compound SJ6986 (1 mg/kg and 3 mg/kg, daily). CC90009 was delivered intraperitoneally (2.5 mg/kg, twice daily).3 Studies were designed to quantitate and compare leukemia burden by bioluminescent imaging after 28 days of treatment. At the end of the study, cells from the spleen, bone marrow, and blood were harvested and stained with mouse CD45-APC-Cy7 (Cat# 3557659, BD Biosciences), human CD45-BV405 (Cat# 564047, BD Biosciences), or human CD19-PE (Cat# 349209, BD Biosciences) antibodies and analyzed by flow cytometry to determine the percentage of hCD45+ cells. For immunoblotting, spleen or bone marrow leukemia cells were obtained by purification with hCD19 MicroBeads (130-050-301; Miltenyi Biotec), as per the manufacturer's protocol. Efficacy was determined by linear regression and 2-way analysis of variance using Prism (GraphPad Software, version 8.4.2).
Immunoblot analysis
Cells were washed twice with ice-cold phosphate-buffered saline and lysed in radioimmunoprecipitation assay buffer (RIPA) lysis buffer (Sigma) freshly supplemented with Halt Protease Inhibitor Cocktail (ThermoFisher Scientific) for 15 minutes on ice. The cell pellet was removed by centrifugation at 13 000g at 4°C for 15 minutes. Protein concentration was measured by bicinchoninic acid assay (ThermoFisher Scientific). Proteins were denatured in NuPAGE LDS 4× sample buffer supplemented with reducing agents (Invitrogen). Typically, between 10 μg and 20 μg of total protein was loaded per lane on a 4% to 12% NuPAGE Bis-Tris gradient gel (Invitrogen) and analyzed by standard immunoblotting. The blotting images were obtained with Li-COR Odyssey CLx and band density was analyzed by Image Studio version 4 software (LI-COR Biotechnology, Lincoln, NE). Primary antibodies used were: eRF3/GSPT1 (Abcam, ab126090), CRBN (#71810S), IKZF1 (Santa Cruz Biotechnology, SC-398265), GAPDH (Santa Cruz Biotechnology, sc-47724), and ACTB (Santa Cruz Biotechnology, SC-47778). For hCD34+ cells and U937 cells, 1 × 10⁶ cells were lysed directly in 2× LDS sample buffer (Invitrogen) with Halt protease inhibitor, incubated for 10 minutes at 95°C, and sonicated to break the DNA before loading to sodium dodecyl sulfate–polyacrylamide gel electrophoresis gel.
Mice, cell lines, normal hematopoietic samples, patient-derived xenografts, cytotoxicity assays, pharmacokinetic and pharmacodynamic studies, cell cycle and apoptosis assays, genome-wide CRISPR screen, CRISPR knockdown, colony forming unit (CFU) assay, and proteomic assays are described in the supplementary information.
Results
Broad activity of SJ6986 in ALL cell lines and xenografts
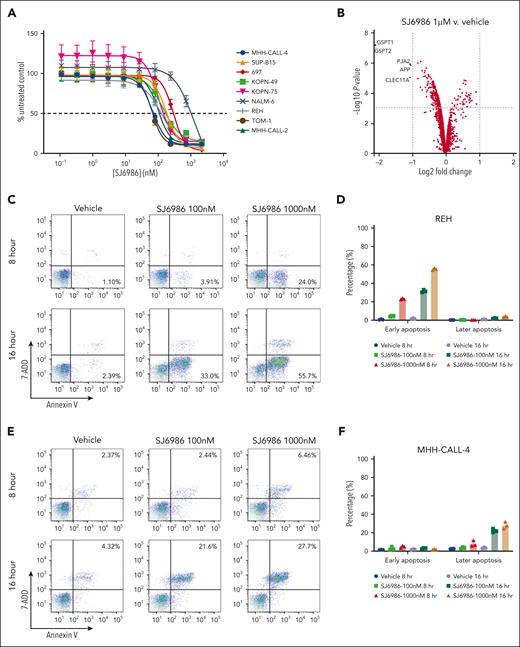
We synthesized and screened a diverse library of thalidomide analogues that resulted in identification of the potent and selective GSPT1/2 degrader SJ6986, which showed high oral bioavailability and cytotoxicity in a panel of ALL and acute myeloid leukemia (AML) cell lines and patient-derived medulloblastoma cells.7 We observed high potency of SJ6986 in the MHH-CALL-4 cell line, a model of CRLF2-rearranged Ph-like B-cell ALL (B-ALL),9 that was abrogated with CRBN knockdown (supplemental Table 1), suggesting a CRBN-dependent mechanism of action of this compound. We then tested activity in an extended panel of cell lines representing a diverse range of ALL subtypes (supplemental Table 1). SJ6986 was a potent inducer of cell death in all B-ALL cell lines tested (Figure 1A; supplemental Table 1). Testing of additional hematological malignancy cell lines showed activity in T-cell ALL (CCRF-CEM, DN41, and ALL-SIL) and JAK2-mutant myeloproliferative disease (SET-2), and showed reduced or no activity in 5 lymphoma cell lines (supplemental Table 1). SJ6986 was active in KOPN-49 cells, which harbor biallelic TP53 mutation (R283P/T284Afs∗62, data not shown; propel.stjude.cloud), suggesting the activity of SJ6986 is TP53 independent. Growth inhibition assays performed in the NCI-60 cancer cell-line panel showed activity in multiple cancer cell lines including lung, colon, central nervous system, melanoma, ovarian, renal, prostate, and breast cancer (supplemental Figure 1A-H). Next, we performed global proteomic analysis to examine the proteins degraded by SJ6986 and the GSPT1 degrader CC9000910 in MHH-CALL-4 cells after 4 hours of drug treatment. This confirmed that GSPT1 and GSPT2 were the main proteins degraded by SJ6986 (Figure 1B; supplemental Figure 2; supplemental Table 2), consistent with previous data in KMT2A-rearranged MV4-11 cells.7
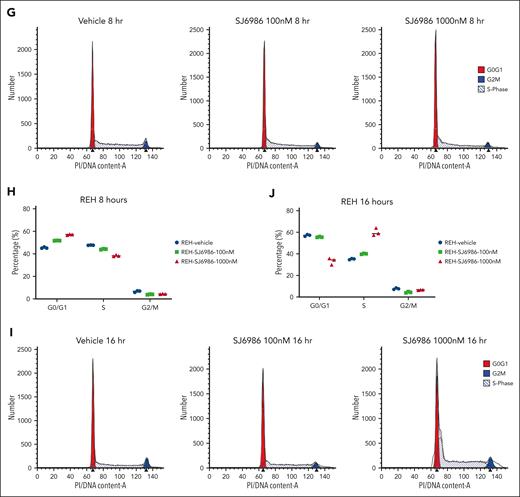
Cytotoxicity, apoptosis, and cell cycle analysis in ALL cell lines treated with SJ6986. (A) Cytotoxicity of SJ6986 in 9 different ALL cell lines (72-hour incubation). The value in the vehicle control was set as 100%. (B) Volcano plot of changes in protein abundance in MHH-CALL-4 cells treated with 1 μM of SJ6986 for 4 hours. The x-axis shows the fold changes (FCs; log2) of peptides in cells treated with compounds relative to that in vehicle control; and the y-axis shows the negative value of the log10P value. Proteins downregulated >2 fold with P value < .001 are shown in top left region. (C-D) Apoptosis of REH cells treated with 100 nM or 1000 nM of SJ6986 for both 8 and 16 hours, the percentage of early apoptotic cells is shown in the graph, and the percentage of early and late apoptotic cells are shown in panel D. (E-F) Apoptosis of MHH-CALL-4 cells treated with 100 nM or 1000 nM of SJ6986 for either 8 or 16 hours, the percentage of late apoptotic cells is shown in the graph, and the percentage of early and late apoptotic cells are shown in panel F. (G-J) The cell cycle distribution of REH cells treated with SJ6986 for 8 or 16 hours (G-I) and the percentage of G0/G1, S, and G2/M phase is shown in panels H and J.
Cytotoxicity, apoptosis, and cell cycle analysis in ALL cell lines treated with SJ6986. (A) Cytotoxicity of SJ6986 in 9 different ALL cell lines (72-hour incubation). The value in the vehicle control was set as 100%. (B) Volcano plot of changes in protein abundance in MHH-CALL-4 cells treated with 1 μM of SJ6986 for 4 hours. The x-axis shows the fold changes (FCs; log2) of peptides in cells treated with compounds relative to that in vehicle control; and the y-axis shows the negative value of the log10P value. Proteins downregulated >2 fold with P value < .001 are shown in top left region. (C-D) Apoptosis of REH cells treated with 100 nM or 1000 nM of SJ6986 for both 8 and 16 hours, the percentage of early apoptotic cells is shown in the graph, and the percentage of early and late apoptotic cells are shown in panel D. (E-F) Apoptosis of MHH-CALL-4 cells treated with 100 nM or 1000 nM of SJ6986 for either 8 or 16 hours, the percentage of late apoptotic cells is shown in the graph, and the percentage of early and late apoptotic cells are shown in panel F. (G-J) The cell cycle distribution of REH cells treated with SJ6986 for 8 or 16 hours (G-I) and the percentage of G0/G1, S, and G2/M phase is shown in panels H and J.
SJ6986 induces apoptosis and perturbs cell cycle progression in ALL cells
To investigate the mechanisms by which SJ6986 exerts cytotoxicity in ALL cells, we examined apoptosis in REH and MHH-CALL-4 cells using annexin V and 7AAD staining. SJ6986 induced early apoptosis (annexin V+; 7AAD−) in REH (ETV6::RUNX1 B-ALL) cells, but late apoptosis (annexin V+; 7AAD+) in MHH-CALL-4 (IGH::CRFL2; JAK2 R683G) cells in a dose- and time-dependent manner (Figure 1C-F), consistent with the observation that SJ6986 is more potent in MHH-CALL-4 cells than in REH cells (Figure 1A).
Cell cycle analysis using propidium iodide staining in REH cells showed that treatment with SJ6986 for 8 hours resulted in a decreased percentage of cells in S phase with an increased proportion of cells in G0/G1 phase (Figure 1G-H). However, after 16 hours of drug treatment at 1000 nM, there was an increase of cells in S phase and reduction in G0/G1 phase (Figure 1I-J), suggesting that degradation of GSPT1 delayed S phase progression.
SJ6986 did not impair differentiation of hCD34+ cells ex vivo
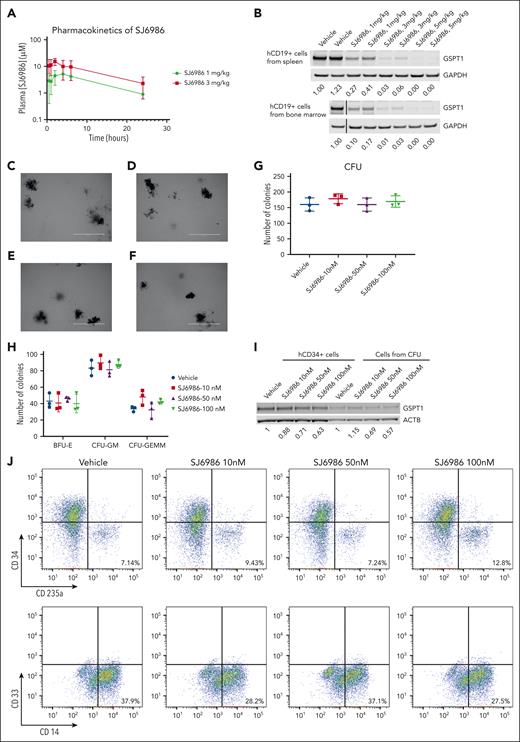
Next, we examined the activity of SJ6986 in in vivo pharmacokinetic and pharmacodynamic studies. Pharmacokinetic studies in NSG mice showed that the plasma concentration of SJ6986 was maximal 2 hours after oral gavage with 1 mg/kg and 3 mg/kg of SI6986, and remained above 1 μM for 24 hours (Figure 2A; supplemental Table 3). In vivo pharmacodynamic studies of orally administered SJ6986 in tumor-bearing NSG mice showed dose-dependent and potent degradation of GSPT1 protein, even at the lowest dose of 1 mg/kg (Figure 2B). These 2 doses were selected for subsequent in vivo efficacy studies.
In vivo pharmacokinetic, pharmacodynamic, and CFU assay of hCD34+ cells from cord blood. (A) Plasma concentration of SJ6986 in NSG mouse dosed with a single dose of SJ6986 (either 1 mg/kg or 3 mg/kg) by oral gavage. (B) SJ6986 degrades GSPT1 in a dose-dependent manner in hCD19+ cells from the spleen and bone marrow. Tumor-bearing NSG mice were dosed by oral gavage with SJ6986, daily for 2 days and hCD19+ leukemic cells were harvested 6 hours after last dosing. (C-F) The morphology of CFUs derived from hCD34+ cells treated with vehicle (C), 10 nM of SJ6986 (D), 50 nM of SJ6986 (E), and 100 nM of SJ6986 (F); bar = 2 mm. Vehicle or different concentrations of SJ6986 were added once to the medium. (G-H) The total number of CFUs is shown in panel G and the number of burst-forming unit–erythroid (BFU-E) and CFU–granulocyte erythrocyte, monocyte, megakaryocyte (CFU-GEMM) is shown in panel H. (I) Western blot of GSPT1 in hCD34+ cells treated with SJ6986 for 4 hours in culture dish as well as cells harvested from CFUs derived from hCD34+ cells on day 14. Signal was normalized to β-actin. (J) Flow cytometry analysis of cells from CFUs treated with vehicle.
In vivo pharmacokinetic, pharmacodynamic, and CFU assay of hCD34+ cells from cord blood. (A) Plasma concentration of SJ6986 in NSG mouse dosed with a single dose of SJ6986 (either 1 mg/kg or 3 mg/kg) by oral gavage. (B) SJ6986 degrades GSPT1 in a dose-dependent manner in hCD19+ cells from the spleen and bone marrow. Tumor-bearing NSG mice were dosed by oral gavage with SJ6986, daily for 2 days and hCD19+ leukemic cells were harvested 6 hours after last dosing. (C-F) The morphology of CFUs derived from hCD34+ cells treated with vehicle (C), 10 nM of SJ6986 (D), 50 nM of SJ6986 (E), and 100 nM of SJ6986 (F); bar = 2 mm. Vehicle or different concentrations of SJ6986 were added once to the medium. (G-H) The total number of CFUs is shown in panel G and the number of burst-forming unit–erythroid (BFU-E) and CFU–granulocyte erythrocyte, monocyte, megakaryocyte (CFU-GEMM) is shown in panel H. (I) Western blot of GSPT1 in hCD34+ cells treated with SJ6986 for 4 hours in culture dish as well as cells harvested from CFUs derived from hCD34+ cells on day 14. Signal was normalized to β-actin. (J) Flow cytometry analysis of cells from CFUs treated with vehicle.
To access the toxicity of SJ6986 on normal hematopoietic cells, we performed CFU assays using hCD34+ progenitor cells from human umbilical cord blood. Based on the pharmacokinetic data of SJ6986 in NSG mice and high (99.3%) plasma protein binding of SJ6986,7 the concentration of free SJ6986 in plasma was ∼37 nM and ∼107 nM when mice were dosed at 1 mg/kg and 3 mg/kg of SJ6986, respectively. Thus, we tested 3 different concentrations of SJ6986 (10 nM, 50 nM, and 100 nM) in CFU assays. After 14 days incubation, the morphology of CFUs from hCD34+ cells treated with SJ6986 was similar to that of vehicle control cells (Figure 2C-F) and the total CFU numbers and numbers of burst-forming unit–erythroid; CFU-granulocyte macrophage; and CFU–granulocyte, erythrocyte monocyte, megakaryocyte were not significantly different between treated cells and cells treated with vehicle control (Figure 2G-H). The degradation of GSPT1 by SJ6986 was confirmed in hCD34+ cells in vitro and ex vivo by western blot (Figure 2I). Flow cytometry analysis of the differentiation markers (CD34, CD235a, CD33, and CD14) in cells harvested from CFUs on day 14 also suggested SJ6986 did not impair differentiation of hCD34+ cells (Figure 2J). In conclusion, our data suggest that SJ6986 does not significantly impair the differentiation of hCD34+ cells ex vivo at the equivalent plasma concentration to in vivo studies.
SJ6986 degrades GSPT1 in CRBN mutant mice
Because of the amino acid differences between human and mouse CRBN, MGs such as thalidomide and CC-885 only degrade target proteins in mouse cells with the CRBN I1391V or V380E/I391V variants but not in wildtype cells.10,11 To test the activity of SJ6986 in murine cells, we treated spleen and bone marrow cells from wildtype C57BL/6, CRBN-I391V and CRBN-V380E/I391V knockin mice. The data suggested that both 100 nM and 10 μM of SJ6986 degraded GSPT1 significantly in cells from CRBN-I391V and CRBN-V380E/I391V mice but only 10 μM of SJ6986 degraded GSPT1 in cells from wildtype mice (supplemental Figure 3).
Activity of SJ6986 in leukemia xenografts ex vivo
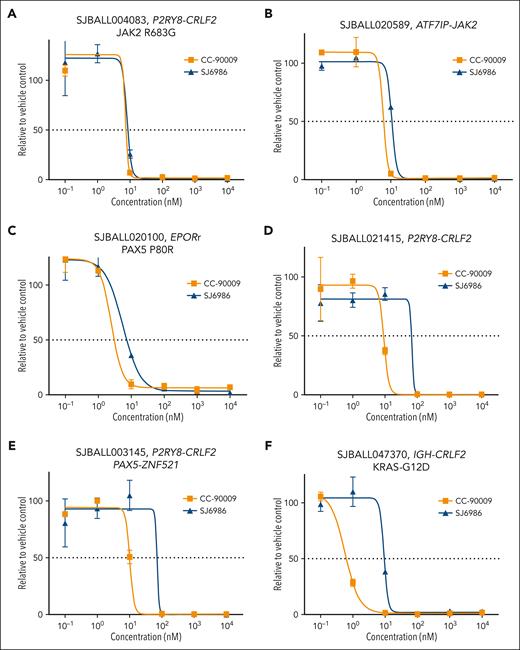
Next, we examined the cytotoxic effects of these MGs in patient-derived xenografts (PDX) representative of different B-ALL subtypes, including 6 Ph-like B-ALL tumors with different kinase signaling–activating fusions and mutations. Both CC-90009 and SJ6986 exhibited potent cytotoxicity in PDX cells (supplemental Table 4). Although both compounds exhibited similar activity in Ph-like tumors with EPOR or JAK2 fusions as well as a CRLF2-rearranged JAK2 R683G PDX (Figure 3A-C), CC-90009 exhibited slightly higher potency in 3 CRLF2-rearranged tumors (Figure 3D-F).
Ex vivo cytotoxicity of SJ6986 and CC-90009 in PDX models of Ph-like ALLs. (A-C) SJ6986 and CC-90009 showed similar potency in PDX models of ALL harboring P2RY8-CRLF2 fusion and JAK2-R683G mutation (A), ATF7IP-Jak2 fusion (B), and EPORr with PAX5-P80R mutation (C). (D-F) SJ6986 showed less potency in 3 CRLF2r PDX models with P2RY8-CRLF2 fusion (D), P2RY8-CRLF2 and PAX5-ZNF521 fusions (E), and IGH-CRLF2 fusion with KRAS-G12D mutation (F).
Ex vivo cytotoxicity of SJ6986 and CC-90009 in PDX models of Ph-like ALLs. (A-C) SJ6986 and CC-90009 showed similar potency in PDX models of ALL harboring P2RY8-CRLF2 fusion and JAK2-R683G mutation (A), ATF7IP-Jak2 fusion (B), and EPORr with PAX5-P80R mutation (C). (D-F) SJ6986 showed less potency in 3 CRLF2r PDX models with P2RY8-CRLF2 fusion (D), P2RY8-CRLF2 and PAX5-ZNF521 fusions (E), and IGH-CRLF2 fusion with KRAS-G12D mutation (F).
In vivo efficacy of SJ6986 in PDXs with different subtypes
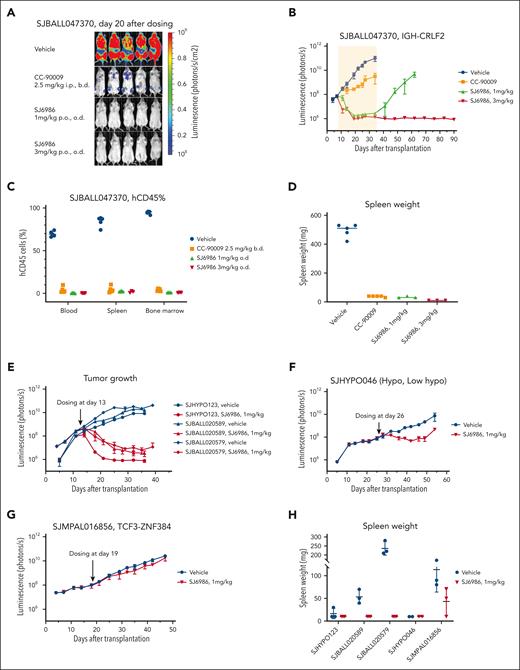
Next, we performed a 4-arm efficacy study in PDX SJBALL047370 (CRLF2-rearranged ALL). Notably, both 1 mg/kg and 3 mg/kg doses resulted in a marked reduction in tumor burden to background level (1 × 10⁶ photons per second) after 4 weeks of daily dosing; in contrast, disease remained measurable (∼3 × 10⁹ photons per second) with CC-90009 (2.5 mg/kg intraperitoneally, twice daily; Figure 4A-D). Both CC-90009 and SJ6986 were well tolerated, with no significant change in body weight (supplemental Figure 4A). Notably, for SJ6986 dosed at 3mg/kg, there was no leukemia recurrence in 2 months after cessation of treatment, suggestive of tumor eradication (Figure 4B; supplemental Figure 4B). Leukemia did recur in mice dosed with 1 mg/kg of SJ6986, 1 month after treatment cessation (Figure 4B); however leukemic cells harvested from these mice remained responsive to SJ6986 in ex vivo cytotoxicity assays and immunoblotting (supplemental Figure 4C-D). Collectively, SJ6986 exhibited similar in vitro cytotoxicity to CC-90009 but superior in vivo efficacy attributable to its favorable pharmacokinetic profile.
In vivo efficacy studies of SJ6986. (A-B) SJ6986 was more effective than CC-90009 in reducing tumor burden in PDX model of ALL (SJBALL047370 and IGH-CRLF2). The yellow shaded area is the dosing period after which dosing was stopped, and mice were monitored by imaging. (C-D) SJ6986 reduced tumor burden and spleen size in PDX model of ALL (SJBALL047370 and IGH-CRLF2). (E-H) SJ6986’s effectiveness in reducing tumor burden and spleen size varies in other PDX models of ALL; effective in SJHYPO123 (near haploid), SJBALL020589 (ATF7IP-JAK2), SJBALL020579 (EPORr); less effective in SJHYPO046 (low hypodiploid); not effective in SJMPAL016856 (PMAL, TCF3-ZNF384).
In vivo efficacy studies of SJ6986. (A-B) SJ6986 was more effective than CC-90009 in reducing tumor burden in PDX model of ALL (SJBALL047370 and IGH-CRLF2). The yellow shaded area is the dosing period after which dosing was stopped, and mice were monitored by imaging. (C-D) SJ6986 reduced tumor burden and spleen size in PDX model of ALL (SJBALL047370 and IGH-CRLF2). (E-H) SJ6986’s effectiveness in reducing tumor burden and spleen size varies in other PDX models of ALL; effective in SJHYPO123 (near haploid), SJBALL020589 (ATF7IP-JAK2), SJBALL020579 (EPORr); less effective in SJHYPO046 (low hypodiploid); not effective in SJMPAL016856 (PMAL, TCF3-ZNF384).
We then extended efficacy studies to other models of acute leukemia, including additional avatars of Ph-like,12-14 hypodiploid,15,16 and ZNF384-rearranged mixed phenotype acute leukemia (MPAL),17,18 each of which lack effective therapeutic approaches. Both Ph-like PDX and 1 hypodiploid leukemia were highly responsive to 1 mg/kg of SJ6986 (Figure 4E; supplemental Figure 5A-C); 1 low-hypodiploid PDX (SJHYPO046) showed partial response (Figure 4F; supplemental Figure 5A-C). SJ6986 resulted in reduced spleen weight, circulating human CD45+ (leukemic) cells, and leukemic infiltration of the spleen and bone marrow, but not a significant reduction in total tumor burden in SJMPAL016856 (ZNF384-rearranged B/myeloid MPAL; Figure 4G-H; supplemental Figure 5A-C). Ex vivo immunoblotting demonstrated degradation of GSPT1 in leukemic cells in both SJHYPO046 and SJMPAL016856 (supplemental Figure 5D-E), with no discernible correlation between the level of CRBN and GSPT1 proteins and responsiveness (supplemental Figure 5F). Thus, other factors in addition to target/E3 ligase expression may modulate SJ6986 activity in vivo, such as basal cellular levels of translation.16
Defining the mechanism of action of SJ6986 in ALL by functional genomic screens
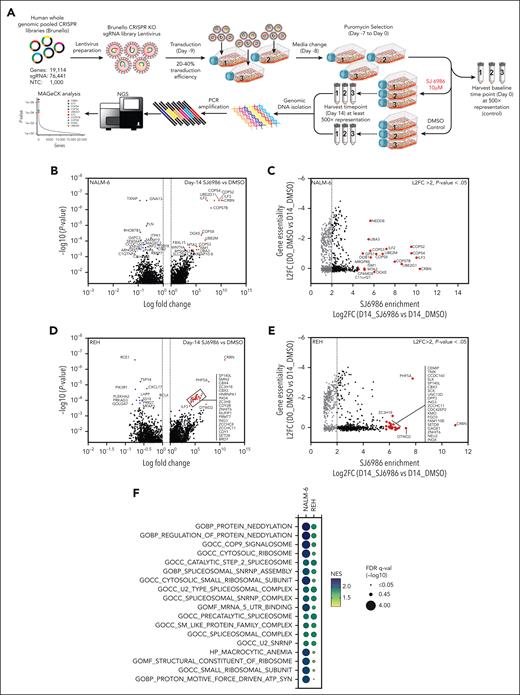
To identify the mechanism of action of SJ6986 in ALL, we performed genome-wide CRISPR–CRISPR-associated protein 9 (CRISPR/Cas9) screens to elucidate genes and pathways that regulate the response to SJ6986 (Figure 5A). NALM-6 (IGH::DUX4 B-ALL) and REH cells were transduced with the lentiviral Brunello library targeting 19 114 genes using 76 441 single-guide RNA followed by puromycin selection for 7 days and harvesting of cells at baseline (day 0) before drug or vehicle treatment. Transduced cells were divided and treated with SJ6986 or dimethyl sulfoxide (DMSO; vehicle control) for 14 days (Figure 5A). SJ6986 exhibited potent cytotoxicity in a panel of ALL cell lines including NALM-6 and REH (Figure 1A), which were amenable to genome-wide CRISPR/Cas9 screening. Inactivation of 1311 and 1391 genes was enriched in the NALM-6 and REH cell lines, respectively (P < 0.05, Figure 5B-D; supplemental Tables 5-10), with 332 genes enriched in both these cell lines, 35 of which were also identified in the functional genomic screen that examined the efficacy of CC-90009 in AML cell line U937.3 As expected, inactivation of CRBN was the top hit in both cell line CRISPR/Cas9 screens (Figure 5B-D), and upon comparison of SJ6986 enrichment scores (Figure 5C-E, x-axis, log2 fold change of SJ6986 vs DMSO at day 14) vs gene essentiality scores (y-axis, log2 fold change DMSO vehicle-treated control at day 14 vs day 0 (Figure 5C-E). In addition, genes involved in ubiquitin conjugation DDB1, RBX1 (ROC1), UBE2D3, UBE2G1, UBE2L6, UBE2T, and NEDD8 conjugation including NEDD8, NAE1, UBA3, and UBE2M were significantly enriched in at least 1 cell line (P < .05; Figure 5B-D; supplemental Tables 5-10).
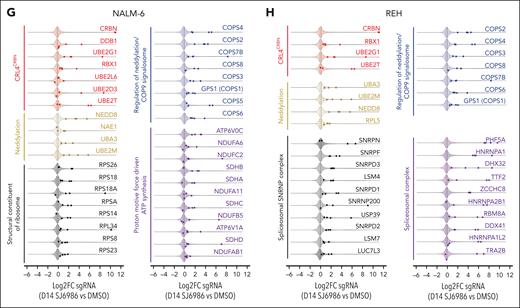
Identification of genes and pathways regulating SJ6986 response via whole-genomic CRIPSR/Cas9 screen. (A) Experimental schema showing the outline of the genome-wide CRISPR screen to identify genes responsible for SJ6986 response. NALM-6 and REH cells were transduced by Brunello CRISPR knockout library lentivirus. At 48 hours after transduction, transduced cells were selected with puromycin for 7 days followed by cell isolation for baseline time point. Cells were further divided in 2 arms for treatment with either 10 μM SJ6986 or DMSO vehicle control for an additional 14 days, followed by genomic DNA isolation, polymerase chain reaction amplification, next-generation sequencing, and analysis using MAGeCK. (B-E) Volcano plots showing positively and negatively enriched genes in NALM-6 (B) and REH (D) cell lines, respectively (comparing SJ6986 treated samples vs DMSO vehicle control samples at day 14). The x-axis represents log2 fold change (L2FC) whereas the y-axis represents −log10P value. Each dot represents individual genes, and top positively and negatively selected genes are labeled (top right and left quadrant). Volcano plot for each cell line represent data from 3 replicates. Scatter plot of genes significantly enriched by SJ6986 (P < .05) denoted by enrichment score (x-axis; log2FC of SJ6986 treated sample compared with DMSO control at day 14 (log2FC D14_SJ6986 vs D14_DMSO) and gene essentiality score (y-axis; log2FC of DMSO vehicle control at day 14 compared with day 0 (log2FC D0_DMSO vs D14_DMSO) for NALM-6 (C) and REH (E) cells, respectively. Vertical dotted line represents L2FC = 2. (F) Pathway enrichment analysis of genes enriched by SJ6986 treatment relative to DMSO control at day 14. The color and size of the dots represent normalized enrichment score (NES) and −log10 false discovery rate (FDR) q-value, respectively. Top 10 pathways from each cell line and their respective NES and FDR q-values are shown in the bubble plot. (G-H) Violin plots showing log2FC values of single-guide RNAs (sgRNAs) targeting significantly enriched genes by SJ6986, segregated by the functional categories for NALM-6 (G) and REH (H) cell lines, respectively. Central dotted line represents median log2FC of all the sgRNAs in the library. Almost all the sgRNAs in the library are located at log2FC of ∼0. Each color represents a functional module, and each dot indicates the log2FC value of an individual sgRNA targeting specific genes. Established genes known to be essential for the activity of the CRBN E3 ligase complex (red); neddylation (yellow), and regulation of neddylation/COP9 signalosome (blue). Representative genes from other modules that regulate the response to SJ6986 are proton motive force–driven ATP synthesis (purple in panel G), structural constituent of ribosome (gray in panel G), spliceosomal and small nuclear ribonucleoprotein (SNRNP) complex (purple and gray in panel H, respectively). Note that in both NALM-6 (G) and REH (H) cells multiple sgRNAs targeting each of these top genes were significantly enriched by SJ6986, clearly indicating on-target gene knockout by CRISPR/Cas9.
Identification of genes and pathways regulating SJ6986 response via whole-genomic CRIPSR/Cas9 screen. (A) Experimental schema showing the outline of the genome-wide CRISPR screen to identify genes responsible for SJ6986 response. NALM-6 and REH cells were transduced by Brunello CRISPR knockout library lentivirus. At 48 hours after transduction, transduced cells were selected with puromycin for 7 days followed by cell isolation for baseline time point. Cells were further divided in 2 arms for treatment with either 10 μM SJ6986 or DMSO vehicle control for an additional 14 days, followed by genomic DNA isolation, polymerase chain reaction amplification, next-generation sequencing, and analysis using MAGeCK. (B-E) Volcano plots showing positively and negatively enriched genes in NALM-6 (B) and REH (D) cell lines, respectively (comparing SJ6986 treated samples vs DMSO vehicle control samples at day 14). The x-axis represents log2 fold change (L2FC) whereas the y-axis represents −log10P value. Each dot represents individual genes, and top positively and negatively selected genes are labeled (top right and left quadrant). Volcano plot for each cell line represent data from 3 replicates. Scatter plot of genes significantly enriched by SJ6986 (P < .05) denoted by enrichment score (x-axis; log2FC of SJ6986 treated sample compared with DMSO control at day 14 (log2FC D14_SJ6986 vs D14_DMSO) and gene essentiality score (y-axis; log2FC of DMSO vehicle control at day 14 compared with day 0 (log2FC D0_DMSO vs D14_DMSO) for NALM-6 (C) and REH (E) cells, respectively. Vertical dotted line represents L2FC = 2. (F) Pathway enrichment analysis of genes enriched by SJ6986 treatment relative to DMSO control at day 14. The color and size of the dots represent normalized enrichment score (NES) and −log10 false discovery rate (FDR) q-value, respectively. Top 10 pathways from each cell line and their respective NES and FDR q-values are shown in the bubble plot. (G-H) Violin plots showing log2FC values of single-guide RNAs (sgRNAs) targeting significantly enriched genes by SJ6986, segregated by the functional categories for NALM-6 (G) and REH (H) cell lines, respectively. Central dotted line represents median log2FC of all the sgRNAs in the library. Almost all the sgRNAs in the library are located at log2FC of ∼0. Each color represents a functional module, and each dot indicates the log2FC value of an individual sgRNA targeting specific genes. Established genes known to be essential for the activity of the CRBN E3 ligase complex (red); neddylation (yellow), and regulation of neddylation/COP9 signalosome (blue). Representative genes from other modules that regulate the response to SJ6986 are proton motive force–driven ATP synthesis (purple in panel G), structural constituent of ribosome (gray in panel G), spliceosomal and small nuclear ribonucleoprotein (SNRNP) complex (purple and gray in panel H, respectively). Note that in both NALM-6 (G) and REH (H) cells multiple sgRNAs targeting each of these top genes were significantly enriched by SJ6986, clearly indicating on-target gene knockout by CRISPR/Cas9.
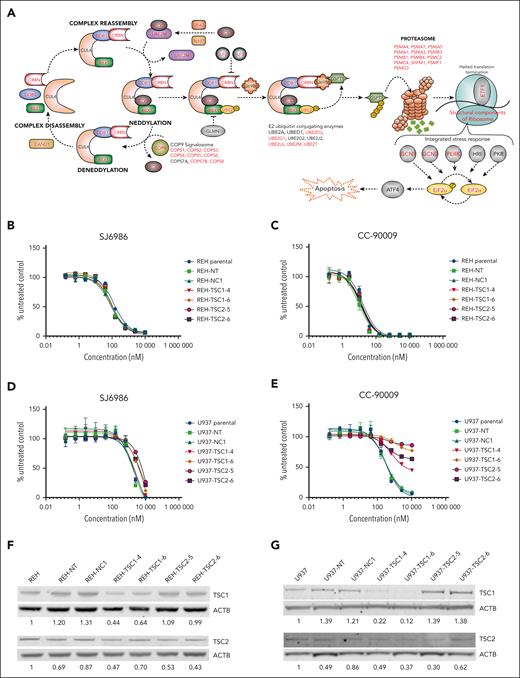
Gene-set enrichment analysis (GSEA) preranked pathway analysis identified protein neddylation, the COP9 signalosome, the ribosome, spliceosome, and proton motive force–driven adenosine triphosphate (ATP) synthesis as pathways regulating the response of ALL cells to SJ6986, consistent with the roles of these pathways in protein turnover (Figure 5F; supplemental Figures 6-7; supplemental Tables 11-14). Several genes encoding components of the CRL4CRBN complex were positively enriched in addition to CRBN in at least 1 cell line, including the adaptor proteins DDB1, RBX1 (ROC1), the ubiquitin conjugation E2 enzymes UBE2D3, UBE2G1, UBE2L6, and UBE2T (Figure 5G-H, red; supplemental Tables 5-10 and 15-16). In addition, several components of the protein neddylation pathway including NEDD8, NEDD-activating E1 enzymes (NAE1, UBA3), and ubiquitin-conjugating E2 enzymes (UBE2M) were positively enriched (Figure 5G-H, yellow; supplemental Tables 5-10 and 15-16). Several regulators of Cullin-RING–based E3 ubiquitination, including COP9 signalosome components (COPS1 [GPS1], COPS2, COPS3, COPS4, COPS5, COPS6, COPS7B, and COPS8) and the Cullin Ring E3 ligase assembly factor CAND1 were positively enriched in at least 1 cell line (Figure 5G-H, blue; supplemental Tables 5-10 and 15-16). We also observed enrichment of genes reported in previous studies using CRISPR/Cas9 screens to identify mechanisms of action/resistance of PROTACs and MGs, including modulators of RNA alternative splicing (ILF2 and ILF3),3 components of the proteasome complex (PSMA4, PSMA7, PSMA5, PSMA1, PSMA3, PSMB3, PSMB1, PSMB4 PSMC2, PSMC4, SHFM1, PSMF1, and PSMG3),19 the integrated stress response pathway (GCN1 [GCN1L1],3 GCN2 [EIF2AK4],3,20 PERK [EIF2AK3], eIF2α [EIF2S1]),3,21 and structural components of the ribosome (Figure 6A, red labels; supplemental Tables 5-10).
mTOR signaling pathway does not play a role in cytotoxicity induced by SJ6986. (A) Illustration depicting the CRBN-dependent ubiquitin proteasome pathway and its regulatory factors. Genes identified by the genomic CRSIPR/Cas9 screen in at least 1 cell line are labeled in red. Note that well-characterized genes essential for the CRBN E3 ligase complex activity, adaptors, regulators, and effectors are identified by the CRISPR screen. (B-C) Cytotoxicity of SJ6986 and CC-90009 in REH cells with TSC1 or TSC2 knockdown. (D-E) Cytotoxicity of SJ6986 and CC-90009 in U937 cells with TSC1 or TSC2 knockdown. (F-G) Western blot analysis of TSC1 and TSC2 in REH or U937 cells transduced by lentivirus. Signal was normalized to β-actin.
mTOR signaling pathway does not play a role in cytotoxicity induced by SJ6986. (A) Illustration depicting the CRBN-dependent ubiquitin proteasome pathway and its regulatory factors. Genes identified by the genomic CRSIPR/Cas9 screen in at least 1 cell line are labeled in red. Note that well-characterized genes essential for the CRBN E3 ligase complex activity, adaptors, regulators, and effectors are identified by the CRISPR screen. (B-C) Cytotoxicity of SJ6986 and CC-90009 in REH cells with TSC1 or TSC2 knockdown. (D-E) Cytotoxicity of SJ6986 and CC-90009 in U937 cells with TSC1 or TSC2 knockdown. (F-G) Western blot analysis of TSC1 and TSC2 in REH or U937 cells transduced by lentivirus. Signal was normalized to β-actin.
In contrast to comparable previous studies of CC-90009,3 we did not observe enrichment of genes encoding suppressors of mTOR signaling such as TSC1, TSC2, and ATF4 in the CRISPR/Cas9 screening data of either cell line, suggesting either differential mechanism of action or context dependency (AML vs ALL) of the studies. To examine this notion and determine whether the mTOR signaling pathway was not involved in cytotoxicity of SJ6986 in REH cells, we transduced REH and U937 (AML, MLLT10::PICALM) cells with lentivirus harboring both Cas9 and single-guide RNAs targeting TSC1 (TSC1-4 and TSC1-6) and TSC2 (TSC2-5 and TSC2-6), as well as with a nontargeting control (NT) or a noncoding control (NC-1).3 Consistent with CRISPR/Cas9 data, activation of mTOR signaling through knockdown of TSC1 or TSC2 had no effect on cytotoxicity of SJ6986 or CC-90009 in REH cells (Figure 6B-C). In contrast, activation of mTOR signaling conferred resistance to CC-90009 in U937 cells, as reported,3 but not SJ6986 (Figure 6D-E). Editing and knockdown of TSC1 and TSC2 were confirmed by immunoblotting (Figure 6F-G). Thus, the influence of modulating mTOR signaling on the cytotoxic effect of GSPT1 degraders is both compound and cell-line dependent.
We identified additional genes and pathways whose perturbation affected response to CRBN modulators; including proton motive force–driven ATP synthesis (eg, NDUFV1, NDUFS2, NDUFB4, NDUFS1, NDUFA1, ATP6V0C, NDUFA6, SDHB, NDUFC2, NDUFS5, NDUFA2, SDHA, SDHD, and NDUFA10) and the spliceosomal/small nuclear ribonucleoprotein (snRNP) complex (Figure 5F-H, purple and gray; supplemental Tables 11-14). Collectively, these CRISPR/Cas9 screening data in ALL cell lines treated with SJ6986 confirmed components of the CRL4CRBN complex, and associated adaptors, regulators, and effectors as being integral in mediating the action of SJ6986 (Figure 6A; supplemental Tables 5-14). In addition, these studies have nominated additional pathways including proton motive force-driven ATP synthesis and the spliceosomal/snRNP complex as exerting a role in the action of SJ6986.
Discussion
New therapeutics are needed for ALL, particularly for poor-prognosis subtypes and relapsed disease. We previously developed a specific GSPT1 degrader, SJ6986, with potent cytotoxic activity in pediatric cancer cells. Here, we tested the activity of SJ6986 in a panel of B-ALL, T-cell ALL, and lymphoma cell lines, as well as normal hCD34+ and peripheral blood mononuclear cells and observed activity in most ALL cells tested but to a lesser extent in lymphoma cells. We also found that SJ6986 inhibited cell growth in multiple NCI-60 panel cell lines (supplemental Figure 1). Because the KOPN-49 (IGH::CRLF2, JAK2-mutated) cell line harbors biallelic TP53 mutations, and the majority of NCI-60 cell lines harbor TP53 mutations,22 the cytotoxic activity of SJ6986 is TP53 independent, consistent with previous data for CC-885.10
GSPT1 is an essential gene related to cell cycle, cytoskeleton organization, and tumorigenesis and knock down of GSPT1 in human cells results in G1 arrest and decreased protein translation, possibly through the inhibition of mTOR activity.23 Knock down of GSPT1 in astrocytes results in cell cycle delay.24 In ALL cells, we observed induction of apoptosis and perturbed cell cycle progression consistent with impaired S to G2/M transition (Figure 1C-J). The observation that activation of the mTOR signaling pathway did not confer resistance to SJ6986 in REH and U937 cells suggests that the action of, and mechanisms of resistance to, GSPT1 degraders is cell-context dependent.
Although the 50% effective concentration of CC-90009 was lower than that of SJ6986 in cell lines and in PDX cells, SJ6986 was more effective in reducing tumor burden in vivo, which may reflect the longer half-life and higher plasma concentration of SJ6986. SJ6986 effectively reduced tumor burden in 4 of 6 PDXs with different subtypes of ALL, was moderately effective in 1 PDX of hypodiploid subtype, but not effective in 1 ZNF384r MPAL PDX despite GSPT1 degradation, suggesting that other signaling pathways might contribute to the resistance to SJ6986 in ALLs. Importantly, the equivalent concentration of SJ6986 in vivo did not significantly impair the differentiation of hCD34+ progenitor cells ex vivo.
Whole-genomic CRISPR/Cas9 screens provided several insights into the molecular mechanisms of SJ6986 mode of action in ALL. These screens identified (1) components of the CRL4CRBN complex (substrate-recognizing CRBN; ubiquitin-conjugating E2 enzymes UBE2D3, UBE2G1, UBE2L6, and UBE2T; and the adaptor proteins like DDB1 and RBX1); (2) protein neddylation mediators (NEDD8, NEDD-activating E1 enzymes NAE1 and UBA3, and ubiquitin-conjugating E2 enzymes such as UBE2M); (3) regulators of neddylation/COP9 signalosome; and (4) components of the proteasome. In addition to these essential functional components, we also identified ILF2 and ILF3 in ALL cell lines, which are shown to regulate CRBN expression in myeloid leukemia.3 Loss of ILF2/ILF3 decreases the production of full-length CRBN protein, resulting in the diminished response to CRBN-conjugating modulators, including SJ6986.
We found no evidence that SJ6986 results in activation of the mTOR pathway in either ALL or AML cell lines, with no enrichment for components of the TSC, GATOR1, or KICSTOR complexes. The mTORC1 signaling pathway was previously reported to modulate the activity of CRBN modulators CC-90009 and CC-885 in U937 and MM.1S cell lines, respectively.3,10 In contrast, these results nominated additional pathways that may mediate activity of SJ6986. GCN1 (GCN1L1),3,25 GCN2 (EIF2AK4),3,20 PERK (EIF2AK3),26,27 and eIF2α (EIF2S1)21,28 were significantly enriched after SJ6986 treatment. GCN1/GCN2/PERK mediate phosphorylation of eIF2α (EIF2S1) that activates the integrated stress response pathway and triggers the ATF4 transcriptional program to adapt to cellular stress.21,25-30 Therefore, SJ6986-mediated GSPT1 degradation may activate the GCN1/GCN2/PERK/eIF2a/ATF4 axis of the integrated stress response to induce apoptotic cell death in ALL.
An additional pathway potentially involved in the mechanism of action of SJ6986 was proton motive force–driven ATP synthesis. ATP synthesis occurs primarily in mitochondria; CRBN partially distributes in mitochondria, suggesting a mitochondrial function.31 Mitochondrially expressed CRBN in the human neuroblastoma cell line SH-SY5Y exhibited protease activity and was induced by oxidative stress.31 In addition, cells stably expressing CRBN exhibited suppressed hydrogen peroxide–induced cell death. Thus, mitochondrial CRBN reportedly functions as Lon-type protease.31 Notably, sustained PROTAC-mediated CRBN depletion induces irreversible mitochondrial dysfunction, resulting in cell death.32 In addition, the proteolytically processed isoform of GSPT1/eRF3 protein is shown to function as an inhibitor of apoptosis (IAP)-binding protein. IAP-binding proteins are released from the mitochondria of human cells during apoptosis and regulate apoptosis by liberating caspases from IAP inhibition. Processed GSPT1 interacts biochemically with IAPs and could promote caspase activation, IAP ubiquitination, and apoptosis.33 Taken together, SJ6986 might be inducing cell death by triggering oxidative stress and calcium overload in mitochondria, leading to disruption of mitochondrial membrane potential via CRBN, followed by GSPT1-induced caspase activation and apoptosis.
The CRISPR/Cas9 screens also identified enrichment of spliceosomal and SNRNP complex pathways. Short-hairpin RNA library screens examining mechanism of action of pomalidomide on multiple myeloma (OPM-2) cells have identified (a) messenger RNA splicing via spliceosome, (b) spliceosomal complex assembly, and (c) spliceosomal snRNP assembly,34 indicating that spliceosomal/snRNP complex might be playing an important role in the cytotoxic effect of pomalidomide in AML. Interestingly, spliceosome-related pathways were not reported in a study of the effect of CC-122 in the diffuse large B-cell lymphoma cell line SU-DHL-4,35 or CC-90009 in AML U937 cell line.3 In addition, GSPT1 and GSPT2 are shown to interact with PABPC1 and SRSF1, respectively36,37 (STRING38 and IntAct39 network databases). Furthermore, GSPT1 is shown to interact with ETF1 to form part of the translation termination complex. ETF1 has a transfer RNA–like structure and recognizes the termination codon in the A site of the translating ribosome.40-42 Taken together, spliceosomal complex and translation machinery might be playing an important role in the cytotoxic effect of SJ6986 via GSPT1/GSPT2.
Collectively, these studies show that SJ6986 results in potent and selective degradation of GSPT1 and GSPT2 in a diverse range of acute leukemia models, as evidenced by in vitro activity in cell lines, and ex vivo and in vivo potency in multiple PDX models of high-risk leukemia. The antileukemic activity was superior to that of CC-90009 in vivo, attributable to its favorable pharmacokinetic profile. CRISPR/Cas9 screening data in ALL cell lines treated with SJ6986 confirmed components of the CRL4CRBN complex and associated adaptors, regulators, and effectors as being integral in mediating the action of SJ6986. In addition, these studies have nominated additional pathways including proton motive force–driven ATP synthesis and the spliceosomal/SNRNP complex as exerting a role in the action of SJ6986. Clinical evaluation of this agent in the treatment of high-risk leukemia is warranted.
Acknowledgments
The authors thank R. DeVries, J. Moore, and W. Akers of the Center for In Vivo Imaging and Therapeutics for assistance with in vivo studies; the Pharmacotyping Core for assistance with ex vivo testing; and the Vector Core of St Jude Children’s Research Hospital for providing the CL20SF2–Luc2aYFP lentiviral vector; and B. Ebert for providing humanized Crbn mice.
This work was financially supported by a Translational Research Program award from the Leukemia and Lymphoma Society and Snowdome Foundation, a National Institutes of Health, National Cancer Institute Outstanding Investigator Award R35 CA197695, and a St. Baldrick’s Foundation Robert J. Arceci Innovation Award; the Henry Schueler 41&9 Foundation; an Alex’s Lemonade Stand Foundation Crazy 8 award (all to C.G.M.); St Jude Children's Research Hospital Cancer Center Support grant CA021765; and the American Lebanese Syrian Associated Charities of St. Jude Children’s Research Hospital.
Authorship
Contribution: Y.C., F.K., and P.S.G. performed in vitro and in vivo assays; F.K., G.N., L.Y., and D.C. synthesized and characterized MGs; J.J.Y. performed ex vivo assays; A.M., A.A.H., and J.P. performed proteomic analyses; P.S.G. and Q.G. analyzed CRISPR screening data; I.I., H.G., and K.A. provided materials; and Z.R. and C.G.M. designed and oversaw the study.
Conflict-of-interest disclosure: C.G.M. has received research funding from Loxo Oncology, Pfizer, and AbbVie; and honoraria from Pfizer, Illumina, and Amgen. Z.R. receives consulting fees from Revolution Medicines, Orum Therapeutics, Cyrus, and Nyrada Inc; and holds Eli Lilly stocks. C.G.M., G.N., M.F., F.K., and Y.C. have received royalty payments from Cyrus related to SJ6986. The remaining authors declare no competing financial interests.
Correspondence: Charles G. Mullighan, Department of Pathology, St. Jude Children’s Research Hospital, 262 Danny Thomas Place, Mail Stop 342, Memphis, TN 38105; e-mail: charles.mullighan@stjude.org; and Zoran Rankovic, Chemical Biology and Therapeutics, St. Jude Children’s Research Hospital, 262 Danny Thomas Place, Mail Stop 1000, Memphis, TN 38105; e-mail: zoran.rankovic@stjude.org.
References
Author notes
∗Y.C., F.K., and P.S.G. contributed equally to this study.
Data are available on request from the corresponding authors, Charles G. Mullighan (charles.mullighan@stjude.org) and Zoran Rankovic (zoran.rankovic@stjude.org).
The online version of this article contains a data supplement.
There is a Blood Commentary on this article in this issue.
The publication costs of this article were defrayed in part by page charge payment. Therefore, and solely to indicate this fact, this article is hereby marked “advertisement” in accordance with 18 USC section 1734.

This feature is available to Subscribers Only
Sign In or Create an Account Close Modal