Key Points
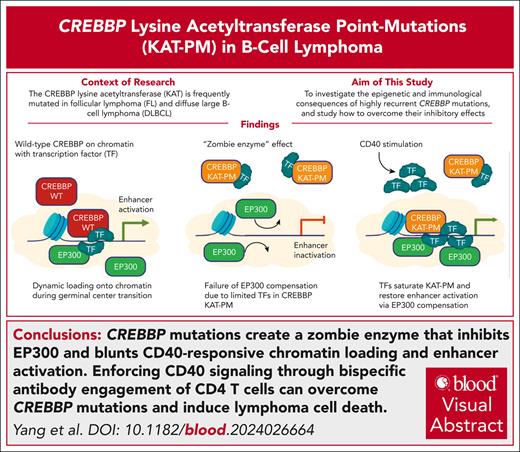
CREBBP mutations create a zombie enzyme that inhibits EP300 and blunts CD40-responsive chromatin loading and enhancer activation.
Enforcing CD40 signaling through bispecific antibody engagement of CD4 T cells can overcome CREBBP mutations and induce lymphoma cell death.
Visual Abstract
The CREBBP lysine acetyltransferase (KAT) is frequently mutated in follicular lymphoma and diffuse large B-cell lymphoma and has been studied using gene knockout in murine and human cells. However, most CREBBP mutations encode amino acid substitutions within the catalytic KAT domain (CREBBP KAT-PM) that retain an inactive protein and have not been extensively characterized. Using CRISPR gene editing and extensive epigenomic characterization of lymphoma cell lines, we found that CREBBP KAT-PM lead to unloading of CREBBP from chromatin, loss of enhancer acetylation, and prevention of EP300 compensation. These enhancers were enriched for those that are dynamically loaded by CREBBP in the normal centroblast-to-centrocyte transition in the germinal center, including enhancers activated in response to CD40 signaling, leading to blunted molecular response to CD40 ligand in lymphoma cells. We provide evidence that CREBBP KAT-PM inhibits EP300 function by binding limiting quantities nuclear transcription factor (TF), thereby preventing its compensatory activity. This effect can be experimentally overcome by expressing saturating quantities of TF or biologically attenuated by strong stimulation of CD40 signaling that increases nuclear TF abundance. Importantly, epigenetic responses to CD40 signaling can be induced by enforcing CD4 T-cell engagement using a bispecific antibody, leading to CD40-dependent restoration of antigen presentation machinery in CREBBP KAT-PM cells and cell death. Therefore, we provide a mechanistic basis for enhancer deregulation by CREBBP KAT-PM and highlight enforced CD4 T-cell engagement as a potential approach for overcoming these effects.
Introduction
Deregulation of the dynamic epigenetic programs required for germinal center (GC) B-cell state transitions by chromatin-modifying gene mutations is a hallmark of follicular lymphoma (FL) and diffuse large B-cell lymphoma (DLBCL).1 The CREBBP (aka, Cbp) gene is the second most frequently mutated chromatin-modifying gene in FL and GCB-DLBCL and, together with its paralog EP300 (aka, p300), encodes a lysine acetyltransferase (KAT) that is recruited by transcription factors (TFs) to coactivate transcription via acetylation of histone 3 lysine 27 (H3K27) and other residues. Mutations of CREBBP are most commonly missense mutations within the catalytic KAT domain and reduce catalytic activity.2,3 CREBBP and EP300 are thought to be largely redundant in many contexts, but murine knockout (KO) of Crebbp and Ep300 has suggested that they have some nonredundant functions in GC B cells.4 The most frequent mutation of CREBBP (R1446C) has a more pronounced phenotype than CREBBP KO,5 indicating that there are effects that extend beyond the loss of function that has been modeled using KO. However, the mechanism for these effects and the precise roles for CREBBP and EP300 in normal and malignant GC B cells remain to be defined. Here we investigate the epigenetic and immunological consequences of highly recurrent CREBBP mutations, describe mechanisms by which mutant CREBBP proteins inhibit functional compensation by EP300, and show that enforced CD4 T-cell engagement with bispecific antibody can partially overcome the inhibitory effect of mutant CREBBP.
Methods
Detailed methods can be found in the supplemental Methods, available on the Blood website.
Cell culture, CRISPR editing, and CUT&RUN
Both parental cell lines and CRISPR-modified RL and HT cell lines were cultured in RPMI medium with 10% fetal bovine serum and 1× penicillin/streptomycin. CREBBP KAT domain mutations were introduced by CRISPR-Cas9 with SpCas9 HiFi nuclease, guide RNA, and a single-stranded oligonucleotide donor template. All cells were maintained as subconfluent culture and mycoplasma tested before each set of assays. CUT&RUN was performed for H3K27Ac, H3K4me1, H3K4me3, H3K27me3, CREBBP, EP300, and BRD4 as previously described,6-8 with some modifications (see details in the supplemental Materials). CUT&RUN data were normalized by reads per kilobase mapped (RPKM), peaks were called by MACS2 using immunoglobulin G controls comparison, and differential analysis was performed using DiffBind.9
CD40 stimulation
CD40 stimulation medium were prepared by preincubation of 40 μL of CD40 ligand and 40 μL of cross-linking antibody mixture and subsequently mixing with 10 mL of medium with 2 μL of interleukin-4 (IL-4). Cells were seeded at 0.5 × 10⁶/mL of CD40 stimulation medium at 37°C. For CUT&RUN and immunoblotting, cells were collected after 24 hours of stimulation. Flow cytometry was performed at 1, 3, and 7 days after treatment.
CD4+ T-cell and tumor B-cell coculture
Lymphoma cell lines were stained with CellTrace Far Red and CD4+ T cells were stained with CellTrace Violet according to the manufacturer’s instructions. After mixing at defined ratios, cells were cultured in the presence of 100 ng/mL mosunetuzumab for 12 or 24 hours, before sorting. Coculture right after mixing without mosunetuzumab treatment was set as the 0-hour treatment group. Sorted live tumor cells were used for downstream molecular profiling including RNA sequencing (RNA-seq), ATAC sequencing, and CUT&RUN for H3K27Ac, CREBBP, and EP300.
Statistical analysis
Comparisons of data with normal distribution were made using either Student t test (2 groups) or 1-way analysis of variance (3+ groups). Nonnormal distribution data were compared using Wilcoxon rank-sum test. Categorical variables were compared using χ2 test. When multiple hypothesis testing correction was applied, false discovery rate (FDR) <0.05 or adjusted P < .05 was considered statistically significant.
Analysis of primary FL samples was performed under institutional review board protocol PA19-0420. Development and analysis of patient-derived xenograft models were performed under institutional review board protocol PA18-0099 and Institutional Animal Care and Use Committee protocol 00001818-RN02.
Results
Suppressive effects of CREBBP KAT domain point mutations
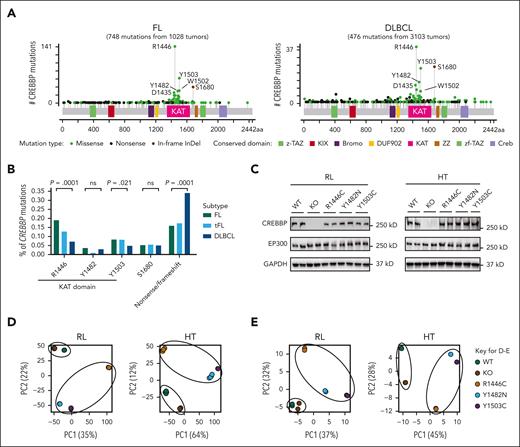
We curated mutation data from FL, transformed FL, and DLBCL tumors to characterize the spectrum of CREBBP mutations, which were identified in 60.4% of FL (621/1028), 48.4% of transformed FL (91/188), and 13.8% of DLBCL (427/3104).6-16 Most mutations were missense changes within the catalytic KAT domain (782/1380; Figure 1A), including hot spots at R1446 (187/1380), Y1503 (94/1380), Y1482 (43/1380), and W1502 (41/1380). Most nonsense/frameshift mutations occurred upstream from or within the KAT domain (280/301). FL tumors significantly more frequently harbored KAT domain point mutations (KAT-PMs) and DLBCL significantly more frequently harbored nonsense/frameshift mutations (Figure 1B), hinting at important functional differences. Therefore, we performed CRISPR editing of the endogenous CREBBP coding sequences of 2 B-cell lymphoma cell lines, RL and HT, introducing the 3 most common KAT-PMs (R1446C, Y1482N, and Y1503C) and obtaining isogenic wild-type (WT) and homozygous KO clones (supplemental Figure 1). We performed detailed molecular profiling of all isogenic cell lines by CUT&RUN,17 ATAC sequencing, and RNA-seq to characterize superenhancers, enhancers, promoters, and weak enhancers (supplemental Figure 2). RL and HT have monoallelic frameshift mutations of EP300, allowing for less confounded assessment of the effects of CREBBP mutations. All selected clones with KAT-PMs were homozygous, which is observed for ∼40% of CREBBP mutations in primary FL tumors,6 and mutations did not change the expression of CREBBP or EP300 at the protein level (Figure 1C). Throughout the results text, analyses using only a single mutant are referred to by genotype (WT, KO, R1446C, Y1482N, Y1503C), and analyses that average all KAT domain mutants (R1446C, Y1482N, Y1503C) collectively are referred to as KAT-PM. Principal component analysis of H3K27Ac CUT&RUN (Figure 1D) and RNA-seq (Figure 1E) from these isogenic cell lines revealed that KAT-PMs had a divergent epigenome and transcriptome compared with isogenic WT controls, and KOs were more similar to WT than to KAT-PMs. R1446C mutant cells differed from Y1482N and Y1503C cells in their distribution in principal component analysis, leading us to perform a supervised analysis of their differences and similarities (supplemental Figure 3). Y1482N/Y1503C mutants led to significant loss of H3K27Ac over a larger number of regions compared with R1446C mutants, with a stronger preference toward superenhancers and weak enhancers (supplemental Figure 3C). However, analysis of the genes associated with these regions showed only a modest enrichment of cytokine signaling and NF-κB gene sets within R1446C-specific and Y1482N/Y1503C-specific H3K27Ac loss regions, respectively. In contrast, common regions of H3K27Ac loss across R1446C and Y1482N/Y1503C mutants were highly significantly enriched for multiple gene sets with important functional implications for GC B cells and B-cell lymphoma (supplemental Figure 3D; supplemental Table 1). Therefore, we focused the remainder of our analyses on the collective differences among all CREBBP KAT-PMs (R1446C, Y1482N, and Y1503C) and their isogenic WT controls.
Differential spectrum and effect of CREBBP mutations in human lymphoma. (A) Lollipop plots of the mutation spectrum of CREBBP from 1028 FL (left) and 3103 DLBCL (right) tumors. (B) The frequency of CREBBP hot spot mutations and nonsense/frameshift (truncating) mutations in FL (n = 1028), transformed FL (tFL) (n = 188), and DLBCL (n = 3103). (C) Western blot analysis of CREBBP and EP300 protein expression in CRISPR edited RL (left) and HT (right) lymphoma cell lines. (D-E) Unsupervised principal component analysis (PCA) of RNA-seq (D) and H3K27Ac CUT&RUN (E) data from CRISPR edited RL and HT lymphoma cell lines.
Differential spectrum and effect of CREBBP mutations in human lymphoma. (A) Lollipop plots of the mutation spectrum of CREBBP from 1028 FL (left) and 3103 DLBCL (right) tumors. (B) The frequency of CREBBP hot spot mutations and nonsense/frameshift (truncating) mutations in FL (n = 1028), transformed FL (tFL) (n = 188), and DLBCL (n = 3103). (C) Western blot analysis of CREBBP and EP300 protein expression in CRISPR edited RL (left) and HT (right) lymphoma cell lines. (D-E) Unsupervised principal component analysis (PCA) of RNA-seq (D) and H3K27Ac CUT&RUN (E) data from CRISPR edited RL and HT lymphoma cell lines.
Loss of enhancer activity in CREBBP KAT domain point mutants
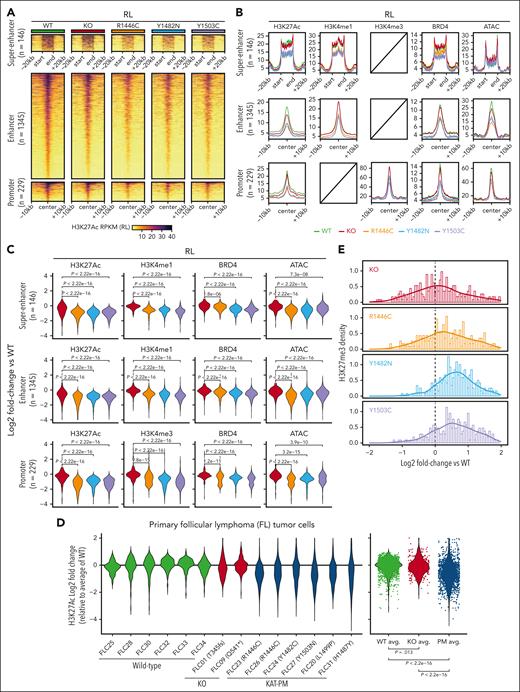
We hypothesized that EP300 can compensate for CREBBP KO but not KAT-PM. To investigate this, we focused on H3K27Ac consensus peaks bound by both CREBBP and EP300 (ie, redundancy). Differential analysis comparing all KAT-PMs (CREBBPKAT-PM) with isogenic CREBBPWT controls identified 1720 and 2942 regions of significant H3K27Ac loss in RL and HT, respectively (FDR, <0.05; fold change, >1.5; Figure 2A-C; supplemental Figure 4; supplemental Table 2). We validated these in sorted tumor B cells from viably cryopreserved FL tumor cell suspensions, profiled by H3K27Ac multiplexed indexed T7 chromatin immunoprecipitation sequencing18 (supplemental Table 3). Consensus regions of H3K27Ac loss in RL and HT CREBBPKAT-PM showed significantly reduced H3K27Ac in CREBBPKAT-PM (n = 6) compared with CREBBPWT tumors (n = 6; Wilcoxon rank-sum P < 2.2 × 10⁻¹⁶; Figure 2D), confirming our CRISPR engineered cell lines as a biologically meaningful system. H3K27Ac loss was accompanied by loss of superenhancer and enhancer H3K4me1 and BRD4 and promoter H3K4me3 and BRD4 (Figure 2B-C; supplemental Figure 4), indicative of inactivation. ATAC loss and H3K27me3 gain, indicative of decommissioning, was more variable among cell lines (Figure 2B-C,E; supplemental Figure 3). Notably, CREBBPKO showed no or low-magnitude loss of H3K27Ac, H3K4me1, H3K4me3, or BRD4 over these regions compared with isogenic CREBBPWT controls, suggesting that EP300 can compensate in the setting of CREBBP KO. This was also observed for H3K27Ac in 2 available primary FL tumors (Figure 2D). However, results may vary in different experimental systems. Therefore, CREBBP KAT-PMs cause greater loss of enhancer activity than CREBBP KO, showing that the mutant protein has an effect that exceeds loss of function.
Loss of enhancer and promoter activity in CREBBP KAT-PM cells. (A) Heat maps of regions with significant H3K27Ac loss in RL cells with CREBBP KAT-PM (R1446C, Y1482N, Y1503C) compared with WT (FDR <0.05), also showing H3K27Ac abundance in CREBBP KO cells. (B-C) Density plots (B) and violin plots (C) of relative change compared with WT for histone posttranslational modifications and chromatin accessibility in RL cells with CREBBP KO different KAT-PMs (R1446C, Y1482N, Y1503C), showing regions from panel A. (D) Relative abundance of H3K27Ac in primary FL tumor cells, normalized to the average of CREBBP WT tumors, showing regions of consensus H3K27Ac loss in CRISPR edited CREBBP KAT-PM RL and HT cells compared with isogenic WT controls. (E) Density plot of relative H3K27me3 in RL CREBBP KAT-PM (R1446C, Y1482N, Y1503C) or KO CRISPR edited cells compared with isogenic WT controls, showing regions from panel A.
Loss of enhancer and promoter activity in CREBBP KAT-PM cells. (A) Heat maps of regions with significant H3K27Ac loss in RL cells with CREBBP KAT-PM (R1446C, Y1482N, Y1503C) compared with WT (FDR <0.05), also showing H3K27Ac abundance in CREBBP KO cells. (B-C) Density plots (B) and violin plots (C) of relative change compared with WT for histone posttranslational modifications and chromatin accessibility in RL cells with CREBBP KO different KAT-PMs (R1446C, Y1482N, Y1503C), showing regions from panel A. (D) Relative abundance of H3K27Ac in primary FL tumor cells, normalized to the average of CREBBP WT tumors, showing regions of consensus H3K27Ac loss in CRISPR edited CREBBP KAT-PM RL and HT cells compared with isogenic WT controls. (E) Density plot of relative H3K27me3 in RL CREBBP KAT-PM (R1446C, Y1482N, Y1503C) or KO CRISPR edited cells compared with isogenic WT controls, showing regions from panel A.
KAT-PMs reduce CREBBP chromatin loading and EP300 compensation
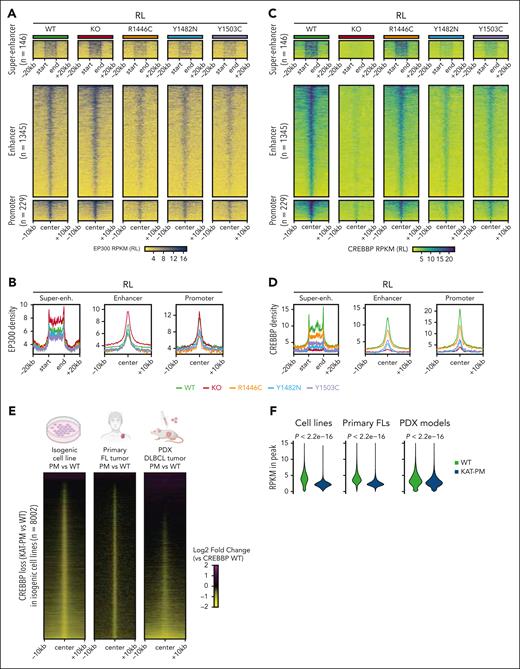
We next assessed whether the effect of CREBBPKAT-PM may manifest through inhibition of EP300 compensation by directly measuring EP300 loading. CREBBPKO cells showed significantly increased EP300 loading over CREBBPKAT-PM H3K27Ac loss regions (Wilcoxon rank-sum P < 2.2 × 10⁻¹⁶ in both RL and HT) but loading was decreased in CREBBPKAT-PM cells (Figure 3A-B; supplemental Figure 3; Wilcoxon rank-sum P < 2.2 × 10⁻¹⁶). Evaluation of CREBBP by CUT&RUN showed a significant reduction in loading over regions of H3K27Ac loss in CREBBPKAT-PM cells (Figure 3C-D; supplemental Figure 4; Wilcoxon rank-sum P < 2.2 × 10⁻¹⁶ in both RL and HT), indicating that reduced EP300 loading was not caused by chromatin occupancy by CREBBP. We confirmed that this observation was not related to monoallelic inactivation of EP300 in our cell lines by repairing EP300 mutation in the HT cell line and repeating our analysis (supplemental Figure 5). We further validated loss of CREBBP loading in CREBBP KAT-PM mutant lymphomas using primary FLs with available cells for CUT&RUN (3 WTs and 3 KAT-PMs) and DLBCL PDX models (3 WTs, 3 KAT-PMs; supplemental Table 3). Evaluating all consensus CREBBP peaks from RL and HT cell lines, KAT-PM cells showed a reproducible loss of CREBBP on chromatin in both primary FLs and DLBCL PDX models (Figure 3E-F; Wilcoxon rank-sum P < 2.2 × 10⁻¹⁶). Together these data show that CREBBP KAT-PM reduces CREBBP chromatin loading and inhibits EP300 compensation at these loci.
Loss of CREBBP loading and EP300 compensation over regions of reduced H3K27Ac in CREBBP KAT-PM cells. (A-B) Heat maps (A) and density plots (B) of EP300 CUT&RUN in isogenic RL cells with CREBBP WT, KO, and different KAT-PMs (R1446C, Y1482N, Y1503C), showing regions from Figure 2A. (C-D) Heat maps (C) and density plots (D) of CREBBP CUT&RUN in isogenic RL cells with CREBBP WT, KO, and different KAT-PMs (R1446C, Y1482N, Y1503C), showing regions from Figure 2A. (E) Heat maps of the relative density of CREBBP loading in KAT-PM compared with WT CRISPR edited RL cells (left), primary FL tumors (middle), and DLBCL PDX models (right), showing all consensus CREBBP peaks in RL and HT cells. (F) Violin plots showing the RPKM of CREBBP CUT&RUN for WT and KAT-PM isogenic cell lines (left), primary FL biopsies (middle), and PDX models (right). P values were calculated with a Wilcoxon rank-sum test. Super-enh, super-enhancer.
Loss of CREBBP loading and EP300 compensation over regions of reduced H3K27Ac in CREBBP KAT-PM cells. (A-B) Heat maps (A) and density plots (B) of EP300 CUT&RUN in isogenic RL cells with CREBBP WT, KO, and different KAT-PMs (R1446C, Y1482N, Y1503C), showing regions from Figure 2A. (C-D) Heat maps (C) and density plots (D) of CREBBP CUT&RUN in isogenic RL cells with CREBBP WT, KO, and different KAT-PMs (R1446C, Y1482N, Y1503C), showing regions from Figure 2A. (E) Heat maps of the relative density of CREBBP loading in KAT-PM compared with WT CRISPR edited RL cells (left), primary FL tumors (middle), and DLBCL PDX models (right), showing all consensus CREBBP peaks in RL and HT cells. (F) Violin plots showing the RPKM of CREBBP CUT&RUN for WT and KAT-PM isogenic cell lines (left), primary FL biopsies (middle), and PDX models (right). P values were calculated with a Wilcoxon rank-sum test. Super-enh, super-enhancer.
CREBBP mutations alter normal dynamics of CREBBP loading in the GC reaction
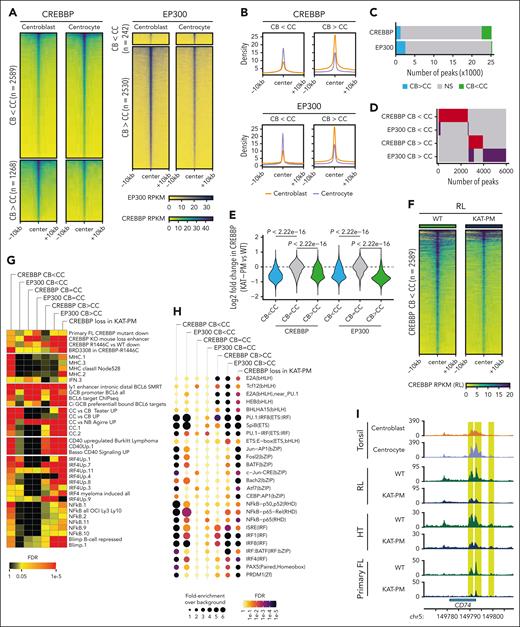
We reasoned that CREBBP mutations may deregulate a normal dynamic process of CREBBP loading that occurs within the GC. Therefore, we sorted centroblasts (CBs) and centrocytes (CCs) from 3 human tonsils (supplemental Figure 6A) and performed CUT&RUN for CREBBP and EP300. CREBBP CUT&RUN was validated against previous chromatin immunoprecipitation sequencing from bulk tonsillar GCs (supplemental Figure 6B-D). Thousands of loci were identified with significant (FDR, <0.05; fold change, >1.5) changes in CREBBP and EP300 loading between CBs and CCs (Figure 4A-C), including a predominant pattern of CREBBP loading (CB < CC; 2589/3857 significant regions) and EP300 unloading (CB > CC; 2530/2772 significant regions) in CCs compared with CBs (Figure 4A-C; supplemental Table 3). However, these regions represented a minority of all CREBBP and EP300 peaks (Figure 4C). Regions of dynamic loading between CBs and CCs were largely nonoverlapping (Figure 4D), consistent with a subset of EP300 and CREBBP roles being nonredundant in CBs and CCs.4 Notably, CREBBP loading was detectable in WT lymphoma cells over both CREBBP and EP300 binding sites in CBs and CCs and over both dynamic and stable regions (supplemental Figure 7A). However, comparison of WT and KAT-PM lymphoma cells showed a significant reduction of CREBBP occupancy only over regions with dynamic loading of CREBBP or EP300 in the CB-to-CC transition (Figure 4E), including regions normally loaded with CREBBP in the CB-to-CC transition (Figure 4F; supplemental Figure 7B; Wilcoxon rank-sum P < 2.2 × 10⁻¹⁶ in RL; P = 2.698 × 10⁻¹⁵ in HT), but not over regions with stable binding of CREBBP or EP300 in the CB-to-CC transition (Figure 4E). To determine the biological implications of reduced CREBBP loading in CREBBPKAT-PM, we used hypergeometric gene set enrichment analysis and motif enrichment analysis. Enriched gene sets were most similar between regions with dynamic CREBBP loading between CBs and CCs and regions with a loss of CREBBP loading in CREBBPKAT-PM (Figure 4G-H; supplemental Tables 5 and 6). In particular, we noted significant enrichment for genes with reduced expression in primary FL with CREBBP mutations,6 major histocompatibility complex (MHC) gene sets, BCL6-repressed genes, CC signature genes, and CD40-responsive genes including interferon regulatory factor (IRF)4 and NF-κB targets (Figure 4G). Motif enrichment analysis also implicated CD40 signaling, showing selective enrichment of motifs for CD40-responsive AP-1, NF-κB, and IRF TF families (Figure 4H; supplemental Table 6), including genes involved in antigen presentation and memory B-cell differentiation (Figures 4I; supplemental Figure 7C). Therefore, CREBBP is dynamically loaded in the CB-to-CC transition in nonmalignant GCs, and CREBBP KAT-PM lymphoma cells have impaired CREBBP loading over these and other regions.
Dynamic loading of CREBBP and EP300 during the CB-to-CC cell state transition. (A-B) Heat maps (A) and density plots (B) of regions with significantly (FDR <0.05) different loading of CREBBP (left) and EP300 (right) between CBs and CCs. (C) Number of peaks with dynamic loading (green) or unloading (blue) of CREBBP or EP300 in the CB-to-CC transition. (D) Overlap of regions with differential loading of CREBBP or EP300 in CBs and CCs. (E) Quantification of the change in CREBBP loading between KAT-PM (R1446C, Y1482N, Y1503C) and WT cells over regions with dynamic loading of CREBBP or EP300 in the CB-to-CC transition (regions from panel C). (F) Heat map of CREBBP loading in isogenic WT and CREBBP KAT-PM (average of R1446C, Y1482N, Y1503C) cells over regions with significantly increased CREBBP loading in CC compared with CB. ∗∗∗P < 2.2 × 10⁻¹⁶. (G) Hypergeometric gene set enrichment analysis (hGSEA) of genes associated with peaks with or without differential loading of CREBBP or EP300 in the CB-to-CC transition (corresponding to panel C) or with significant loss of CREBBP loading in KAT-PM cells compared with isogenic WT controls. (H) TF motif enrichment analysis (HOMER) of peaks with or without differential loading of CREBBP or EP300 in the CB-to-CC transition (corresponding to panel C). (I) Tracks showing the CD74 locus as a representative example of regions with significant (FDR < 0.05; highlighted in yellow) gain in CREBBP loading in the CB-to-CC transition and loss of CREBBP loading in KAT-PM cells compared with isogenic WT controls in both CRISPR engineered cell lines (RL and HT) and primary FL tumor cells. Tracks represent overlays of biological replicates.
Dynamic loading of CREBBP and EP300 during the CB-to-CC cell state transition. (A-B) Heat maps (A) and density plots (B) of regions with significantly (FDR <0.05) different loading of CREBBP (left) and EP300 (right) between CBs and CCs. (C) Number of peaks with dynamic loading (green) or unloading (blue) of CREBBP or EP300 in the CB-to-CC transition. (D) Overlap of regions with differential loading of CREBBP or EP300 in CBs and CCs. (E) Quantification of the change in CREBBP loading between KAT-PM (R1446C, Y1482N, Y1503C) and WT cells over regions with dynamic loading of CREBBP or EP300 in the CB-to-CC transition (regions from panel C). (F) Heat map of CREBBP loading in isogenic WT and CREBBP KAT-PM (average of R1446C, Y1482N, Y1503C) cells over regions with significantly increased CREBBP loading in CC compared with CB. ∗∗∗P < 2.2 × 10⁻¹⁶. (G) Hypergeometric gene set enrichment analysis (hGSEA) of genes associated with peaks with or without differential loading of CREBBP or EP300 in the CB-to-CC transition (corresponding to panel C) or with significant loss of CREBBP loading in KAT-PM cells compared with isogenic WT controls. (H) TF motif enrichment analysis (HOMER) of peaks with or without differential loading of CREBBP or EP300 in the CB-to-CC transition (corresponding to panel C). (I) Tracks showing the CD74 locus as a representative example of regions with significant (FDR < 0.05; highlighted in yellow) gain in CREBBP loading in the CB-to-CC transition and loss of CREBBP loading in KAT-PM cells compared with isogenic WT controls in both CRISPR engineered cell lines (RL and HT) and primary FL tumor cells. Tracks represent overlays of biological replicates.
CREBBP KAT-PM blunts CD40 signaling response
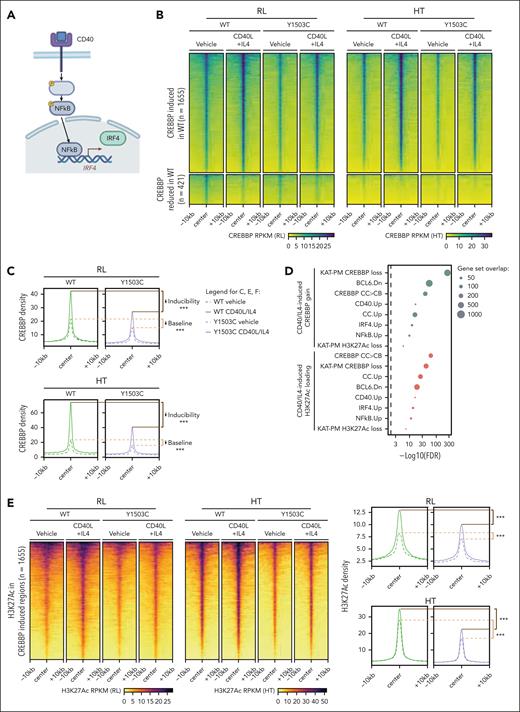
CD40 signaling drives strong NF-κB activation and nuclear translocation, leading to IRF4 expression and nuclear accumulation (Figure 5A). Both NF-κB and IRF TFs have been shown to interact with CREBBP/EP300.19-21 We aimed to validate this axis by stimulating cells with CD40 and IL-4 to mimic positive selection signals from T-follicular helper cells to CCs, focusing on the CREBBPY1503C mutant that has been shown to be catalytically dead.22 Treatment with 2 ng/mL CD40L and 6.25 ng/mL IL-4 led to expected reductions in BCL6 expression and a modest increase in the expression of the plasma cell marker CD138 (supplemental Figure 8A-B) after 24 hours, and prolonged treatment caused induction of cell death at day 7 (supplemental Figure 8C). Therefore, we focused on the 24-hour time point for molecular analysis. In both RL and HT cell lines, 24-hour treatment with CD40L + IL-4 led to a predominant increase in CREBBP loading (Figure 5B-C; 1681/2102 significant regions; FDR, <0.05; fold change, >1.5; supplemental Table 7) at genes significantly enriched for (1) those loaded by CREBBP in the CB-to-CC transition, (2) those with CREBBP unloading in CREBBPKAT-PM cells, (3) signatures previously shown to be CD40 responsive and BCL6 repressed, and (4) those regulated by IRF4 and/or NF-κB (Figure 5D; supplemental Figure 8D-G). Similar patterns were also observed for CD40L + IL-4–induced H3K27Ac (Figure 5E), providing evidence that dynamic chromatin loading and activity of CREBBP in CCs are responsive to CD40 signaling. Because genomic assays average signal across cells, we measured this induction at the single cell protein level 12 and 24 hours after stimulation by flow cytometry for human leukocyte antigen (HLA)-DR and CD74, which are lost in association with CREBBP mutation,6 and the costimulatory molecules CD80 and CD58, which are induced by CD40 signaling (supplemental Figure 8H). CREBBPKAT-PM cells showed a slower kinetic of induction and reduced expression at 24 hours than WT cells, with some heterogeneity in induction kinetics being observed across cells (supplemental Figure 8H).
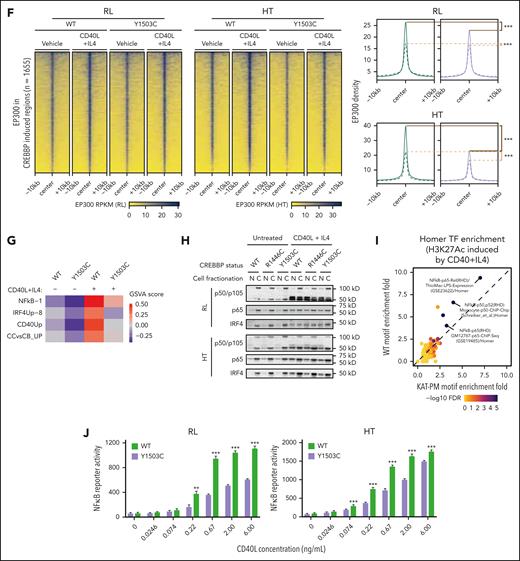
Blunted CD40 response in CREBBP KAT domain point mutants. (A) Schematic of CD40 signaling in B cells. (B-C) Heat maps (B) and density plots (C) of significant changes in CREBBP loading (FDR < 0.05) after CD40L + IL-4 treatment in isogenic CREBBP WT cells, showing analogous changes in CREBBP Y1503C mutant cells. ∗∗∗Wilcoxon rank-sum P < 2.2 × 10⁻¹⁶. (D) Bubble plots of gene set enrichment analysis for regions with increased H3K27Ac (above) or CREBBP loading (below) after CD40L + IL-4 stimulation. (E-F) Heat maps and density plots of H3K27Ac gain (E) and EP300 loading (F) over regions with significantly increased CREBBP loading in CREBBP WT cells after CD40L + IL-4 treatment (regions from panel B). ∗∗∗Wilcoxon rank-sum P < 2.2 × 10⁻¹⁶. (G) RNA-seq gene set variation analysis (GSVA) scores for CD40-responsive gene sets in isogenic CREBBP WT and Y1503C RL cells with or without CD40L + IL-4 stimulation. (H) Western blot of nuclear and cytoplasmic fractions for NF-κB (p50/p105; p65) and IRF4 TFs after CD40L + IL-4 treatment. (I) Fold enrichment of TF motifs within regions of H3K27Ac gain, comparing CREBBP WT (y-axis) and Y1503C (x-axis) cells. (J) NF-κB reporter assay in CREBBP WT (green) and Y1503C (purple) cells with a dose titration of CD40L. Adjusted Student t test ∗∗P < .01; ∗∗∗P < .001.
Blunted CD40 response in CREBBP KAT domain point mutants. (A) Schematic of CD40 signaling in B cells. (B-C) Heat maps (B) and density plots (C) of significant changes in CREBBP loading (FDR < 0.05) after CD40L + IL-4 treatment in isogenic CREBBP WT cells, showing analogous changes in CREBBP Y1503C mutant cells. ∗∗∗Wilcoxon rank-sum P < 2.2 × 10⁻¹⁶. (D) Bubble plots of gene set enrichment analysis for regions with increased H3K27Ac (above) or CREBBP loading (below) after CD40L + IL-4 stimulation. (E-F) Heat maps and density plots of H3K27Ac gain (E) and EP300 loading (F) over regions with significantly increased CREBBP loading in CREBBP WT cells after CD40L + IL-4 treatment (regions from panel B). ∗∗∗Wilcoxon rank-sum P < 2.2 × 10⁻¹⁶. (G) RNA-seq gene set variation analysis (GSVA) scores for CD40-responsive gene sets in isogenic CREBBP WT and Y1503C RL cells with or without CD40L + IL-4 stimulation. (H) Western blot of nuclear and cytoplasmic fractions for NF-κB (p50/p105; p65) and IRF4 TFs after CD40L + IL-4 treatment. (I) Fold enrichment of TF motifs within regions of H3K27Ac gain, comparing CREBBP WT (y-axis) and Y1503C (x-axis) cells. (J) NF-κB reporter assay in CREBBP WT (green) and Y1503C (purple) cells with a dose titration of CD40L. Adjusted Student t test ∗∗P < .01; ∗∗∗P < .001.
CD40-responsive genes showed lower levels of expression in CREBBPKAT-PM cells than WT, but not in CREBBPKO, suggesting a reduction in tonic CD40 signaling response at baseline in CREBBPKAT-PM cells (supplemental Figure 9A). Therefore, we evaluated epigenetic responses to active CD40 signaling by treating cells with CD40L + IL-4. In line with the gene expression results, regions with increased CREBBP loading in CREBBPWT cells after CD40L + IL-4 treatment had markedly lower baseline levels in CREBBPY1503C cells and failed to induce equivalent loading after treatment compared with CREBBPWT cells (Figure 5B-C; both Wilcoxon rank-sum P < 2.2 × 10⁻¹⁶; supplemental Figure 9B-D). However, there remained to be a measurable increase in H3K27Ac (Figure 5E; supplemental Figure 9B) despite the lack of catalytic activity of CREBBP Y1503C, leading us to evaluate EP300 loading over these regions. We observed a proportionate gain in EP300 loading at these loci in CREBBPY1503C cells (Figure 5F; supplemental Figure 9D) showing that stimulation can partially overcome the deficit in EP300 compensation within CREBBP KAT-PM cells, resulting in a blunted induction of CD40-responsive gene sets at the RNA level as measured by gene set variation analysis (Figure 5G). CD40L + IL-4 treatment drives increased nuclear abundance of NF-κB and IRF4 TFs (TFs; Figure 5H), suggesting that increased TF abundance may underly rescue of EP300 compensation. We observed a strong induction of NF-κB TF activity in CREBBPWT cells treated with CD40L + IL-4 for 24 hours, which was blunted but remained highly significant within CREBBPY1503C cells (Figure 5I). We validated this observation using an NF-κB reporter construct,23 showing reduced NF-κB TF activity downstream of CD40 in CREBBPY1503C cells compared with CREBBPWT cells (Figure 5J), but no reduction in CREBBPKO cells (supplemental Figure 9E). In line with this, quantitative polymerase chain reaction analysis of CD40-inducible genes (CXCR5, CCR7, TRAF1) showed a similar blunting of induction across different KAT-PMs compared with CREBBPWT, but were more robustly induced in CREBBPKO cells (supplemental Figure 9F). Therefore, CREBBP KAT-PM blunts responsiveness to CD40 signaling, but strong signaling induces EP300 compensation and activity of downstream TFs.
CREBBP KAT-PM acts as a “zombie enzyme” to inhibit EP300 compensation
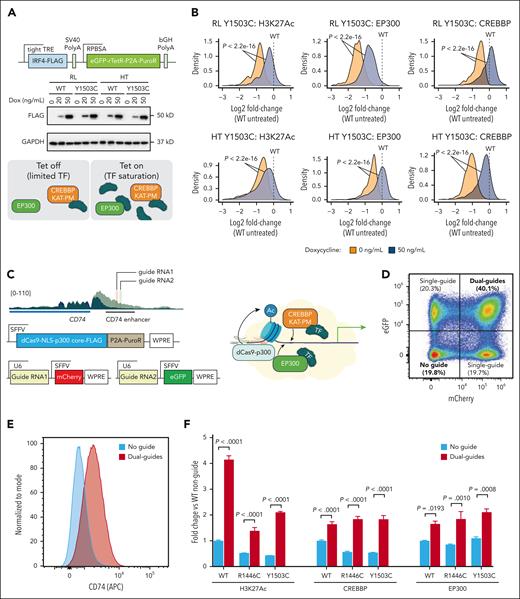
We hypothesized that the reduced loading of CREBBP KAT-PM at CD40-responsive regions and the concomitant failure of EP300 to act redundantly at these loci may be the result of CREBBP acting as a “zombie enzyme.”24,25 One of the mechanisms of action for inactive zombie enzymes is to prevent the activity of their active paralog by binding shared substrates while failing to catalyze the reaction. In particular, we predicted that CREBBP KAT-PM may inhibit EP300 by binding to limited quantities of TF and prevent them from associating with EP300 to drive compensation.24,25 It is not technically feasible to evaluate TF and CREBBP/EP300 interactions using direct immunoprecipitation of endogenous proteins; therefore, we are unable to demonstrate altered interactions of endogenous CREBBP or EP300 with endogenous TFs. To experimentally validate our hypothesis, we therefore overexpressed TF to levels that should saturate CREBBP binding and allow for excess TF to bind EP300 and drive compensation. We focused our validation efforts on IRF4, which is induced by CD40 signaling and serves an important role in terminal differentiation of GC B cells26 and interacts with both CREBBP WT and Y1503C (supplemental Figure 10A).27 Specifically, we engineered CREBBPY1503C RL cells with tetracycline-inducible overexpression of IRF4 to achieve similar levels to that observed with CD40 stimulation (Figure 6A; supplemental Figure 10B) and evaluated H3K27Ac, CREBBP, and EP300 at peaks that satisfied all 3 of the following criteria: (1) showed increased CREBBP loading in the CB-to-CC transition, (2) showed reduced CREBBP loading in CREBBPKAT-PM cells, and (3) contained 1 or more IRF4 motifs (supplemental Figure 10C-E; supplemental Table 2). Tetracycline-inducible IRF4 expression was able to increase H3K27Ac (Wilcoxon rank-sum P < 2.2 × 10⁻¹⁶ for both RL and HT) and loading of EP300 (Wilcoxon rank-sum P < 2.2 × 10⁻¹⁶ for both RL and HT) in Y1503C RL and HT cells compared with untreated controls (Figure 6B). This shows that increasing the nuclear abundance of TF may be able to saturate catalytically dead CREBBP KAT-PM protein and partially restore enhancer activation via EP300 compensation. Notably, we also observed increased loading of CREBBP Y1503C over these regions (Figure 6B; Wilcoxon rank-sum P < 2.2 × 10⁻¹⁶ for both RL and HT), suggesting that the increased acetylation may be capable of stabilizing the catalytically dead complex on chromatin. We validated this using a dCas9-p300 construct in which the KAT domain of p300 can be recruited to a specific genomic locus using guide RNAs. We focused on the CD74 enhancer that is dynamically loaded with CREBBP in CCs and has significantly reduced CREBBP loading in CREBBPKAT-PM cells (Figure 6C). Owing to the size of this enhancer, we used a dual-guide system, with each guide construct expressing different fluorochromes, to recruit dCas9-p300 to 2 neighboring sites (Figure 6C-D). Flow cytometry showed a significant increase in CD74 expression on dual-guide bearing cells compared with those with no guides (Figure 6E), providing validation of increased CD74 enhancer activity and gene expression. Therefore, we probed H3K27Ac and loading of CREBBP and EP300 using CUT&RUN quantitative polymerase chain reaction. The dual guides were sufficient to induce enhancer H3K27Ac in all cell lines, but with a lower magnitude of effect in CREBBPY1503C cells (Figure 6F). Histone acetylation also increased the loading of both CREBBP and EP300 at the CD74 enhancer (Figure 6F), potentially explaining the reduced H3K27Ac in CREBBPY1503C cells because catalytically inactive CREBBP is being recruited in place of a catalytically active CREBBP in CREBBPWT cells. Together these data show that saturation of CREBBP KAT-PM by high nuclear TF abundance can induce EP300 compensation and local histone acetylation leading to stabilization of CREBBP and EP300 on chromatin.
Rescue of CREBBP and EP300 loading by saturating TF and local histone acetylation. (A) Western blot and schematic showing tetracycline-inducible IRF4 expression. (B) Density plots of H3K27Ac (left), EP300 (middle), and CREBBP (right) in RL (above) and HT (below) CREBBP Y1503C cells, relative to isogenic WT controls, showing regions that are predicted to be bound by IRF4. (C) Schematic showing the placement of dual-guide RNAs over the CD74 enhancer with reduced H3K27Ac in CREBBP KAT-PM cells compared with isogenic WT controls. (D) Representative flow cytometry plot showing fluorescent markers of each guide-RNA construct, enabling comparison of dual-positive and dual-negative populations. (E) Flow cytometry of CD74 expression in cells with no guide RNA (blue) or 2 guide RNAs (dual guides, red) for the dCas9-p300 system. (F) Fold change in the abundance of H3K27Ac, EP300, and CREBBP on the CD74 enhancer in no guide (blue) and dual-guide (red) populations, normalized to the no guide condition in WT cells.
Rescue of CREBBP and EP300 loading by saturating TF and local histone acetylation. (A) Western blot and schematic showing tetracycline-inducible IRF4 expression. (B) Density plots of H3K27Ac (left), EP300 (middle), and CREBBP (right) in RL (above) and HT (below) CREBBP Y1503C cells, relative to isogenic WT controls, showing regions that are predicted to be bound by IRF4. (C) Schematic showing the placement of dual-guide RNAs over the CD74 enhancer with reduced H3K27Ac in CREBBP KAT-PM cells compared with isogenic WT controls. (D) Representative flow cytometry plot showing fluorescent markers of each guide-RNA construct, enabling comparison of dual-positive and dual-negative populations. (E) Flow cytometry of CD74 expression in cells with no guide RNA (blue) or 2 guide RNAs (dual guides, red) for the dCas9-p300 system. (F) Fold change in the abundance of H3K27Ac, EP300, and CREBBP on the CD74 enhancer in no guide (blue) and dual-guide (red) populations, normalized to the no guide condition in WT cells.
Enforced CD4 T-cell engagement with a therapeutic bispecific antibody is sufficient to drive CD40 response and cell death in CREBBP KAT-PM cells
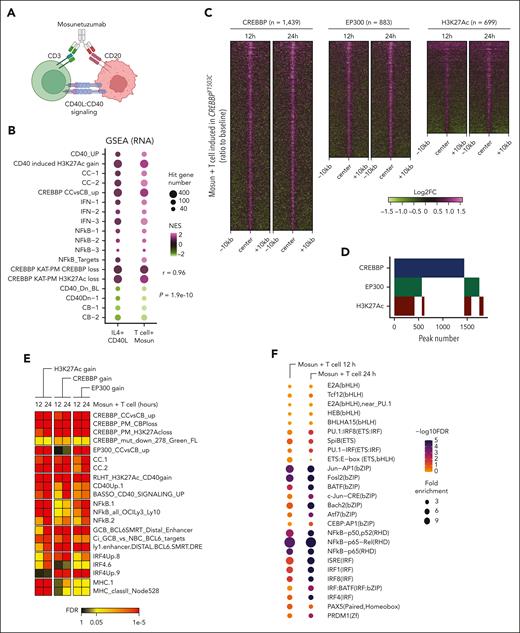
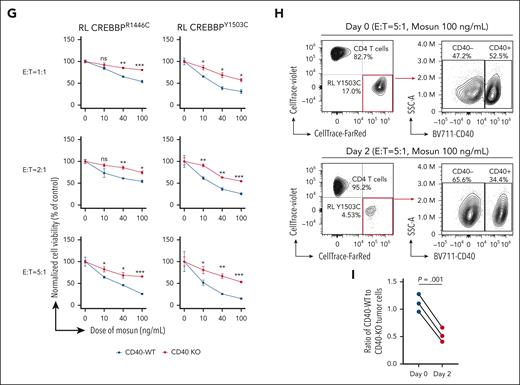
Our data highlight the induction of CD40 signaling as a path toward overcoming the zombie enzyme effect of CREBBP KAT-PM. However, CD40 agonistic antibodies have been investigated clinically and hampered by toxicity.28 Therefore, we sought an alternative strategy to engage CD40 signaling on malignant cells and hypothesized that enforced engagement of CD4 T cells may induce association of CD40L on CD4 T cells with CD40 on lymphoma B cells. We tested this hypothesis by sorting healthy donor peripheral blood CD4+ T cells and coculturing them with CREBBPY1503C cells in the presence or absence of mosunetuzumab (Figure 7A; supplemental Figure 11A-B), a CD20/CD3 bispecific antibody approved for relapsed/refractory FL.29 Healthy donor peripheral blood mononuclear cells were not HLA matched, and therefore, alloreactivity to our cell lines is expected; thus, we compared only between isogenic lines that have the same degree of HLA mismatch. We performed RNA-seq and CUT&RUN for H3K27Ac, CREBBP, and EP300 on live sorted tumor B cells after coculture for 12 or 24 hours, before major cytotoxic effects being observed. Analysis of RNA-seq data revealed the induction and suppression of similar gene sets (Figure 7B; supplemental Table 8) and individual genes (supplemental Figure 11C) to those observed after CD40L + IL-4 treatment, indicating that engagement of CD4 T cells can drive immune synapse-like signaling. CD4 T-cell engagement also drove significantly increased CREBBP and EP300 loading and H3K27Ac (Figure 7C-D; supplemental Table 9). Notably, most loci with significant gain of both CREBBP and EP300 (415/567, 73.2%) showed H3K27Ac gain compared with only a small fraction of loci with significant gain of only CREBBP (51/872, 5.8%; Figure 7D), illustrating the importance of EP300 compensation for activation of these redundantly bound enhancers after T-cell engagement with CREBBP-mutant lymphoma cells. Hypergeometric gene set enrichment analysis of these regions confirmed a highly significant enrichment of CD40-induced genes, CC signature genes, genes that are dynamically loaded with CREBBP in CCs, genes with loss of CREBBP loading in KAT-PM, and targets of the NF-κB and IRF4 TFs (Figure 7E; supplemental Table 10). TF motif analysis of regions with increased H3K27Ac showed a strong enrichment for TFs that are known to be downstream of CD40 signaling, including NF-κB, IRF4, and AP-1, and that we had found to be associated with regions that are dynamically loaded with CREBBP in CCs and unloaded in KAT-PM (Figure 7F). Therefore, we evaluated whether this effect would be cytotoxic over longer exposures of 48 hours, revealing a dose-dependent increase in cell death of CREBBPR1446C and CREBBPY1503C RL cells with increasing concentrations of mosunetuzumab and effector-to-target ratio (Figure 7G). CD40 KO significantly inhibited the death of CREBBPY1503C RL cells cocultured with CD4 T cells and increasing concentrations of mosunetuzumab for 2 days (Figure 7G). Furthermore, in mixed cultures of CREBBPY1503C + CD40-WT and CREBBPY1503C + CD40-KO RL cells with CD4 T cells and 100 ng/mL mosunetuzumab, the CD40-WT cells were preferentially killed compared with CD40-KO cells (Figure 7H-I; paired t test P = .001). Cytotoxicity was also observed in CREBBPWT cells but, despite showing stronger activation of enhancers than CREBBPY1503C cells that are suggestive of a conserved molecular response to CD4 T-cell engagement (supplemental Figure 11D), cytotoxicity was not abrogated by CD40-KO in the WT setting (supplemental Figure 11E). This may in part be caused by the ability of CD40 signaling to induce increased MHC class II (MHCII) and costimulatory molecule expression in CREBBP KAT-PM cells that have a low basal expression of these proteins, in contrast to CREBBPWT cells in which increases are less pronounced or absent owing to high basal expression (supplemental Figure 8H). Similarly, we observed a marked increase in MHCII expression in CREBBP KAT-PM cells after coculture with CD4 T cells in the presence of mosunetuzumab, which was reduced by CD40-KO, but no measurable increase in MHCII in these conditions in CREBBPWT cells (supplemental Figure 11F-G). Owing to the allogeneic nature of our coculture experiments, T-cell receptor to MHC responses are expected to contribute to the observed cytotoxicity, as they would for antitumor immune responses by “bystander” T cells in patients. Therefore, the specificity of CD40-dependent MHCII upregulation for the CREBBP KAT-PM context may explain the observed CD40-dependence of cytotoxicity. Therefore, enforced CD4 T-cell engagement using CD20/CD3 bispecific antibody is able to induce CD40 signaling, partially overcoming the effect of CREBBP KAT-PM to induce MHCII expression and toxicity in CREBBP-mutant lymphoma cells in a CD40-dependent manner.
Induction of CD40 signaling and cell death by CD4 T-cell engagement with mosunetuzumab. (A) Schematic of the rationale for using mosunetuzumab to engage CD40 signaling in lymphoma B cells. (B) GSEA normalized enrichment scores (NES) of signatures induced by CD40L + IL-4, comparing CD4 T-cell engagement with mosunetuzumab (mosun). (C) Heat maps showing regions of significantly (FDR <0.05) increased CREBBP (left), EP300 (middle), and H3K27Ac (right) at 12 and 24 hours after CD4 T-cell engagement with mosunetuzumab compared with control. (D) Altuna plot of the overlap of regions shown in panel C. (E) Heat map of hGSEA FDR q-values for genes with increased H3K27Ac, CREBBP, or EP300 at 12 and 24 hours after CD4 T-cell engagement with mosunetuzumab compared with control. (F) Bubble plot of motif enrichment analysis (HOMER) for increased H3K27Ac at 12 and 24 hours after CD4 T-cell engagement with mosunetuzumab compared with control. (G) Cell viability of CREBBP R1446C or Y1503C mutant RL cells with (red) or without (blue) CD40 KO at different effector-to-target ratios of CD4 T cells to lymphoma cells with 100 ng/mL of mosunetuzumab. Student t test ∗P < .05; ∗∗P < .01; ∗∗∗P < .001. (H) CD4 T-cell killing of CREBBP Y1503C mutant RL cells within mixed cultures of CD40-positive and CD40-negative cells. (I) Comparison of the relative fraction of CD40 WT and CD40 KO cells within mixed cultures at the start (day 0) and end (day 2) of cocultures with CD4 T cells plus mosunetuzumab.
Induction of CD40 signaling and cell death by CD4 T-cell engagement with mosunetuzumab. (A) Schematic of the rationale for using mosunetuzumab to engage CD40 signaling in lymphoma B cells. (B) GSEA normalized enrichment scores (NES) of signatures induced by CD40L + IL-4, comparing CD4 T-cell engagement with mosunetuzumab (mosun). (C) Heat maps showing regions of significantly (FDR <0.05) increased CREBBP (left), EP300 (middle), and H3K27Ac (right) at 12 and 24 hours after CD4 T-cell engagement with mosunetuzumab compared with control. (D) Altuna plot of the overlap of regions shown in panel C. (E) Heat map of hGSEA FDR q-values for genes with increased H3K27Ac, CREBBP, or EP300 at 12 and 24 hours after CD4 T-cell engagement with mosunetuzumab compared with control. (F) Bubble plot of motif enrichment analysis (HOMER) for increased H3K27Ac at 12 and 24 hours after CD4 T-cell engagement with mosunetuzumab compared with control. (G) Cell viability of CREBBP R1446C or Y1503C mutant RL cells with (red) or without (blue) CD40 KO at different effector-to-target ratios of CD4 T cells to lymphoma cells with 100 ng/mL of mosunetuzumab. Student t test ∗P < .05; ∗∗P < .01; ∗∗∗P < .001. (H) CD4 T-cell killing of CREBBP Y1503C mutant RL cells within mixed cultures of CD40-positive and CD40-negative cells. (I) Comparison of the relative fraction of CD40 WT and CD40 KO cells within mixed cultures at the start (day 0) and end (day 2) of cocultures with CD4 T cells plus mosunetuzumab.
Discussion
Catalytically inactive pseudoenzymes, popularly referred to as zombie enzymes, have emerged as having important functional roles by modifying the activity of their paralogs through scaffolding roles, causing allosteric changes, or by competing with the paralog for substrate without catalyzing the enzymatic reaction.24 Here we show that CREBBP KAT-PM creates a zombie enzyme that inhibits the function of its paralog, EP300, by binding limited nuclear quantities of TF substrate. The zombie enzyme role of CREBBP KAT-PM explains the unique potency of KAT-PM compared with nonsense/frameshift mutations that have been modeled with CREBBP KO in multiple studies.4,30-32
Our data show a subset of selective roles for CREBBP and EP300 in the GC and suggest that dynamic loading of CREBBP is in part driven by CD40 signaling, likely including tonic signaling that occurs after upregulation of CD40 expression in CCs, and is critical for downstream transcriptional responses. Importantly, this effect can be overcome by signaling that induces saturating levels of nuclear TF, such as active CD40 signaling resulting from CD40 ligand or enforced CD4 T-cell engagement by a bispecific antibody. The central dogma of bispecific antibody response is that it occurs via engagement of cytotoxic T cells with lymphoma B cells, in an MHC-independent manner, and subsequent direct cytotoxicity via effector molecules.29 Although this is likely to be an important mechanism for bispecific antibody response, we additionally show that CD4 T-cell engagement is capable of driving CD40 signaling that overcomes the zombie enzyme effect of CREBBP KAT-PM, restores antigen presentation, and induces cytotoxicity. Therefore, we speculate that the mechanisms of response to bispecific antibodies are multifaceted and include signaling that is induced after immune synapse formation, which can be altered by somatic mutations. CD4-mediated cytotoxicity was not restricted to CREBBP-mutant lymphoma; therefore, this is unlikely to be a biomarker for response. However, these insights add depth to our functional understanding of bispecific antibody responses in patients with lymphoma and shows that CREBBP KAT-PM effects can be mechanistically overcome using bispecific T-cell engagers, providing a rational immunotherapeutic strategy to target epigenetic deregulation.
In conclusion, we have uncovered the mechanism underlying the dominant-negative function of CREBBP KAT domain mutations in B-cell lymphoma and, in doing so, highlighted important fundamentals about the role of CREBBP and EP300 in signal-responsive gene expression and their associated functions in GC B cells. Signal-responsive gene expression occurs in all human tissues, and CREBBP and EP300 are mutated in multiple human malignancies.33 Thus, we expect these principles to apply by and large to many cellular contexts. Moreover, we expect that the principle of induced gene expression in response to enforced immune cell engagement may offer additional therapeutic opportunities with combination strategies that capitalize on induced vulnerabilities and is a topic warranting further investigation.
Acknowledgments
This work was supported by National Institutes of Health, National Cancer Institute grants R01CA201380 and P01CA272295. M.R.G. is a Scholar of the Leukemia and Lymphoma Society. H.Y. is supported by a Fellow award from the Leukemia and Lymphoma Society.
Authorship
Contribution: H.Y. designed and performed the research, analyzed data, and wrote the paper; W.Z., G.C., K.B., R.C., S.L., E.R., A.W., S.P., A.M., L.R., A.H., C.R.F., S.N., L.N., R.E.D., and Q.D. performed research; V.R. and J.M.H. analyzed data; F.R.-L. designed the research and wrote the manuscript; and M.R.G. designed the research, analyzed data, and wrote the manuscript.
Conflict-of-interest disclosure: M.R.G. reports research funding from Sanofi (including this study), Kite/Gilead, AbbVie, and Allogene; consulting for AbbVie, Allogene, and Bristol Myers Squibb; honoraria from Daiichi Sankyo and DAVA Oncology; and stock ownership of KDAc Therapeutics. S.N. received research support from Kite/Gilead, Bristol Myers Squibb, Cellectis, Poseida, Allogene, Unum Therapeutics, Precision Biosciences, and Adicet Bio; served as advisory board member/consultant for Kite/Gilead, Merck, Novartis, SELLAS Life Sciences, Athenex, Allogene, Incyte, Adicet Bio, Bristol Myers Squibb, Legend Biotech, bluebird bio, Fosun Kite, Sana Biotechnology, Caribou, Astellas Pharma, MorphoSys, Janssen, Chimagen, ImmunoACT, and Orna Therapeutics; has received royalty income from Takeda Pharmaceuticals; has stock options from Longbow Immunotherapy, Inc; and has intellectual property related to cell therapy. L.N. reports honoraria for participation on advisory boards from ADC Therapeutics, Atara, Bristol Myers Squibb, Caribou Biosciences, Epizyme, Genentech, Genmab, Gilead/Kite, Janssen, MorphoSys, Novartis, and Takeda; reports research support from Bristol Myers Squibb, Caribou Biosciences, Epizyme, Genentech, Genmab, Gilead/Kite, Janssen, IGM Biosciences, Novartis, and Takeda; and serves on a data safety and monitoring board for Denovo, Genentech, MEI Pharma, and Takeda. C.R.F. reports consulting for AbbVie, Bayer, BeiGene, Celgene, Denovo Biopharma, Foresight Diagnostics, Genentech/Roche, Genmab, Gilead, Karyopharm, N-Power Medicine, Pharmacyclics/Janssen, Seagen, and Spectrum; research funding from 4D, AbbVie, Acerta, Adaptimmune, Allogene, Amgen, Bayer, Celgene, Cellectis EMD, Gilead, Genentech/Roche, Guardant, Iovance, Janssen Pharmaceuticals, Kite, MorphoSys, Nektar, Novartis, Pfizer, Pharmacyclics, Sanofi, Takeda, TG Therapeutics, Xencor, Ziopharm, Burroughs Wellcome Fund, Eastern Cooperative Oncology Group, National Cancer Institute, V Foundation, and Cancer Prevention and Research Institute of Texas; and stock options in Foresight Diagnostics and N-Power Medicine. The remaining authors declare no competing financial interests.
Correspondence: Michael R. Green, Department of Lymphoma and Myeloma, The University of Texas MD Anderson Cancer Center, 1515 Holcombe Blvd, Unit 903, Houston, TX 77030; email: mgreen5@mdanderson.org; and Fernando Rodrigues-Lima, Université Paris Cité, Unité BFA CNRS 8251, Case 7073, 75013 Paris, France; email: fernando.rodrigues-lima@u-paris.fr.
References
Author notes
H.Y. and W.Z. contributed equally to this study.
Raw (FASTQ) data are being uploaded to the sequence read archive. Processed files are being uploaded to the Gene Expression Omnibus database (accession number GSE273484). No unique code was used in this study.
The online version of this article contains a data supplement.
There is a Blood Commentary on this article in this issue.
The publication costs of this article were defrayed in part by page charge payment. Therefore, and solely to indicate this fact, this article is hereby marked “advertisement” in accordance with 18 USC section 1734.

This feature is available to Subscribers Only
Sign In or Create an Account Close Modal