Abstract
Previous work investigating the role of MDR-1 overexpression in relapsed and refractory lymphoma led us to investigate a possible role for multidrug resistance-associated protein (MRP) as a cause of resistance in patients who did not overexpress MDR-1. A quantitative polymerase chain reaction (PCR) method for measuring MRP expression was validated. Immunoblot analysis suggested that no major discrepancy was present between mRNA expression and protein levels. MRP levels were found to be independent of sample tumor content by immunophenotyping, suggesting that the presence of normal cells had no significant impact on measurements of MRP expression. We evaluated MRP in 55 biopsy samples from 40 patients with refractory lymphoma enrolled on a trial of infusional chemotherapy (EPOCH). Pre- and post-EPOCH samples were available from 15 patients. MRP levels were also evaluated in 16 newly diagnosed, untreated lymphoma patient samples. No significant difference in MRP mRNA expression was noted between pre- and post-EPOCH groups. Also, MRP levels in the newly diagnosed patient samples were not significantly different from either pre- or post-EPOCH groups. Two of 15 paired pre- and post-EPOCH patient samples exhibited overexpression of MRP after EPOCH chemotherapy, with measured increases of 10-fold and 18-fold. We conclude that MRP overexpression is not responsible for non–P-glycoprotein (Pgp)–mediated drug resistance in the majority of these patients, although it may be important in a subset of patients. Defining this subset prospectively could aid in the development of clinical trials of MRP modulation in drug-resistant lymphoma.
DRUG RESISTANCE IS a major therapeutic stumbling block for cancer chemotherapy. One mechanism of drug resistance characterized in vitro is multidrug resistance (MDR), which is associated with overexpression of the MDR-1 gene encoding a 170-kD transport protein called P-glycoprotein (Pgp).1,2 However, clinically the role of Pgp in drug resistance is still being defined.3 More recently, a new drug efflux pump designated the multidrug resistance-associated protein (MRP) has been described that could partially explain drug resistance in tumors where Pgp does not seem to play a significant role.
MRP was initially cloned from a drug-resistant human small-cell lung cancer cell line, HR69AR.4 It is located on the short arm of chromosome 16 and encodes a 190-kD adenosine triphosphate (ATP)-binding transport protein with homology to MDR-1.4-6 While the MRP phenotype has been difficult to precisely characterize, MRP confers resistance to several natural product drugs including doxorubicin, etoposide, and vincristine.4,7 8 As all of these drugs are common to standard lymphoma regimens, we sought to investigate the role of MRP in refractory and recurrent lymphoma.
In vitro studies of MRP have shown it to be an energy-dependent drug transporter responsible for drug resistance and active drug efflux in several independently selected cell lines.4,5,9-13 While high levels of expression of MRP mRNA with gene amplification are often observed in these highly selected cell lines, MRP mRNA is also readily detected, at lower levels, in unselected drug-sensitive cell lines. In addition, transfection of cells with the MRP cDNA has been shown to confer a modest degree of drug resistance.7,8 Functionally, MRP differs significantly from the MDR-1 gene product Pgp in that Pgp antagonists do not reverse MRP-mediated drug resistance; a vesicle-mediated transport mechanism may be involved; and glutathione conjugation may be required for some MRP-associated drug efflux.14-16 Unlike Pgp-mediated drug resistance, the MRP-mediated drug resistance phenotype is not as clearly correlated to drug efflux. For example, in the H69AR cell line from which MRP was first cloned, there is no evidence of a drug accumulation defect or of drug efflux.4 Reversal of MRP-mediated drug resistance has been demonstrated with several agents including buthionine sulfoximine, genistein, GF 109203X, MK571, and probenecid.15 17-19 These agents could find clinical application in drug resistance reversal should MRP prove to be a clinically significant mechanism of drug resistance.
The role of MRP in clinical drug resistance is currently being defined. MRP expression has been reported in several studies in clinical tumor samples derived from patients with leukemias, neuroblastoma, non-small–cell lung cancer, and anaplastic carcinoma of the thyroid.20-27 In leukemia, high levels of MRP expression have been noted in samples from both treated and untreated patients,20,22,23,26 and two reports correlate an increased expression of MRP with refractory disease and relapse.22,26 In some patients with the M4Eo variant of M4 AML, associated with an inversion of chromosome 16, deletion of the gene encoding MRP has been reported. Interestingly, this deletion has been correlated with an improved prognosis.27 In neuroblastoma, increased MRP expression has been correlated with increased N-myc expression, and has been shown to be an independent marker of poor prognosis.21 Thus, while the role of MRP in the clinic remains to be clarified, there is intriguing evidence that it may indeed be a significant mechanism of clinical resistance warranting further study.
In this study, we extend previous work by documenting the level of MRP expression in lymphoma samples from patients enrolled in a phase II trial of infusional doxorubicin, etoposide, and vincristine with bolus cyclophosphamide and prednisone (EPOCH). EPOCH was given in combination with R-verapamil, a Pgp antagonist, which was added in a crossover study design in patients with stable or progressive disease on EPOCH alone.28 In this trial, Pgp modulation was found to be of some benefit in 12% of 41 non-Hodgkin's lymphoma (NHL) patients, who had stable or progressive disease on EPOCH alone and achieved either a complete or partial response with the addition of R-verapamil as a Pgp modulator.28 An additional 12% of patients had a minimal response with the addition of R-verapamil. Increased MDR-1 expression was noted in 42% of patients in whom serial biopsies were available. These results also suggested that mechanisms other than Pgp are important in refractory lymphoma; thus we examined a possible role for MRP. Because patients on this study underwent serial biopsies, samples from minimally invasive procedures were small, preventing large scale protein or RNA extraction. Therefore, MRP expression was measured by a modification of a quantitative polymerase chain reaction (PCR) method, which has been previously described and validated for MDR-1.29
MATERIALS AND METHODS
Patient population.Sixty biopsy samples were available from among 112 patients enrolled on a phase II study of EPOCH chemotherapy and R-verapamil as previously described.28 Patients had received a median of eight drugs and two prior combination chemotherapy regimens before enrollment on the study, and all had previously received an anthracycline containing regimen. Tissue samples from newly diagnosed and untreated patients with lymphoma were obtained from the Department of Pathology, National Cancer Institute, Bethesda, MD and from the Cooperative Human Tissues Network.
Cell lines.mRNA was isolated from the unselected human colon carcinoma cell line, SW620, which expresses endogenous MRP at a low level. SW620 cells were maintained in RPMI (Biofluids, Inc, Rockville, MD) with 10% fetal bovine serum (FBS, Gibco-BRL, Gaithersburg, MD). Over 1 mg of RNA was extracted by the guanidium isothiocyanate (GTC)/cesium chloride method in a single preparation and used in all experiments.30 Three MRP-overexpressing sublines were used as positive controls for the PCR quantitation. MCF-7 VP-16 cells and HL60 AR cells, generously provided by Kenneth Cowan and Erasmus Schneider (Medicine Branch, National Cancer Institute, National Institutes of Health, Bethesda, MD), were selected from MCF-7 human breast cancer cells with VP-16 and HL60 leukemic cells with doxorubicin, respectively.10,12 UMCC VP-16 cells, generously donated by Austin Doyle (University of Maryland Cancer Center, Baltimore, MD), were selected with VP-16 from UMCC-1, a human small-cell lung cancer cell line.11
RNA extraction and quantitative PCR.Tumor biopsy specimens obtained from lymphoma patients were stored at −70°C, then pulverized, and solubilized in GTC. Needle aspirates and cell suspensions were immediately solubilized and stored in GTC. RNA was extracted as previously described, and checked for quality by ethidium bromide staining after separation on a formaldehyde gel.31,32 Quantitative PCR was performed as previously described with some modifications.29 Reverse transcription of 1 μg of total RNA using 0.5 mmoles of random primers was performed at 37°C for 1 hour using 100 U of Moloney murine leukemia virus (M-MLV) reverse transcriptase (GIBCO-BRL, Gaithersburg, MD) in a 20 μL reaction volume with 50 mmol/L Tris-HCl, pH 8.3, 75 mmol/L KCl, 3 mmol/L MgCl2 , 10 mmol/L dithiothreitol (DTT), RNasin 20 U, and 1 mmol/L each of dATP, dCTP, dGTP, dTTP. The resulting cDNA was diluted in water and 20 μL of diluted cDNA was added to 70 μL of 1X PCR buffer (50 mmol/L KCl, 40 mmol/L Tris-HCl, pH 8.3, 1.8 mmol/L MgCl2 , and 100 μg/mL bovine serum albumin [BSA]), 0.5 mmoles each of the 5′ and 3′ PCR-primers, 0.2 mmol/L of each of the dNTPs, and 2.4 U of Taq polymerase (Perkin Elmer, Foster City, CA). For MRP, the 5′ primer sequence used was CGGAAACCATCCACGACCCTAATCC and the 3′ primer sequence used was ACCTCCTCATTCGCATCCACCTTGG, corresponding to residues 733-757 and residues 1003-1027, respectively, in the MRP cDNA sequence. These primers gave a PCR product of 295 bp. The β2-microglobulin primers used were as previously described.29 Amplification was performed for 30 cycles of sequential denaturation (94°C, 1 minute, 15 seconds); annealing (55°C , 1 minute, 15 seconds); and extension (72°C, 1 minute, 30 seconds for the first 20 cycles and 2 minutes for the last 10 cycles). For the negative control, water was amplified a total of 40 cycles to detect possible contamination. A total of 40 μL of each PCR product was electrophoresed in 1× Tris/borate/EDTA (TBE) electrophoresis buffer on a 2% NuSiev/1% agarose gel. Gels were stained with 2 μg/mL ethidium bromide and analyzed using a Fotodyne image analyzer (Fotodyne Inc, Hartland, WI).
Immunophenotyping.Estimates of normal T cell, B cell, and tumor involvement in the biopsy samples were previously reported.31
Immunoblotting.Exponentially growing cells or minced patient samples were harvested in hypotonic buffer (10 mmol/L NaCl, 1 mmol/L EDTA, 20 mmol/L NaH2PO4 ) and allowed to swell on ice for 10 minutes. Cells were sonicated, the nuclei sedimented at 1,000g at 4°C for 5 minutes, and the supernatant spun at 35,000 RPM for 30 minutes at 4°C. The supernatant was solubilized in a 1% 3-[(3-chlolamidopropyl)dimethylammonio]-1-propane-sulfonate (CHAPS) solution. Protein concentration was quantitated by a colorometric assay (Bio-Rad, Hercules, CA). The protein was separated on a 7.5% sodium dodecyl sulfate-polyacrylamide gel electrophoresis (SDS-PAGE) gel and transferred to polyvinylidene fluoride (PVDF) membranes. The blot was blocked with 3% BSA in TBS (20 mmol/L Tris-HCl, pH 7.5, 150 mmol/L NaCl and 0.1% Tween-20) for 1 hour. A monoclonal antibody, MRPm6 (a gift from Rik Scheper, Department of Pathology, Free University Hospital, Amsterdam, The Netherlands) was used at a dilution of 1:2,000 and incubated for 2 hours. After three washes in TBS, the blot was incubated with horseradish peroxidase (HRP)-conjugated antimouse antibody at a dilution of 1:1,000 for 1 hour. After washing, the immunolabeled protein was detected by chemiluminescence (Dupont, Renaissance, Boston, MA).
RESULTS
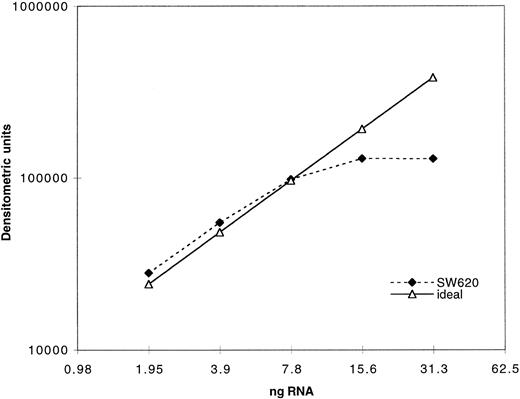
Expression of MRP was determined as previously described for MDR-1 by measuring the PCR product after amplification of serially diluted cDNA derived from reverse transcription of extracted RNA.29 In Fig 1, quantitation of PCR product using our MRP assay is plotted against a range of twofold dilutions of input cDNA from the cell line SW620. The dashed line indicates the ideal, which would be achieved if a doubling of PCR product occurred across the range of twofold dilutions of input cDNA. As can be seen, plateau of PCR product occurs with increased input cDNA. Quantitation of all clinical samples was performed in the exponential range. Serially diluted β2-microglobulin cDNA was also amplified in parallel and both products were quantitated by densitometry after separation on an agarose gel. Measurement of β2-microglobulin was performed concurrently with MRP measurements in a separate reaction for each sample. The use of β2-microglobulin as a control gene in this patient population was previously validated using Northern analysis.31 Both PCR products were assigned numerical values normalized to the level of expression in a control cell line, SW620, for which the PCR assay was performed with each experiment. The SW620 cells were assigned a standard MRP expression value of 10 and a value of 1 for β2-microglobulin. The results in cell lines and patient samples were then standardized to enable direct comparison between samples.
Validation of PCR assay: 1 μg of total RNA was reverse transcribed and the resulting cDNA serially diluted twofold. The cDNA dilutions were then amplified with MRP primers as described in the Materials and Methods section. A total of 40 μL of the PCR products was electrophoresed on an agarose gel and the bands quantitated by densitometry. The dotted line represents the ideal if the quantity of the PCR products increased twofold with every twofold increase in input RNA.
Validation of PCR assay: 1 μg of total RNA was reverse transcribed and the resulting cDNA serially diluted twofold. The cDNA dilutions were then amplified with MRP primers as described in the Materials and Methods section. A total of 40 μL of the PCR products was electrophoresed on an agarose gel and the bands quantitated by densitometry. The dotted line represents the ideal if the quantity of the PCR products increased twofold with every twofold increase in input RNA.
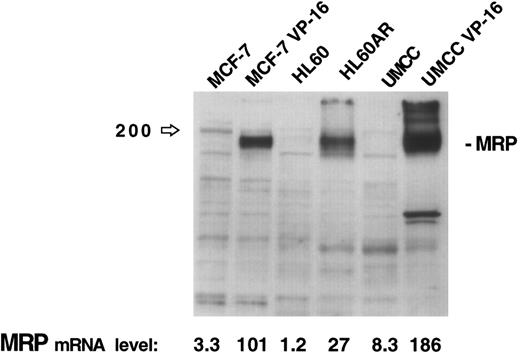
The results of this assay for MRP gene expression were compared with immunoblotting of 30 μg of protein extracts for MRP from three cell lines (MCF-7, HL60, and UMCC) and their respective MRP-overexpressing drug resistant sublines (MCF-7-VP16, HL60AR, and UMCC VP-16). While no MRP bands are visible for the parental cell lines on the immunoblot in Fig 2, quantitation by densitometry of MRP in the MRP-overexpressing sublines shows relative expression levels of MRP similar to those obtained by our PCR assay. The PCR assay was, therefore, felt to be a good reflection of MRP expression levels, reflecting accurately high and low levels of MRP as measured by immunoblotting.
MRP expression as measured by immunoblotting in three cell lines and their respective MRP-overexpressing sublines. MRP expression as measured by PCR assay for each cell line is noted at the bottom of the figure.
MRP expression as measured by immunoblotting in three cell lines and their respective MRP-overexpressing sublines. MRP expression as measured by PCR assay for each cell line is noted at the bottom of the figure.
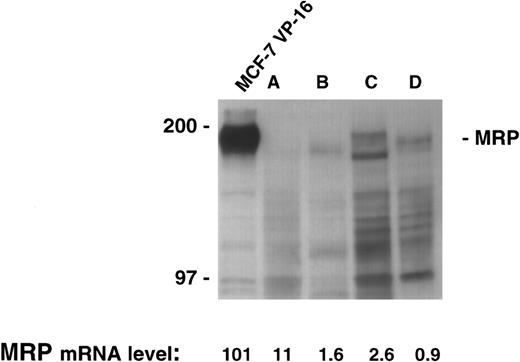
There was sufficient material available to allow extraction of both RNA and protein in four patient samples. The quantitative PCR assay was performed on the four samples and levels from 0.9 to 11 were measured. However, immunoblotting for MRP in this range produces no appreciable signal despite the loading of a large quantity of protein (200 μg) in each lane, and the use of long exposure times (Fig 3). Therefore, as shown in the control cell lines, low levels of MRP expression by our PCR assay were reflective of low protein levels by immunoblotting.
MRP expression as measured by immunoblotting in the cell line MCF-7 VP-16 and four patient samples. Protein was harvested from four patient samples where sufficient material was available. A total of 200 μg of protein from the four patient samples and 100 μg of protein from MCF-7 VP-16 cells was analyzed by immunoblotting as described in the Materials and Methods section.
MRP expression as measured by immunoblotting in the cell line MCF-7 VP-16 and four patient samples. Protein was harvested from four patient samples where sufficient material was available. A total of 200 μg of protein from the four patient samples and 100 μg of protein from MCF-7 VP-16 cells was analyzed by immunoblotting as described in the Materials and Methods section.
To determine whether admixed normal cells contributed significantly to the measured levels of MRP, we correlated measured MRP levels with the sample tumor content, and compared mean sample tumor content between pre- and post-EPOCH samples. Sixty patient biopsy samples were evaluated as previously described by immunophenotyping to assess the quantity of tumor in each sample.31 Five biopsy samples in which tumor cell content was less than 30% tumor cells were excluded from tabulation of MRP levels. Four samples for which tumor content could not be measured were included for analysis. While these samples were not immunophenotyped for formal tumor content analysis, routine histology showed semiquantitatively that tumor comprised over 30% of the sample. For the remaining 51 samples, the median sample tumor content was 80% and the mean tumor content was 77.2%.
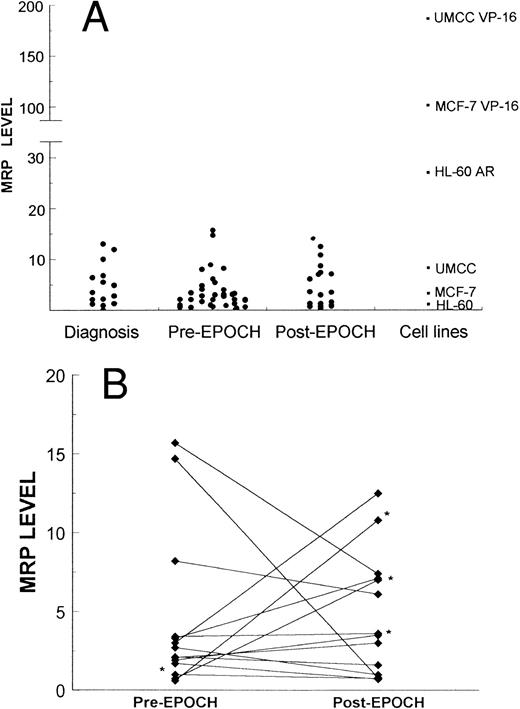
Expression of MRP in lymphoma samples and cell lines was measured by PCR as described in the Materials and Methods section. (A) 16 biopsy samples obtained at diagnosis of lymphoma, 55 biopsy samples obtained from patients, 36 pre-EPOCH and 19 post-EPOCH, and three cell lines and their respective MRP-overexpressing sublines. (B) Serial samples obtained from 15 patients pre- and post-EPOCH. The four samples included without percent tumor determination are marked with an asterisk.
Expression of MRP in lymphoma samples and cell lines was measured by PCR as described in the Materials and Methods section. (A) 16 biopsy samples obtained at diagnosis of lymphoma, 55 biopsy samples obtained from patients, 36 pre-EPOCH and 19 post-EPOCH, and three cell lines and their respective MRP-overexpressing sublines. (B) Serial samples obtained from 15 patients pre- and post-EPOCH. The four samples included without percent tumor determination are marked with an asterisk.
MRP levels were measured in samples from 40 patients at some point in their therapy, and a total of 55 MRP levels were tabulated. Of these 40 patients, 12 had low-grade lymphomas including four follicular small-cleaved–cell, three follicular mixed, two small-lymphocytic, and three mantle-cell lymphomas. Thirteen patients had low-grade lymphomas with progression to intermediate- or high-grade histologies including four diffuse large-cell/immunoblastic, six diffuse mixed, and three blastic-variant mantle-cell lymphomas. Fifteen patients had intermediate- or high grade-lymphomas including 12 diffuse large-cell/immunoblastic lymphomas, and three lymphoblastic lymphomas. Overall, four patients had T-cell, and 36 patients had B-cell lymphomas. Paired pretherapy and posttherapy samples were available from 15 patients. Among these 15 patients, there were two T-cell and 13 B-cell lymphomas. Seven patients had intermediate- or high-grade histologies, six patients' tumors were progressed low-grades, and two patients had low grade lymphoma. MRP levels were also measured in samples from 16 newly diagnosed, untreated patients not enrolled on the EPOCH trial.
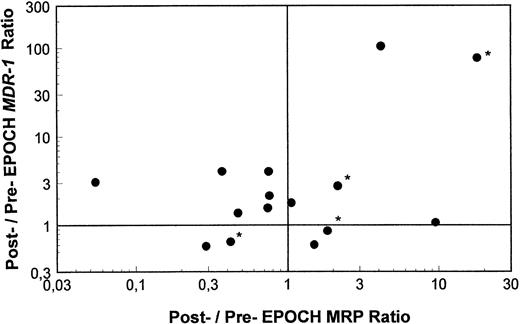
Pre- and post-EPOCH paired samples were found to have no significant difference in the mean expression of MRP (4.26 ± 1.24 pre-EPOCH, 4.44 ± 1.00 post-EPOCH) by a paired two-tailed t-test (P = .90). A comparison of MRP levels from all pre and post samples also shows no significant difference in mean levels (3.51 ± 0.61 pre-EPOCH, 4.12 ± 0.87 post-EPOCH) with P = .57 in a nonpaired two-tailed t-test. The mean expression level of MRP in the untreated samples (4.53 ± 1.03) was also not significantly different from either the pre- or post-EPOCH levels with P = .40 and P = .76, respectively in nonpaired two-tailed t-tests. Overall, MRP levels in all patient samples were in a similar range, within the range of the three unselected cell lines previously shown in Fig 2, and well below the range of their drug-resistant MRP-overexpressing sublines (Fig 4). Ratios of post-EPOCH over pre-EPOCH values of MRP expression and previously measured MDR-1 expression were calculated for each of the 15 such paired samples available. A scatter plot of the 15 paired post- over pre-EPOCH MDR-1 versus MRP ratios shows that three patients had at least a fourfold increase in MRP and that four patients had at least a fourfold increase in MDR-1 (Fig 5). Regression analysis shows no significant correlation between post- over pre-EPOCH ratios of MDR-1 and MRP in these paired samples (r2 = 0.02). Of note is that in those samples overexpressing MRP, the magnitude of the increase is less than the increase observed in MDR-1 overexpressing samples (10-fold and 18-fold compared with 90-fold and 100-fold). Four samples from our previous analysis of MDR-1 expression in tumors from this cohort of patients were not available for measurement of MRP expression.31
A scatter plot of ratios of MRP and MDR-1 expression pre- and post-EPOCH in 15 paired tumor samples. Values over one on the horizontal and vertical axes represent relative increased expression of MRP and MDR-1 post-EPOCH, respectively. The four samples included without percent tumor determination are marked with an asterisk.
A scatter plot of ratios of MRP and MDR-1 expression pre- and post-EPOCH in 15 paired tumor samples. Values over one on the horizontal and vertical axes represent relative increased expression of MRP and MDR-1 post-EPOCH, respectively. The four samples included without percent tumor determination are marked with an asterisk.
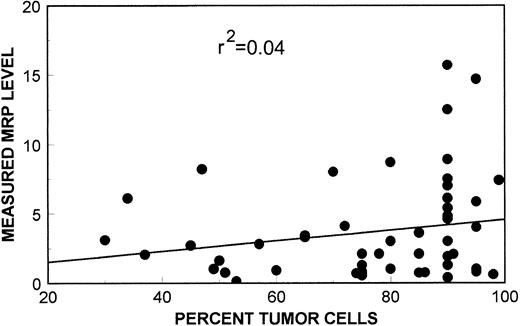
As shown in the scatter plot in Fig 6, measured MRP levels were found to be independent of sample tumor content. The r2 value of 0.04 shows that tumor cell content accounted for approximately 4% of the variability of measured MRP values. MRP mRNA expression in normal lymphocytes as assessed by quantitative PCR was reported by Schneider et al.22 According to their study, all normal lymphopoietic cells express MRP mRNA at similar levels to the leukemia cell line HL60, with the exception of T cells that express levels twofold higher than HL 60. In our assay, HL60 had an MRP mRNA expression level of 1.2, therefore, admixture of normal lymphopoietic cells would tend to decrease our measured MRP mRNA expression levels. There were, however, no significant differences between sample tumor content in either all pre-EPOCH (mean tumor content, 74.6%), and post-EPOCH (mean tumor content, 82.6%) samples, or between paired pre-EPOCH (mean tumor content, 69.7%) and post-EPOCH (mean tumor content, 74.8%) samples. Thus, admixture of normal cells in the biopsy samples did not significantly influence our analysis.
A scatter plot of MRP expression as measured by PCR assay versus sample tumor content. Linear-regression analysis of these data show no significant relationship of sample tumor content to MRP expression measurements by PCR assay (r2 = 0.04).
A scatter plot of MRP expression as measured by PCR assay versus sample tumor content. Linear-regression analysis of these data show no significant relationship of sample tumor content to MRP expression measurements by PCR assay (r2 = 0.04).
DISCUSSION
Results of previous quantitation of MDR-1 in refractory lymphoma and attempts at clinical reversal of resistance by modulation with R-verapamil prompted us to evaluate the role of MRP in this disease. A quantitative PCR assay was validated and used to evaluate expression of MRP in lymphoma patient samples before and after therapy on the EPOCH regimen. Fifteen paired samples showed no significant difference in MRP expression, and overall, no significant difference in MRP expression was found in the pre- and post-EPOCH groups. Mean MRP levels from samples of untreated lymphoma were also not significantly different from pre- and post-EPOCH levels. No correlation was noted between post- over pre-EPOCH ratios of MDR-1 as previously measured, and MRP as measured in this study, suggesting no common pathway for expression of MDR-1 and MRP in these patients.
Two individual patients showed significant MRP overexpression of 10-fold and 18-fold, and one can speculate that for these patients, MRP may have played a significant role in the refractoriness of their disease. What constitutes clinically relevant overexpression of MRP is, however, not clear. Unlike MDR-1, expression of MRP mRNA at low levels is common in many unselected cell lines, which do not have a drug-resistant phenotype. In selected cell lines, 10-fold to 15-fold increases in MRP expression confer 100-fold to 200-fold resistance to doxorubicin and 30-fold to 150-fold resistance to etoposide.5,12 In cells transfected with an MRP expression vector, a 50% increase in MRP expression resulted in a 50% increase in the IC50 to doxorubicin.8 Because chemotherapy is generally given at close to maximum tolerated doses, even this level of resistance may be clinically significant. The lack of any significant difference in MRP expression between the pretreatment and relapsed groups of patients, however, strongly suggests that MRP was not a major mechanism of resistance for the majority of these patients and that other mechanisms need to be investigated. Untreated patient samples had MRP levels that were similar to those in the pre-EPOCH samples, making it unlikely that the tumors in the pre-EPOCH patient cohort were already selected for MRP overexpression due to prior therapies. As with MDR-1, it is possible that a subset of patients may benefit from modulation of MRP during chemotherapy, however, further studies on how best to define such a subset prospectively and how best to modulate MRP in the clinic will be required.
ACKNOWLEDGMENT
The authors thank the following individuals for their contribution to this project: Kenneth Cowan, Erasmus Schnieder, and Austin Doyle for providing resistant cell lines, Elaine S. Jaffe for reading the patient sample pathology, Beverly Medows for clinical aspects of the project, and Manuel Alvarez for his help with the MRP PCR assay.
Address reprint requests to Susan E. Bates, MD, NIH, NCI, Medicine Branch, Bldg 10, Room 12N226, Bethesda, MD 20892.

This feature is available to Subscribers Only
Sign In or Create an Account Close Modal