Abstract
Although the results of treatment of Hodgkin's disease (HD) have improved considerably in the last decades, the disease remains fatal in a minority of patients. We have recently shown that numbers of activated cytotoxic T cells (CTLs), present in tumor biopsy specimens, differ considerably among individual HD patients. Because CTLs are the major effector cells in elimination of neoplastic cells, we investigated whether the number of activated CTLs is related to the clinical outcome of the individual patient with HD. Activated CTLs present in tumor biopsy specimens of patients with nodular sclerosis or mixed cellularity HD were identified by immunohistochemistry using an antibody directed against granzyme B (GrB), a major constituent of the cytotoxic granules of activated CTLs and natural killer cells, and an antibody directed against CD8. The presence of a high percentage of GrB+ lymphocytes was found to be an unfavorable prognostic marker. The large majority of GrB+ cells were also CD8+, indicating that these cells are activated CTLs. Prognosis was found to decrease with increasing percentages of GrB+ lymphocytes. Optimal discrimination between patients with good and poor prognosis was obtained when the threshold was set at 15% GrB+ cells; 6 of 10 patients with ≥15% GrB+ lymphocytes died as a result of the disease, as compared with 6 of 70 patients with less than 15% GrB+ lymphocytes (P < .0001). In stage-2 patients, the percentage of GrB+ lymphocytes retained its predictive value in a multivariate analysis including histology, sex, age, erythrocyte sedimentation rate, and the presence of B symptoms as covariables. In addition, patients with ≥15% GrB+ lymphocytes had a shortened progression-free survival time (P = .002). We conclude that a high percentage of activated CTLs present in biopsy material of HD patients is a strong indicator for an unfavorable clinical outcome.
THE DIAGNOSIS OF HODGKIN'S disease (HD) is based on the presence of typical Reed-Sternberg (RS) cells and their mononuclear variants, called Hodgkin (H) cells, in an appropriate cellular environment of “reactive” cells.1 Although the presence of the Epstein-Barr virus (EBV) in H-RS cells can be detected in approximately 40% of all cases,2-6 the etiology of HD remains obscure.1,7 8
New treatment possibilities have caused a tremendous improvement in clinical outcome of HD. At present, 70% to 80% of HD patients can be expected to be cured.9 10 Still, in a minority of cases, the disease follows a fatal course. Although some risk factors are well established (advanced stage, high age, histological subtype, increased erythrocyte sedimentation rate [ESR], and the presence of B symptoms), thus far prospective identification of individual patients with poor clinical outcome proved to be difficult.
A defect in cell-mediated immunity, observed in most HD patients,1,11,12 is one of the possible factors involved in tumor progression. Major effector cells in cellular cytotoxicity are cytotoxic T lymphocytes (CTLs) and natural killer cells. On activation, CTLs acquire cytotoxic granules in their cytoplasm. These granules contain, amongst others, the pore-forming protein “perforin” and a family of highly homologous serine proteases, termed granzymes.13,14 A direct involvement of granzyme B (GrB) in target cell DNA fragmentation and apoptosis has been shown.15,16 At present, accurate detection of activated cytotoxic cells is possible using monoclonal antibodies (MoAbs) that react specifically with GrB.17 18
We have recently shown that numbers of activated CTLs (ie, GrB- and CD8-positive lymphocytes) present in tumor biopsy specimens of patients with HD are significantly higher in EBV+ cases than in EBV− cases.19 However, in both the EBV+ and EBV− groups of HD patients, considerable differences in numbers of activated CTLs were detected between individual patients.
In the present study, we have investigated in a selected group of patients with either nodular sclerosis (NS) or mixed cellularity (MC) HD whether these differences in numbers of activated CTLs are related to clinical outcome of the disease and whether the number of activated CTLs is a useful marker in discriminating between patients with good and poor prognosis.
PATIENTS AND METHODS
Patients.Patients with NS or MC HD were selected from the files of the Comprehensive Cancer Centre Amsterdam (diagnosed between 1984 and 1994) and the department of Pathology of the University Hospital Leiden (diagnosed between 1983 and 1991), The Netherlands. If, during this period, a patient presented with recurrent HD, the lymph node biopsy specimen was retrieved on which the initial diagnosis of HD was made. Thus, a positive selection occurred for patients with recurrent HD. Cases were classified according to the Rye classification.20 The extent of the disease at first presentation was determined by clinical examination, full blood count, bone marrow aspirate and biopsy specimen, and radiological imaging of chest and abdomen. Staging laparotomy was not routinely performed. Patient and tumor characteristics are summarized in Table 1. For all patients, the first lymph node on which the diagnosis of HD was made was investigated.
Patient and Tumor Characteristics at Time of First Diagnosis of HD
| . | <15% GrB+ Cells (n = 70) . | ≥15% GrB+ Cells (n = 10) . | P Values* . |
|---|---|---|---|
| Median age in years (range) | 30 (10-78) | 48 (19-75) | ns† |
| Sex (M/F) | 35/35 | 7/3 | ns |
| EBV | |||
| Negative | 44 | 5 | ns |
| Positive | 26 | 5 | |
| Histology | |||
| NS | 60 | 8 | ns |
| MC | 10 | 2 | |
| Stage‡ | |||
| I | 12 | 1 | ns |
| II | 40 | 4 | |
| III | 7 | 2 | |
| IV | 11 | 3 | |
| B symptoms | |||
| No | 39 | 3 | ns |
| Yes | 31 | 7 | |
| Complete remission | 66 | 7 | .01ρ |
| Relapse | 25 | 5 | ns |
| Cause of death | |||
| HD | 6 | 6 | .0001ρ |
| Other | 6 | 0 |
Abbreviation: ns, not significant.
As determined by Pearson χ2 test, unless indicated otherwise.
As determined by Mann Whitney U test.
According to the Ann Arbor classification.43
ρ As determined by Fisher exact test.
Determination of EBV status.The presence of EBV in H-RS cells was determined by RNA in situ hybridization using the abundantly transcribed noncoding EBV small RNAs (EBER1 and EBER2) as targets.21
Detection of activated cytotoxic cells.Activated CTLs present in tumor biopsy specimens were identified by immunohistochemistry using MoAb GrB7 and a MoAb directed against CD8 (a generous gift from Dr D.Y. Mason, John Radcliffe Hospital, Headington, Oxford, UK). MoAb GrB7 was raised against recombinant human granzyme B protein.17 This antibody detects activated cytotoxic lymphocytes (ie, GrB-expressing lymphocytes) in routinely formalin-fixed, paraffin-embedded tissue sections by immunohistochemistry. Detection of GrB+ and CD8+ cells was performed as described previously.18,19 Briefly, deparaffinized 4-μm-thick, formalin-fixed, paraffin-embedded tissue sections were incubated with either GrB7 or anti-CD8 for 1 hour after antigen retrieval by microwave treatment. Bound antibodies were detected using biotinylated secondary antibodies, followed by peroxidase-conjugated streptavidin (DAKO, Glostrup, Denmark). Moreover, to identify the nature of the GrB+ cells, in five cases, double stainings were performed for GrB and CD8 as well as for GrB and HLA-DR (LN3; Novocastra Laboratories Ltd, Newcastle-upon-Tyne, UK) and GrB and T-cell–restricted intracellular antigen-122 (TIA-1; Coulter Corp, Hialeah, FL) using isotype-specific secondary antibodies, as described previously.19
Quantification of the relative numbers of GrB+ lymphocytes, as well as CD8+ lymphocytes in adjacent sections, was performed using a commercially available interactive video overlay-based measuring system (Q-PRODIT; Leica, Cambridge, UK), as described previously,19 which was recently shown to be a highly reliable method to quantify the number of positively stained cells.23 The microscopic image was recorded by the video camera and shown on the computer screen. A total of 50 to 100 fields of vision were systematically randomly selected using an automatic scanning stage controlled by Q-PRODIT. In these fields, a total of 200 to 400 lymphocytes, sampled with a Weibel 6-point test grid (point distance, 50 μm)24 were interactively scored by the observer as positive or negative for either GrB or CD8. A 40× objective was used, which gives a final magnification of 1,200× on the computer screen, and appeared to be the most suitable for this purpose. Numbers of GrB+ and CD8+ lymphocytes were expressed as percentages of all lymphocytes present in a tissue section as judged by morphology.
Analysis of clinical data.For each patient the following characteristics were noted from the medical records: age, sex, clinical stage at presentation, the presence of B symptoms, ESR, therapy, response, the occurrence of relapses, and cause of death. The median follow-up time was 77 months (range, 1 to 150 months). Survival time was measured from time of initial diagnosis until death because of HD or until the end of the follow-up period. Patients who died of causes unrelated to the disease were censored at the time of death. Progression-free survival (PFS) time was measured from time of initial diagnosis until time of disease relapse. Patients who did not enter remission were assigned a PFS time of zero in the analysis.
Statistical methods.Survival curves were constructed with the Kaplan-Meier method. Differences between the curves were analyzed using the log-rank test. Multivariate analysis was performed using the Cox-proportional hazards model25 (enter and remove limits 0.1). Comparisons of means were performed using the Student's t-test or Mann Whitney U test, when appropriate. Qualitative variables were analyzed by Pearson χ2 test or by Fisher exact test, when appropriate. Linear regression analysis was used to determine correlation coefficients. All P values are based on 2-tailed statistical analysis. P values below .05 were considered as significant. All analyses were performed using the SPSS statistical software (SPSS Inc, Chicago, IL).
Data Obtained by Univariate Survival Analysis
| Characteristic . | No. of Cases . | Deaths Caused by HD . | Percentage of Patients Alive After 5 Yr* . | P Values† . |
|---|---|---|---|---|
| % GrB+ cells | ||||
| <15 | 70 | 6 | 90 | <.0001 |
| ≥15 | 10 | 6 | 50 | |
| Stage | ||||
| 1 | 13 | 0 | 100 | .004 |
| 2 | 44 | 5 | 90 | |
| 3 | 9 | 2 | 80 | |
| 4 | 14 | 5 | 60 | |
| B symptoms | ||||
| No | 42 | 1 | >95 | .0006 |
| Yes | 38 | 11 | 70 | |
| Histology | ||||
| NS | 68 | 8 | 90 | .05 |
| MC | 12 | 4 | 65 | |
| EBV status | ||||
| Negative | 49 | 7 | 90 | ns |
| Positive | 31 | 5 | 80 |
Abbreviation: ns, not significant.
As estimated from the Kaplan-meier curves.
As determined by log-rank test.
RESULTS
Clinical characteristics.Patient characteristics ranked according to the percentage of activated CTLs are summarized in Table 1. Most HD patients in this study were between the ages of 20 and 35 years. The majority of patients presented with stage-II disease, with multiple enlarged lymph nodes in the neck region and with frequent mediastinal involvement. EBV was relatively frequently present in MC HD cases as compared with that in NS HD cases (50% and 37%, respectively; not significant). Most patients with EBV+ HD were male (23 of 31 cases, 74%; P = .002).
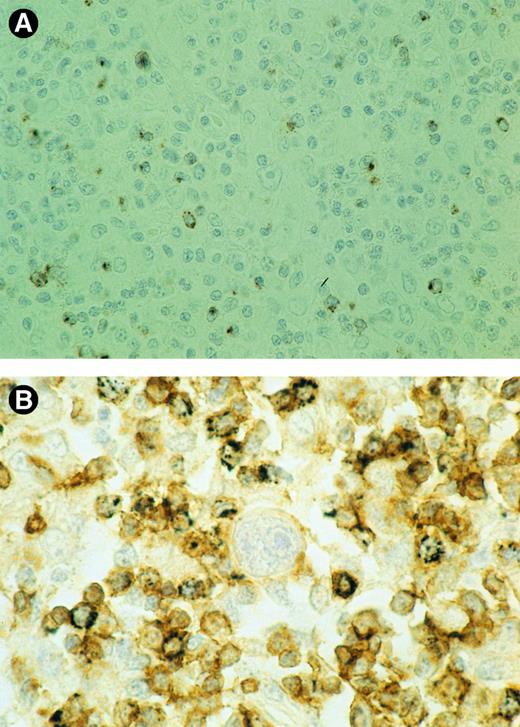
(A) Detection of GrB+ lymphocytes is shown. A biopsy specimen of an HD patient with ≥15% GrB+ cells, presenting with stage-2 disease who died 45 months later as a result of the disease, is shown. Brown cytoplasmic staining indicates GrB expression. (B) Double-staining for CD8 and GrB is shown. The majority of reactive lymphocytes present in the vicinity of the RS cell in the center are CD8+ (brown membranous staining). Black cytoplasmic staining shows that many of these CD8+ cells also express GrB. GrB+/CD8− cells are not observed. Thus, the large majority of GrB+ cells should be considered activated CTLs.
(A) Detection of GrB+ lymphocytes is shown. A biopsy specimen of an HD patient with ≥15% GrB+ cells, presenting with stage-2 disease who died 45 months later as a result of the disease, is shown. Brown cytoplasmic staining indicates GrB expression. (B) Double-staining for CD8 and GrB is shown. The majority of reactive lymphocytes present in the vicinity of the RS cell in the center are CD8+ (brown membranous staining). Black cytoplasmic staining shows that many of these CD8+ cells also express GrB. GrB+/CD8− cells are not observed. Thus, the large majority of GrB+ cells should be considered activated CTLs.
As expected, analysis of overall survival (OS) time showed that stage and the presence of B symptoms were strong prognostic markers (P = .004 and P = .0006, respectively; see Table 2). Moreover, patients with NS HD had a more favorable outcome than did patients with MC HD (P = .05; see Table 2). As determined by Cox regression analysis the disease ran a relatively unfavorable course in elderly patients (P = .0001). In general, these clinical pathological data are in line with data published previously by other groups.7,9,26-28 However, because of our selection procedure as described above, the number of patients with advanced-stage and recurrent HD entered in this study is higher than that expected from other studies.28
Interestingly, PFS time was shorter in patients with EBV+ HD (P = .005). However, this difference in prognosis was not reflected in differences in duration of OS time, which is in agreement with that in a previous report.29
Detection of activated CTLs.In all but 1 case tested, GrB+ lymphocytes were found. GrB+ cells showed a granular cytoplasmic staining pattern, reflecting the granular localization of GrB (see Figs 1A and 1B).18 In some cases, clusters of GrB+ cells were observed; however, in the majority of cases, scattered positive cells were found. Remarkably, GrB+ lymphocytes were found only sporadically in the immediate surrounding of the H-RS cells. Double-staining experiments showed that, in all 5 cases tested, the large majority of GrB+ lymphocytes were also CD8+ (see Fig 1B). Moreover, most GrB+ cells (>80%) were found to express HLA-DR, and all GrB+ cells were also TIA-1+, with TIA+ cells, however, always outnumbering the GrB+ cells (data not shown). These data indicate that most GrB-expressing cells are activated CTLs.
The percentage of GrB+ lymphocytes ranged from less than 5% of all lymphocytes in the majority of cases (n = 37) to ≥15% in a minority of cases (n = 10; see Fig 2). To a certain extent, the number of CD8+ cells correlated with the percentage of GrB+ cells (R = .42). However, in patients with ≥15% GrB+ lymphocytes, the ratio between CD8 and GrB+ cells was significantly lower than that in patients with less than 15% GrB+ cells (see Table 3), indicating that, in cases with ≥15% GrB+ lymphocytes, a significantly higher proportion of CTLs is activated. The mean percentage of GrB+ lymphocytes was significantly higher in EBV+ cases as compared with that in EBV− HD cases (9.5% v 5.9%; P = .02).
The distribution of the percentages of activated CTLs among patients with HD is shown.
The distribution of the percentages of activated CTLs among patients with HD is shown.
Relationship Between Percentages of GrB+ and CD8+ Lymphocytes
| . | <15% GrB+ Cells . | ≥15% GrB+ Cells . | P Values3-150 . |
|---|---|---|---|
| . | (n = 70) . | (n = 10) . | . |
| %CD8+ lymphocytes (SD) | 25 (13) | 40 (15) | .002 |
| CD8/GrB ratio (SD) | 6.9 (6.1) | 2.0 (0.8) | <.001 |
| . | <15% GrB+ Cells . | ≥15% GrB+ Cells . | P Values3-150 . |
|---|---|---|---|
| . | (n = 70) . | (n = 10) . | . |
| %CD8+ lymphocytes (SD) | 25 (13) | 40 (15) | .002 |
| CD8/GrB ratio (SD) | 6.9 (6.1) | 2.0 (0.8) | <.001 |
As determined by Student's t-test.
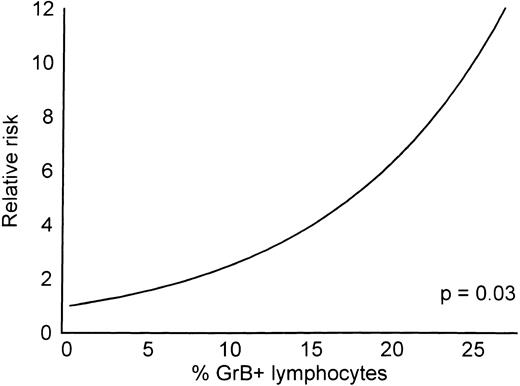
Prognostic value of percentage GrB+ lymphocytes.The influence of percentage GrB+ lymphocytes on OS time was estimated by Cox regression analysis. It appeared that prognosis decreased with increasing percentages of GrB+ lymphocytes (see Fig 3).
This diagram shows the relative risk for a fatal outcome of HD as a function of the percentage GrB+ cells (Cox regression).
This diagram shows the relative risk for a fatal outcome of HD as a function of the percentage GrB+ cells (Cox regression).
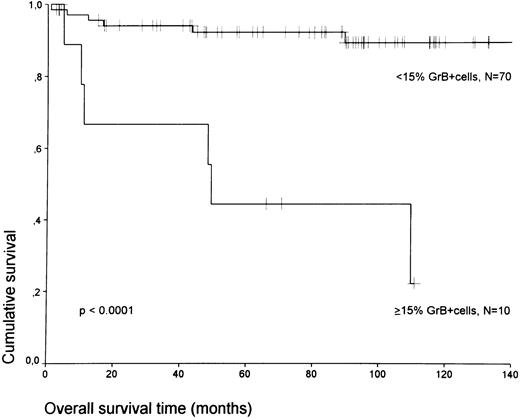
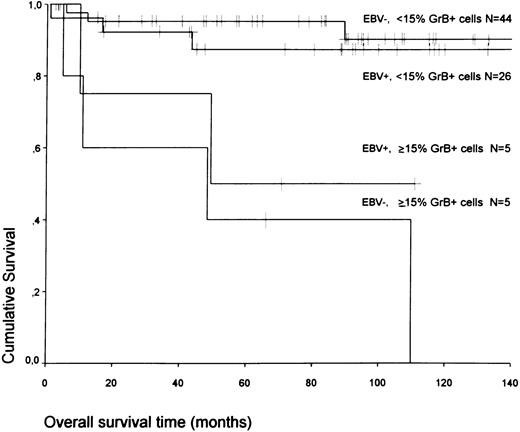
If patients were divided into a group with ≥15% and less than 15% GrB+ lymphocytes (the threshold leading to the lowest P value), the presence of ≥15% GrB+ lymphocytes defined a group of patients with an unfavorable prognosis; 6 of 10 patients with ≥15% GrB+ lymphocytes died during the follow-up period as compared with 6 of 70 patients with less than 15% GrB+ lymphocytes (P < .0001; adjusted for stage, P = .0004; see Fig 4). These results were independent from EBV status. EBV+ and EBV− HD cases with high numbers of GrB+ lymphocytes had an equally poor prognosis (see Fig 5).
A comparison of OS time according to the percentage of GrB+ cells is shown. Tick marks represent censored patients.
A comparison of OS time according to the percentage of GrB+ cells is shown. Tick marks represent censored patients.
A comparison of OS time according to the percentage of GrB+ cells and EBV status is shown.
A comparison of OS time according to the percentage of GrB+ cells and EBV status is shown.
Moreover, the percentage of GrB+ lymphocytes remained a powerful prognostic marker when only patients with stage-2 disease were analyzed (3 of 4 patients with ≥15% GrB+ lymphocytes died versus 2 of 40 patients with less than 15% GrB+ lymphocytes (P < .0001).
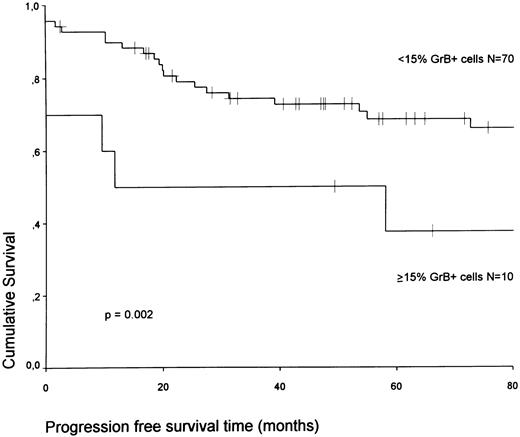
Furthermore, the PFS time was significantly shortened in patients with ≥15% GrB+ lymphocytes as compared with that for patients with less than 15% GrB+ lymphocytes (P = .002; adjusted for stage, P = .05; see Fig 6).
A comparison of PFS time according to the percentage of GrB+ cells is shown.
Multivariate analysis of OS time.The Cox-proportional hazards model was used for multivariate analysis. Variables included were the percentage of GrB+ lymphocytes, ESR, and age (all entered as continuous variable) and histology, sex, stage, the presence of B symptoms, therapy, and EBV status. When all patients were included, only age and the presence of B symptoms were prognostic indicators. If only stage-2 patients were analyzed, the percentage of GrB+ cells was the strongest prognostic marker. Of the other included variables, only the presence of B symptoms gave additional prognostic information in this group of patients.
DISCUSSION
Despite successful treatment of patients with HD, a small percentage of patients responds poorly to therapy and will eventually die as a result of the disease. In this study, we have shown that a high percentage of GrB+ lymphocytes is an additional prognostic marker for these patients, which in stage-2 patients retained its value after adjustment for other potentially prognostic markers including age, sex, ESR, and the presence of B symptoms.
Double-staining procedures showed that, in all 5 cases tested, the large majority of these GrB+ cells were also CD8+, HLA-DR+, and TIA-1+ and should therefore be considered activated CTLs. Although cases with ≥15% GrB+ cells also showed increased numbers of CD8+ cells, the percentage of CD8+ cells was, in our study, of no prognostic value (data not shown). It appeared that, in cases with ≥15% GrB+ lymphocytes, the ratio between percentages of CD8+ and GrB+ cells was significantly lower, indicating that in these patients a high proportion of CTLs was activated, thus showing that not the presence of CTLs but rather their state of activation is of prognostic value.
As also shown previously,19 the percentage of activated CTLs is higher in EBV+ than in EBV− cases of HD (in this study, 9.5% v 5.9%). However, this difference is below the threshold of 15% activated CTLs and, therefore, is too small to have prognostic relevance (see Fig 3). In addition, the prognostic impact of a high percentage of GrB+ lymphocytes was observed both in EBV+ and EBV− cases of HD, indicating that the relationship between a relatively very high percentage of GrB+ lymphocytes (≥15%) and poor prognosis does not depend on EBV status.
CTL-mediated lysis of tumor cells is predominantly achieved by the function of perforins and granzymes.13 14 Therefore, one would expect that HD patients with many activated CTLs at the site of the tumor would run a relatively more favorable clinical course than would patients with low numbers of activated CTLs. However, the data presented indicate that the opposite is true. Apparently, the presence of many activated CTLs in HD patients with poor treatment outcome reflects an inability of activated CTLs to kill the H-RS cells.
It is possible that, under a continuous immunogenic pressure, only those H-RS cells will survive that are best equipped to resist or inhibit CTL-mediated killing. From this point of view, it can be explained that neoplastic cells in HD patients with many activated CTLs at the tumor site are resistant not only to CTL-mediated lysis, but also probably to therapy-induced lysis, resulting in poor treatment outcome.
How does the H-RS cell escape from CTL-mediated killing? A possible mechanism is the downregulation of major histocompatibility complex class I molecules on the membrane of the H-RS cells, preventing recognition of tumor-associated antigens by CTLs. Such a mechanism seems to be involved in some cases of HD,30 especially in EBV− cases.19
In addition, H-RS cells might circumvent CTL killing by inducing a local T-cell anergy. Certain cytokines, among others IL-10 and transforming growth factor-β, are able to inhibit CTL function,31-34 and expression of both IL-10 and transforming growth factor-β has been shown in H-RS cells.35,36 Moreover, it has been shown that EBV-encoded latent membrane protein-1, which is abundantly expressed in H-RS cells in EBV+ HD,6 can induce upregulation of human IL-10.37 This putative local inhibition of CTL function might also explain our observation that activated CTLs are rarely present in the immediate surrounding of the H-RS cells. Interestingly, Frisan et al38 showed that, in a patient with EBV+ HD, CTLs isolated from the tumor lacked EBV-specific cytotoxicity, whereas EBV-specific cytotoxicity was detected in CTLs isolated from the blood of the same patient. This observation is a strong argument in favor of inhibition of CTL function at the site of the tumor and argues against a systemic CTL defect, at least in patients with EBV+ HD. In addition, it was recently shown that patients with HD show a reversible defect in the T-cell deficiency mediated by downregulation of T-cell receptor ζ-chain expression.39 However, it is unlikely that this defective ζ-chain expression can explain the failure of activated CTLs to lyse the H-RS cells because, in principle, a CTL will become activated (and thus express GrB) only after recognition of a specific major histocompatibility complex class I/antigen complex via the T-cell receptor, and subsequent signal transduction requires expression of the ζ chain.40
Furthermore, H-RS cells might resist a CTL attack by neutralizing the function of perforins and granzymes. CTLs are resistant to the pore-forming function of perforins, probably because certain perforin-neutralizing proteins are present on the CTL membranes.41 The presence of such perforin-inhibitory proteins on the membranes of H-RS cells would then render them resistant to CTL-mediated lysis. Such a scenario cannot be excluded because we found evidence that, in some cases of HD, H-RS cells may originate from activated CTLs.42
Whatever the explanation for the CTL escape of H-RS cells might be, we conclude that in HD patients a high number of activated CTLs does not guarantee a good clinical outcome, but rather indicates a particularly aggressive behavior of the disease. The presence of high numbers of activated CTLs is a very strong prognostic marker, even in a multivariate analysis and identifies a small group of HD patients with a highly unfavorable clinical outcome. Future studies are indicated to elucidate the mechanisms involved.
ACKNOWLEDGMENT
We are highly indebted to I. van Sparrenburg (Department of Hematology, University Hospital, Leiden) and O. Dalesio (Medical Oncology, The Netherlands Cancer Institute) for providing clinical data. We are grateful to Drs P.D. Bezemer (Medical Faculty, Free University Hospital, Amsterdam, The Netherlands) and G. Meijer (Department of Pathology, Free University Hospital) for assisting in statistical analysis; to A. Horstman, W. Vos, and D. Dukers (Department of Pathology, Free University Hospital) for technical assistance; and to J.P.A. Baak (Department of Pathology, Free University Hospital) for providing the video overlay system for immunoquantification.
Address reprint requests to J.J. Oudejans, MD, PhD, Department of Pathology, Free University Hospital, De Boelelaan 1117, 1081 HV Amsterdam, The Netherlands.


This feature is available to Subscribers Only
Sign In or Create an Account Close Modal