Abstract
Decomposition of hydrogen peroxide (H2O2 ) at physiological levels was studied in human erythrocytes by means of a recently developed sensitive H2O2 assay. The exponential decay of H2O2 in the presence of purified erythrocyte catalase was followed down to 10−9 mol/L H2O2 at pH 7.4. H2O2 decomposition by purified erythrocyte glutathione peroxidase (GPO) could be directly observed down to 10−7 mol/L H2O2 . No enzyme inhibition was observed at these low H2O2 concentrations. Catalase and GPO activities can be determined separately in a titrated mixture of purified enzymes, which simulates the conditions of H2O2 removal by the erythrocyte. Experiments with fresh human hemolysate allowed us to determine H2O2 decomposition by catalase and GPO using these enzymes in their original quantitative ratio. The different kinetics of these enzymes are shown: H2O2 decomposition by catalase depends linearly on H2O2 concentration, whereas that by GPO becomes saturated at concentrations above 10−6 mol/L H2O2 . Even at very low H2O2 concentrations GPO reaches only approximately 8% of the rate at which catalase simultaneously degrades H2O2 . These data indicate an almost exclusive role for catalase in the removal of H2O2 in normal human erythrocytes.
HYDROGEN PEROXIDE (H2O2 ) and other reactive oxygen species (ROS) are increasingly recognized as toxic intermediates in a wide variety of pathologies.1,2 H2O2 is considered a key metabolite because of its relative high stability, its diffusion,3,4 and its involvement in cell signaling cascades.5-8
For these reasons the erythrocyte has been a traditional target for studying the metabolism of H2O2 . Since the first description of glutathione peroxidase (GPO) in 1957, an intense debate was created on whether catalase or GPO was the primary enzyme in the removal of H2O2 .9-20 A major role of GPO in decomposing H2O2 was especially derived from studies on erythrocytes with a reduced capability to generate nicotinamide adenine dinucleotide phosphate (NADPH).10 Conversely, experiments with acatalasic erythrocytes provided more evidence that catalase is a first line of defense against H2O2 .11 Using a mixture of GPO and catalase in a cell-free system with corresponding activities to erythrocytes, it was previously concluded that catalase accounts for more than 50% of the removal of H2O2 .14 20
Most drawbacks in studies of H2O2 decomposition within erythrocytes stem from the lack of sensitive, direct and nontoxic H2O2 assays. Furthermore, a determination of the activity of GPO and catalase was only possible at high, unphysiological H2O2 concentrations.
We have previously described a sensitive H2O2 assay that is based on the oxidation of luminol (5-dihydro-1,4-phthalazinedione) by NaOCl21-23 and capable of detecting the catalase-mediated decomposition of H2O2 at submicromolar H2O2 concentrations.24,25 This assay had promising potential for the study of other H2O2 metabolizing enzymes.24 26
In this study, we show that the luminol/hypochlorite assay allows the determination of purified erythrocyte GPO activity within the 10−7 mol/L H2O2 range at glutathione concentrations normally found in erythrocytes. Furthermore, it is shown that catalase and GPO activities can be determined individually in a titrated mixture of purified enzymes without influencing the respective activities. The method is applied to fresh human hemolysate using these enzymes in their original quantitative ratio. These direct measurements showed a clear prevalence of catalase even at very low H2O2 concentrations.
MATERIALS AND METHODS
Reagents. Luminol, catalase, GPO, glutathione reductase, reduced glutathione (GSH), hydrogen peroxide, aminotriazole, NADPH, sodium hypochlorite, and sodium azide were from Sigma (Deisenhofen, Germany).
Solutions. Stock solutions of luminol were prepared in 140 mmol/L sodium chloride and 20 mmol/L phosphate buffer and adjusted to pH 7.4. Stock solutions of NaOCl and H2O2 were prepared in water. Their concentrations were determined spectrophotometrically (ε290 = 350 mol/L × cm−1 at pH 12 [Morris27] and ε230 = 74 mol/L × cm−1 [Beers and Sizer28] for NaOCl and H2O2 , respectively). Solutions of NaOCl and H2O2 were freshly prepared daily.
Preparation of human erythrocytes and hemolysates. Fresh human red blood cells were prepared as previously described29 with the following modifications: Blood from healthy volunteers was collected in tubes containing EDTA as anticoagulant. Blood cells were washed at 800g in four volumes of saline solution (Hanks' solution, pH 7.4) and the supernatant, buffy coat, and upper 15% of the packed cells were removed by aspiration after three additional washes. Hemolysates were obtained on hypotonic lysis. Cell number and hemoglobin content were determined with a Celldyn 1700 (Abbott, Maidenhead, UK). The activities of catalase and GPO obtained from these erythrocyte preparations by using conventional assays30,31 matched those reported by others.14
Determination of catalase activity. Catalase activity was determined as previously described.25 This enzyme does not show Michaelis-Menten kinetics. Catalase-mediated H2O2 decomposition follows an exponential rate law and is described by the rate constant k:
where dt is the measured time interval and S1 and S2 are H2O2 concentrations at time t1 and t2 , respectively.25 30 Therefore, catalase activity was expressed as the rate constant k of the exponential decay of H2O2 and calculated by linear regression analysis. Solutions of purified catalase, diluted hemolysates, or cell suspensions were aspirated via a peristaltic pump (4 mL/min). Luminol (10−4 mol/L) and hypochlorite (10−4 mol/L) were continuously added by a perfusion pump (12 mL/h) to the sample solution closed to the light detector, thus monitoring the actual H2O2 concentration in real time. The luminescence integral was determined over 5 seconds. After the addition of H2O2 (10−5 mol/L) to the catalase solution, the breakdown of H2O2 concentration could be assessed. A magnetic stirrer was used to ensure a rapid mixing of the enzyme-substrate solution. In experiments with purified catalase, the enzyme activity in the sample solution is expressed as the exponential rate constant k in s−1 (see preceding equation). In experiments with hemolysate, catalase activity k (s−1) was related to hemoglobin concentration. Therefore, catalase activity is expressed by (s−1 × g−1 × L). Luminescence measurements were performed using a luminometer AutoLumat LB 953 at 37°C (Fa. Berthold, Wildbad, Germany).
RESULTS
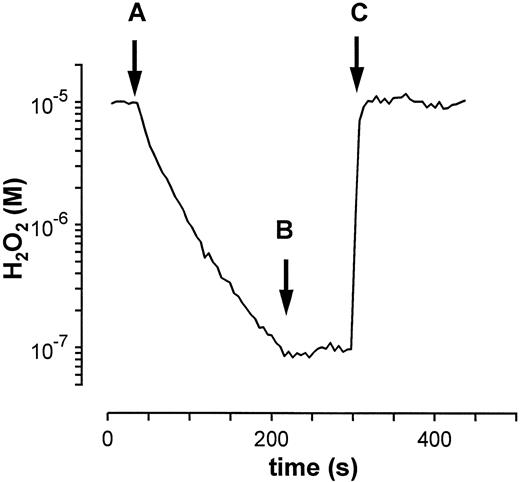
Determination of purified erythrocyte catalase and GPO activity at physiological H2O2 concentrations. Figure 1 shows the decomposition of H2O2 down to nanomolar concentrations after the addition of purified erythrocyte catalase. The decomposition follows an exponential decay (r2 = .997) typical for catalase, because the rate of catalase-mediated H2O2 decomposition depends linearly on H2O2 concentration according to the following equation:
where k′ is the specific catalase activity.30 Catalase is completely inhibited by 1 mmol/L NaN3 as can be shown after a second addition of H2O2 . At these low substrate concentrations no enzyme inactivation or gaseous oxygen release is observed.24 25
Exponential decomposition of H2O2 by purified catalase. After the addition of purified erythrocyte catalase (kcat = 0.033 s−1) at (A) into a solution of H2O2 (10−5 mol/L) the typical exponential decay of H2O2 is observed. The addition of 1 mmol/L NaN3 (B) completely inhibits catalase as shown by a second application of H2O2 (C).
Exponential decomposition of H2O2 by purified catalase. After the addition of purified erythrocyte catalase (kcat = 0.033 s−1) at (A) into a solution of H2O2 (10−5 mol/L) the typical exponential decay of H2O2 is observed. The addition of 1 mmol/L NaN3 (B) completely inhibits catalase as shown by a second application of H2O2 (C).
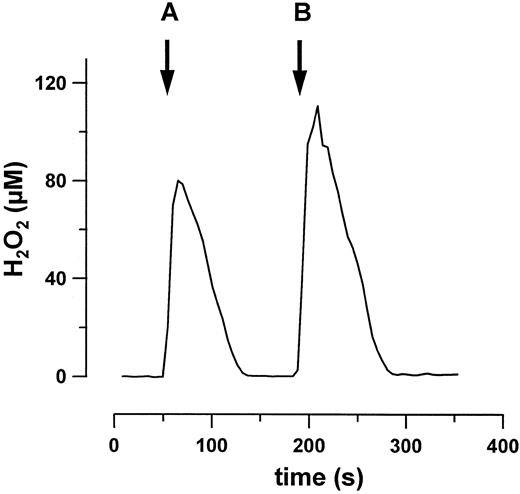
The effect of purified GPO on H2O2 was studied at a GSH concentration of 2 mmol/L, which corresponds to the level found in erythrocytes and which permits determination of submicromolar H2O2 concentrations without significant interference with the assay method. Figure 2 shows that the addition of GPO elicits a rapid degradation of H2O2 . Under saturating conditions, the decomposition follows a zero order kinetics and the degradation rate depends linearly on GPO concentrations (not shown). After a second addition of H2O2 , GPO activity is not altered at these low H2O2 concentrations (Fig 2). Heat inactivation of the enzyme (boiling for 10 minutes) prevented H2O2 degradation. Because GSH concentration requires maintenance at a constant level, we studied the effect of a GSH-regenerating system (NADPH and glutathione reductase31 ) on GPO activity. GSH regeneration did not change GPO-mediated H2O2 degradation. It may be surmised that GSH concentration is not significantly changed under these conditions, most likely because of the high [GSH]/[H2O2 ] ratio (>200). The small decrease in GSH concentration during the reaction does not affect H2O2 decomposition rate. Conversely, experiments performed with [GSH]/[H2O2 ] ratio (<10) are associated with a significant GSH depletion and a consequent decrease in GPO activity (data not shown).
Decomposition of H2O2 by purified erythrocyte GPO (0.02 U/mL). After two additions of H2O2 (A and B) no inhibition of GPO is observed at these low H2O2 concentrations.
Decomposition of H2O2 by purified erythrocyte GPO (0.02 U/mL). After two additions of H2O2 (A and B) no inhibition of GPO is observed at these low H2O2 concentrations.
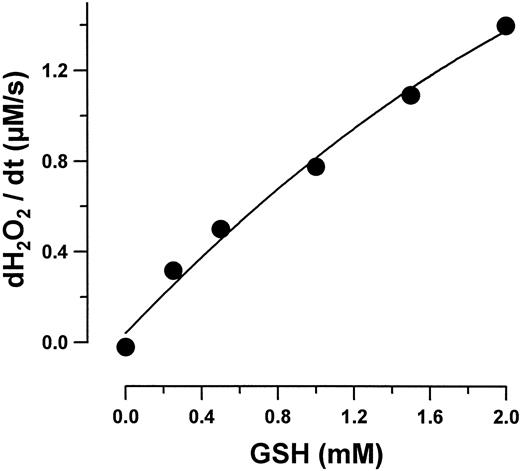
The rate of H2O2 degradation by purified erythrocyte GPO as a function of GSH concentration is shown in Fig 3. The reaction rate depends linearly on GSH concentration within the concentrations examined. These findings are consistent with ping-pong mechanisms, inherent in the GPO activity31-33: 2 GSH + ROOH → GSSG + ROH + H2O.
H2O2 decomposition rate by GPO (0.02 U/mL) as a function of GSH concentration. All values are the means (standard deviation < 8%) of four experiments.
H2O2 decomposition rate by GPO (0.02 U/mL) as a function of GSH concentration. All values are the means (standard deviation < 8%) of four experiments.
In summary, the luminol/hypochlorite assay allows a measurement of H2O2 removal by GPO at submicromolar concentrations of H2O2 and at concentrations of GSH normally found in erythrocytes. Under these conditions, regeneration of glutathione via glutathione reductase is not a requisite condition.
Determination of individual GPO and catalase activities in a mixture of purified enzymes at physiological H2O2 concentrations. Catalase and GPO are present in the erythrocyte cytoplasm. An experimental model was designed to determine the individual catalase and GPO activity in a mixture containing both enzymes and mimicking the ability of a hemolysate or erythrocyte cytoplasm to decompose H2O2 .
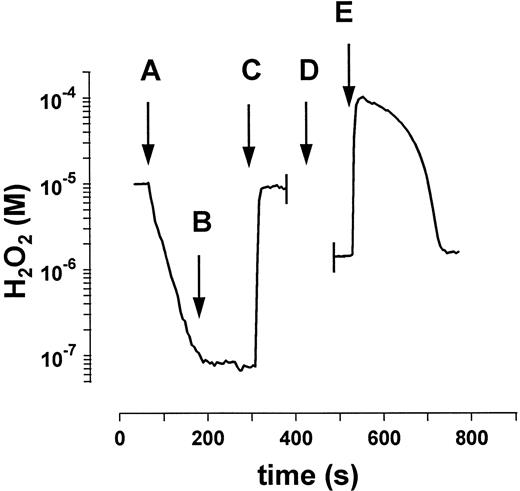
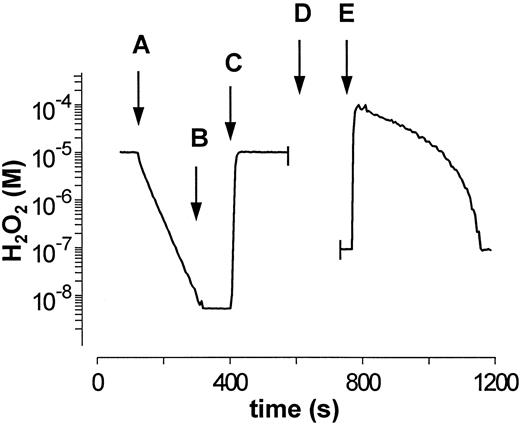
Addition of a mixture of purified GPO and catalase to a 10−5 mol/L H2O2 solution (Fig 4A) resulted in an exponential decay of H2O2 , which was ascribed to catalase activity based on the sensitivity of the signal to NaN3 (Fig 4B) and the subsequent lack of removal of a second addition of H2O2 (Fig 4C). Catalase activity calculated from these data tallies with the activity calculated from data in Fig 1. The addition of 2 mmol/L GSH (Fig 4D) and 10−4 mol/L H2O2 (Fig 4E) to the above mixture permits to evaluated GPO-dependent H2O2 degradation: The rates obtained matched those calculated from data in Fig 2. These experiments were performed with GPO activities higher than those in erythrocytes (with respect to catalase) to improve the kinetic characterization of both enzymes.
Determination of GPO and catalase activity in a mixture of purified enzymes. (A) After the addition of enzyme mixture (GPO, 0.01 U/mL; catalase, kcat = 0.034 s−1) only the catalase-mediated H2O2 decay is observed. (B) Inhibition of catalase by 1 mmol/L NaN3 . (C) Second addition of 10−5 mol/L H2O2 shows complete inhibition of catalase. (D) Addition of 2 mmol/L GSH and recalibration of the measuring system (see Mueller et al25 ). (E) The GPO-mediated decomposition of H2O2 is observed after the addition of 10−4 mol/L H2O2 . These experiments were performed with GPO activities higher than those in erythrocytes with respect to catalase to improve the kinetic characterization of both enzymes.
Determination of GPO and catalase activity in a mixture of purified enzymes. (A) After the addition of enzyme mixture (GPO, 0.01 U/mL; catalase, kcat = 0.034 s−1) only the catalase-mediated H2O2 decay is observed. (B) Inhibition of catalase by 1 mmol/L NaN3 . (C) Second addition of 10−5 mol/L H2O2 shows complete inhibition of catalase. (D) Addition of 2 mmol/L GSH and recalibration of the measuring system (see Mueller et al25 ). (E) The GPO-mediated decomposition of H2O2 is observed after the addition of 10−4 mol/L H2O2 . These experiments were performed with GPO activities higher than those in erythrocytes with respect to catalase to improve the kinetic characterization of both enzymes.
Determination of GPO and catalase activity in human hemolysate. The same procedure is applied as shown in Fig 4. (A) Addition of highly diluted hemolysate (9.4 × 10⁻² g Hb/L). (B) Inhibition of catalase by 1 mmol/L NaN3 . (C) Second addition of 10−5 mol/L H2O2 . (D) Addition of 2 mmol/L GSH and calibration of the measuring system. (E) Addition of 10−4 mol/L H2O2 . A 10-fold higher concentrated hemolysate was used (for D to E) to better characterize the GPO-mediated decomposition of H2O2 .
Determination of GPO and catalase activity in human hemolysate. The same procedure is applied as shown in Fig 4. (A) Addition of highly diluted hemolysate (9.4 × 10⁻² g Hb/L). (B) Inhibition of catalase by 1 mmol/L NaN3 . (C) Second addition of 10−5 mol/L H2O2 . (D) Addition of 2 mmol/L GSH and calibration of the measuring system. (E) Addition of 10−4 mol/L H2O2 . A 10-fold higher concentrated hemolysate was used (for D to E) to better characterize the GPO-mediated decomposition of H2O2 .
Determination of catalase and GPO activity in erythrocytes at physiological H2O2 concentrations. We applied the procedure described previously to fresh human hemolysate to study H2O2 removal in human erythrocytes. Because, in contrast with other cells (eg, hepatocytes), catalase and GPO are freely distributed in the cytoplasm of erythrocytes,34 a hemolysate reflects intracellular conditions in respect to H2O2 decomposition.
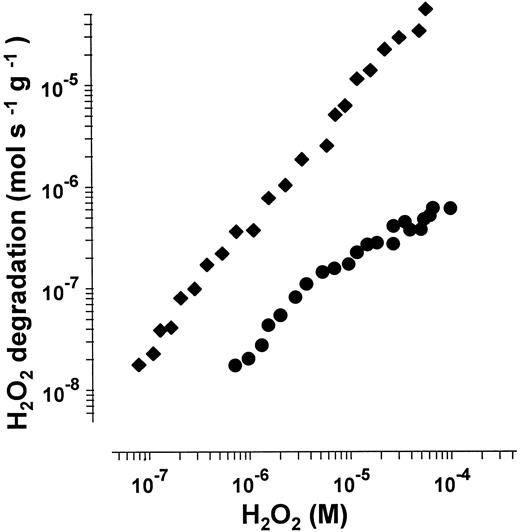
H2O2 decomposition rate of catalase and GPO in human hemolysate as a function of H2O2 concentration. Data are from a representative experiment. Degradation rate of H2O2 is related to gram hemoglobin.
H2O2 decomposition rate of catalase and GPO in human hemolysate as a function of H2O2 concentration. Data are from a representative experiment. Degradation rate of H2O2 is related to gram hemoglobin.
Degradation Rates of H2O2 for Catalase and GPO in Human Erythrocytes at Different H2O2 Concentrations
| H2O2 (mol/L) . | Degradation Rates of H2O2 (mol × s−1 × g−1)* . | kgpo /kcat . | |
|---|---|---|---|
| . | Catalase . | GPO . | . |
| 10−7 | 4.5 × 10⁻⁸ ± 1.1 × 10⁻⁸ | 3.9 × 10⁻⁹ ± 0.8 × 10⁻⁹ | 7.8% |
| 10−6 | 5.3 × 10⁻⁷ ± 0.7 × 10⁻⁷ | 4.0 × 10⁻⁸ ± 1.7 × 10⁻⁸ | 8.0% |
| 10−5 | 4.9 × 10⁻⁶ ± 0.6 × 10⁻⁶ | 1.5 × 10⁻⁷ ± 0.5 × 10⁻⁷ | 3.0% |
| 10−4 | 4.4 × 10⁻⁵ ± 0.9 × 10⁻⁵ | 5.0 × 10⁻⁷ ± 0.9 × 10⁻⁷ | 1.0% |
Degradation rates are related to gram hemoglobin (g−1). Means ± standard deviations were calculated from samples of five healthy volunteers.
H2O2 removal by fresh human hemolysate is shown in Fig 5: After the addition of H2O2 (Fig 5A), an exponential decay of H2O2 is observed (r2 = .995) ascribed to catalase activity as inferred by the effect of NaN3 (Fig 5B) and the lack of H2O2 consumption when added subsequently (Fig 5C). Of note, negligible GSH levels were present in this highly diluted hemolysate (1/1,000) preventing any detectable GPO activity. Further addition of 2 mmol/L GSH and H2O2 (as described for Fig 4) permitted evaluation of GPO activity, which exhibited a kinetic pattern different from catalase. This degradation pattern was similar to that observed with purified GPO. The H2O2 degradation rate depended linearly on GSH concentration (as shown in Fig 3 for the purified enzyme).
The H2O2 degradation rate of catalase and GPO was plotted against H2O2 concentration (Fig 6). These data showed a prevalence of catalase at low H2O2 concentrations. GPO reaches only approximately 8% of the rate at which catalase simultaneously decomposes H2O2 . H2O2 degradation by catalase depends linearly on H2O2 concentration, whereas GPO becomes saturated at concentrations of H2O2 greater than 10−6 mol/L. At H2O2 concentrations above 10−5 mol/L, catalase contributes almost exclusively to the overall turnover of H2O2 . The relative activities of catalase and GPO at different H2O2 concentrations are listed in Table 1. In H2O2 concentrations less than 10−6 mol/L, GPO becomes unsaturated: Under these conditions, the decomposition rate of H2O2 depends linearly on H2O2 concentration. At 2 mmol/L GSH, the KM of GPO for H2O2 is calculated as 2 × 10⁻⁵ mol/L H2O2 in agreement with previous reports.14 35
DISCUSSION
H2O2 degradation in erythrocytes has been studied for several decades in connection with the high oxygen turnover of these cells and the toxic properties of ROS derived from H2O2 metabolism.11,36,37 Interest in this area was renewed by articles describing a role for H2O2 in signal transduction.5 38
In the present study, we have determined both catalase and GPO activities in hemolysate at physiological H2O2 concentrations by using a novel H2O2 assay.23,25 Because erythrocyte catalase and GPO are apparently not compartmentalized,34 the studies performed on hemolysates may reflect a situation similar to that in the erythrocyte. The luminol/hypochlorite method may be used to determine H2O2 degradation by GPO in the 10−7 mol/L H2O2 range and at GSH concentrations normally found in erythrocytes.
The assumption that the glutathione-GPO system has greater affinity for its substrate led both Keilin and Hartree39 and Cohen and Hochstein10 to suggest that at H2O2 concentrations below 10−7 mol/L, catalase played almost no role in H2O2 detoxification. However, the studies herein indicated a clear predominance of catalase in removing H2O2 and they provided understanding of the increasing data underlying the function of catalase in erythrocytes.11,13,14,17-19,34 Considering these and the data herein, catalase needs to be regarded as the major H2O2 -decomposing enzyme in normal erythrocytes. It decomposes H2O2 without generation of free radicals by minimizing one-electron-transfers. Hence, a protective role against free radicals may be the main physiological function in these cells. The existence of healthy acatalasic individuals cannot serve as an argument against the physiological importance of this enzyme. Most patients do not show a real “acatalasemia” but a hypocatalasemia.40,41 Additionally, Japanese acatalasic patients show evidence for increased oxidative damage, and Swiss acatalasic variants show, at least in vitro, an enhanced sensitivity to a number of H2O2 -generating agents.40 41 According to our data, a remaining activity of 1% catalase would still contribute largely to the overall H2O2 removal (approximately 50% at 10−5 mol/L H2O2 ).
Otherwise, the hexosemonophosphate shunt in erythrocytes lacking detectable catalase activity is significantly increased because of glutathione use via GPO.11 Because the steady-state levels of H2O2 in tissues are considered to be between 10−10 and 10−7 mol/L42 and were recently estimated to be approximately 2 × 10⁻¹⁰ mol/L H2O2 in erythrocytes,29 GPO is not supposed to be saturated under these conditions. It may be surmised that GPO can undertake a substantial part of catalase activity in acatalasic erythrocytes. The contribution of hemoglobin to H2O2 degradation is minimal because of the low reaction rates.29 34 A major function of GPO in normal erythrocytes may be the disposal of organic peroxides and the maintenance of protein thiols in their reduced state.
It is worth mentioning that some discrepancies in the literature may be bridged by considering effects of azide and cyanide on erythrocyte metabolic pathways other than a unique inhibition of catalase.11 Additionally, it was long thought that GPO was the sole H2O2 -removing enzyme in erythrocytes depending on NADPH. The discovery of the role of catalase-bound NADPH unified the concept of two different mechanisms for disposing of H2O2 (catalase and the glutathione reductase/peroxidase pathway) by showing that both mechanisms are dependent on NADPH.12 18
In summary, these data strengthen the notion that H2O2 removal in normal erythrocytes is mainly the domain of catalase. On a methodological note, the luminol/hypochlorite assay may be a useful tool to study H2O2 degradation in other cells and tissues, which is a notion supported by previous preliminary studies with hepatocytes.43
ACKNOWLEDGMENT
We are indebted to Dr E. Cadenas of the University of Southern California, Los Angeles, CA, for critical reading of the manuscript.
Supported by grants from the Deutsche Forschungsgemeinschaft STR 216/6-1.
Address reprint requests to Sebastian Mueller, MD, Department of Molecular Pharmacology and Toxicology, School of Pharmacy, University of Southern California, 1985 Zonal Ave, Los Angeles, CA 90033.

This feature is available to Subscribers Only
Sign In or Create an Account Close Modal