Abstract
We show here that αG-Phila.2βC2 has an increased rate of crystal nucleation compared to α2 βC2 (HbC). We conclude from this finding that position α68, the mutation site of αG-Phila.2 β2 (HbGPhiladelphia), is a contact site in the crystal of HbC. In addition, that HbS enhances HbC crystallization (additive to the effect of αG-Phila, as shown here) and that αG-Phila. inhibits polymerization of HbS are pathogenically relevant previously known facts. All of these findings help explain the phenotype of an individual simultaneously heterozygous for the βS, βC, and the αG-Phila. genes (SCα-G Philadelphia disease). This disease is characterized by a mild clinical course, abundant circulating intraerythrocytic crystals, and increased folded red cells. This phenotype seems to be the result of increased crystallization and decreased polymerization brought about by the opposite effects of the gene product of the αG-Phila. gene on the βC and βS gene products. Some of the intraerythrocytic crystals in this syndrome are unusually long and thin, resembling sugar canes, unlike those seen in SC disease. The mild clinical course associated with increased crystallization implies that, in SC disease, polymerization of HbS is pathogenically more important than the crystallization induced by βC chains. The SCα-G Philadelphia disease is an example of multiple hemoglobin chain interactions (epistatic effect among globin genes) creating a unique phenotype.
HBC IS A COMMONLY encountered abnormal hemoglobin (Hb) in the United States.1 HbC (β6 Glu → Lys), like HbS (β6 Glu → Val) has its mutation site at β6, but the consequences of the specific substitutions are very different. In red blood cells, deoxygenated HbS forms polymers, whereas oxyHbC forms intraerythrocytic crystals.2-4
In contrast to HbS,5 relatively few investigations have focused on mechanisms of HbC crystallization6,7 and their impact on the pathogenic consequences of HbC containing red cells.8 In vitro batch crystallization techniques that measure rate of nucleation have been used to identify contact sites by studying the effects of hemoglobins known to coexist with HbC in the red cell. Once the crystal structure is solved, batch crystallization methods will still remain important to detect dynamic solution-active contact sites that may not exist in the static structure. The crystal lattice might constrain the structure to a particular conformational state, different from the one found predominantly in solution. For example, the nonhelical N-terminal portions of the β chains have multiple spatial positions of side chains, so their average location cannot be derived from diffraction patterns. HbS is a case in point.9-11
The concentrated phosphate buffer method6 has proven useful for studying the effects of variant hemoglobins coexisting with HbC in the red cell upon the oxy HbC crystallization process.12-18 For example, it was shown that HbF inhibits HbC crystallization due, at least in part, to interactions with residue γ87.17 HbS accelerates HbC crystallization,15 a finding compatible with the demonstration of circulating oxygenated intraerythrocytic crystals in red cells of SC patients (compound heterozygotes for hemoglobins S and C).13
Hb Korle-Bu (β73 Asp → Asn) accelerates HbC crystallization and the compound heterozygote of these two hemoglobins results in a more severe phenotype,16 characterized by a mild microcytic hemolytic syndrome and in vitro acceleration of crystal formation. Precrystal hemoglobin structures convert rapidly into cubic-like crystals in contrast to the typical tetragonal crystal structure of CC, SC, and AC. We conclude from these studies that β87 and β73 are contact sites of the oxy crystal.
Patients who are compound heterozygotes of HbC with hemoglobins that decrease the crystallization kinetics, exhibit little or no pathology. Studies of two HbC compound heterozygotes, HbC/Hb N-Baltimore (β95 Lys → Glu) and HbC/Hb Riyadh (β120 Lys → Asn), show that β120 and β95 are additional contact sites in the crystal.18 Hb Riyadh (β120 Lys → Asn), inhibits the in vitro crystallization of HbC explaining the lack of overt pathology in the compound heterozygotes (except for microcytosis); in contrast Hb N-Baltimore accelerates the crystallization of HbC, and contributes to abnormal red cell morphology.
We report here on the molecular interaction between the gene product of the αG-Phila. gene and the gene products of the βC and the βS genes, and the implications of these findings for understanding the phenotypic expression of SC α-G Philadelphia.
MATERIALS AND METHODS
Hematological determinations.Patients were followed in the Hematology Clinic of Jacobi Medical Center, and hematological indices were determined by Coulter Counter S + IV (Coulter, Hialeah, FL). Measurement of LDH, bilirubin, SGOT, and ferritin were performed in the Hospital Special Chemistry laboratory by standard methods. The reticulocyte determinations were performed by a single observer as previously described.13
Description and photographs of the circulating crystals were made from blood smears obtained from fingerstick blood, which is critical, because anticoagulated blood, particularly if stored for hours or days, becomes deoxygenated and the oxy crystals melt, due to the different crystal habits of oxy and deoxy HbC.12 19
Hemoglobin analysis.Red cells were separated from whole blood, washed three times in saline, and hemolysates was prepared by the freeze-thaw method. Analysis of the components in hemolysate was done by isoelectric focusing followed by densitometry. HPLC (a Vydac 300Å C4 column and developed by a acetonitrile/H2O)/trifluoroacetic acid (TFA) gradient)20 and cellulose acetate were used as confirmatory techniques. All the Hbs were purified and separated on a CM-52 (Whatman Laboratory Div, Maidstone, UK) cellulose cation exchanger using a gradient of 0.01 mol/L sodium phosphate (pH 6.8) to 0.05 mol/L sodium phosphate (pH 8.3). Purity was verified by isoelectric focusing and cellulose-acetate electrophoresis. Hb oxidation (met Hb content) was insignificant as determined spectrophotometrically. The purified Hbs were concentrated using an Amicon concentrator (Amicon Inc, Beverly, MA) and stored in liquid nitrogen.
Density gradient.The density gradient screening of red cells was performed by Percoll/Larex gradients. Percoll (colloidal silica coated with polyvinylpyrrolidone; Pharmacia, Uppsala, Sweden) and Larex (arabinogalactan polysaccharide; Larex International, Duluth, MN) gradients were formed from a mixture of Percoll and Larex as described.13 The densities in grams per deciliter used to define SC fractions were: SC1, less than 1.081; SC2, between 1.081 and 1.087; SC3 between 1.087 and 1.097; SC4 greater than 1.097.
Conditions and measurements of nucleation kinetics of HbC crystallization.Oxy HbC crystals were generated by incubating purified Hbs (2 g/100 mL) in concentrated (1.8 mol/L) potassium phosphate buffer, pH 7.4, at 30°C.6 Aliquots obtained after specific time intervals were removed from the incubating solution, and the nucleation kinetics were followed by counting the number of Hb crystals formed using a Zeiss microscope (Carl Zeiss Inc, Thornwood , NY) with the aid of a hemacytometer as previously described.17 It is assumed that each detectable crystal is the product of one successful nucleation event. This is a reasonable assumption because the crystals seen under the microscope in our experiments are well separated.
Determination of α-thalassemia.Genomic DNA is digested with BamH1 and the fragments are separated by a gel electrophoresis. After the DNA has been transferred to a nitrocellulose membrane, human α-LCR probe is applied.21
RESULTS
Hematological features of a case of SC α-G Philadelphia disease and its pedigree.The propositus was a 24-year-old male born in the West Indies and of West African descent, who had a mild clinical syndrome characterized by 3 to 4 low-intensity sickle painful crises per year until his late teens. He had very infrequent crises during the past several years, the last precipitated by intense exertion. His spleen was not palpable, but was at the upper limit of normal in size by computerized tomography (CT) scan. Hematological analysis (Table 1) revealed mild microcytic anemia, normal liver enzymes, mildly elevated lactate dehydrogenase (LDH), 3.5 mg/dL total bilirubin with a direct fraction of 0.6. Gilbert's disease was detected by the examination of the TATAA box 5′ of the bilirubin UGT gene. The results showed homozygosity for a 8 nt instead of 7 nt TATAA box, which is characteristic of Gilbert's disease (courtesy of Dr J. Roy-Chowdhury, Liver Center, Albert Einstein College of Medicine), explaining the higher than expected indirect hyperbilirubinemia. The ferritin level of 195 is normal among male African-Americans.22 His reticulocyte count in the steady state had an average of 6.9%.
Hematological and Clinical Chemistry Results
| . | Propositus Hb G Phila/SC . | Mother Hb G Phila/CA . | Sister Hb G Phila/CA . | Brother Hb G Phila/SA . |
|---|---|---|---|---|
| Hb g/dL | 11.6 | 12.1 | 13.1 | 13.9 |
| RBC μL | 4.39 | 4.98 | 5.16 | 5.23 |
| MCV fL | 80 | 74 | 77 | 81 |
| RDW % | 16 | 13.5 | 12.1 | 12.9 |
| Reticulocytes % | 6.9 | 4.5 | 2.0 | 2.3 |
| Bilirubin T/D mg/dL | 3.5/0.6 | 0.5/0.1 | 0.6/0.2 | 0.8/0.2 |
| LDH U/L | 202 | 95 | 93 | 116 |
| SGOT U/L | 20 | 13 | 13 | 16 |
| Ferritin μg/L | 195 | 431 | — | — |
Isoelectric focusing followed by densitometry showed that the propositus had the following composition of hemoglobins in his red cells: αG-Phila.βC2 = 18%; αG-Phila.2βS2 = 18%; α2 βS2 = 32%; α2 βC2 = 32%. The mother had microcytosis but no anemia, had no symptoms, and her red cells contained the following hemoglobins: αG-Phila.2βC2 = 17.4%α2 βC2 = 28.7%; αG-Phila.2β2 = 24.4%; α2 β2 = 29.5%. The father had sickle trait with 37% HbS. The four members of this pedigree had an α-haplotype for α-gene cluster of the following structure: −α/αα (silent carrier state for α-thalassemia). This was not surprising because the G Philadelphia gene present in 3 members of the pedigree is cis to −α deletion in African-Americans.23
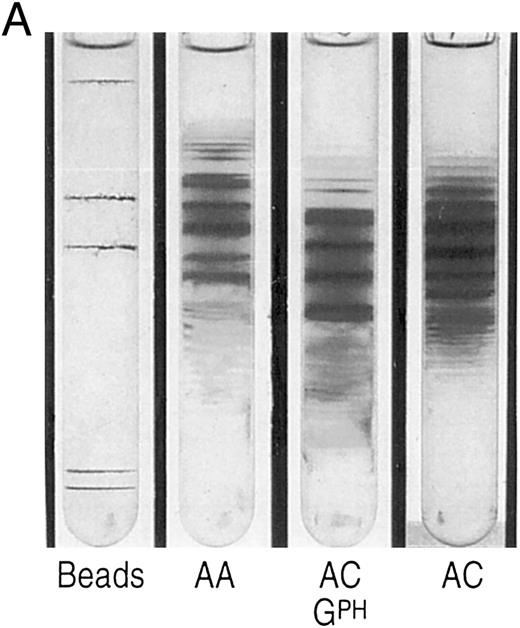
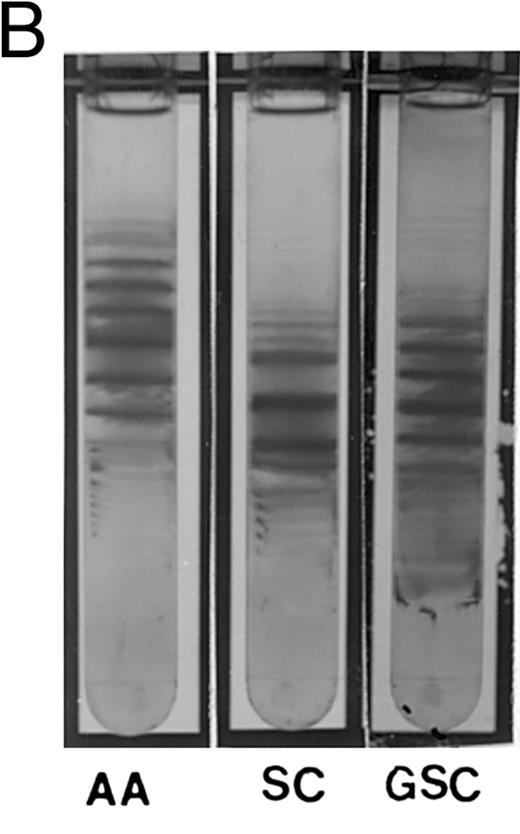
The propositus' red cell density gradient was typical of SC disease,24 but with a larger than usual proportion of cells in the densest fraction (SC4). In this fraction, close to 4% of the cells contained crystals, a much higher percentage than in SC disease patients,13 all the more notable considering that most SC patients with a concomitant silent carrier state for α-thalassemia, exhibit few, if any, circulating intraerythrocytic crystals.13 Analysis of density fractions revealed that reticulocytes were present in the densest fractions, as in SC and CC disease, both by percent and in absolute numbers. The mother of the propositus, a double heterozygote for αG-Phila.2 and βC, had more dense cells than is characteristic of AC carriers (Fig 1A), but no crystals were observed, suggesting that spleen function was sufficiently intact to remove them from circulation, as observed in AC trait.24 The propositus density distribution is different from SC, with more very dense cells (Fig 1B).
(A) Percoll-Larex gradient of an AA control, and AC control, and the mother of the propositus AC α-G-Philadelphia. Density marker beads are included as reference. Notice the significant increase of denser cells in the blood of the propositus' mother compared to that of a C trait individual without α-G-Philadelphia. (B) Comparison of AA, SC and the propositus (SC α-G-Philadelphia). Notice increase in the very dense cells (crystal containing) as well as more light cells.
(A) Percoll-Larex gradient of an AA control, and AC control, and the mother of the propositus AC α-G-Philadelphia. Density marker beads are included as reference. Notice the significant increase of denser cells in the blood of the propositus' mother compared to that of a C trait individual without α-G-Philadelphia. (B) Comparison of AA, SC and the propositus (SC α-G-Philadelphia). Notice increase in the very dense cells (crystal containing) as well as more light cells.
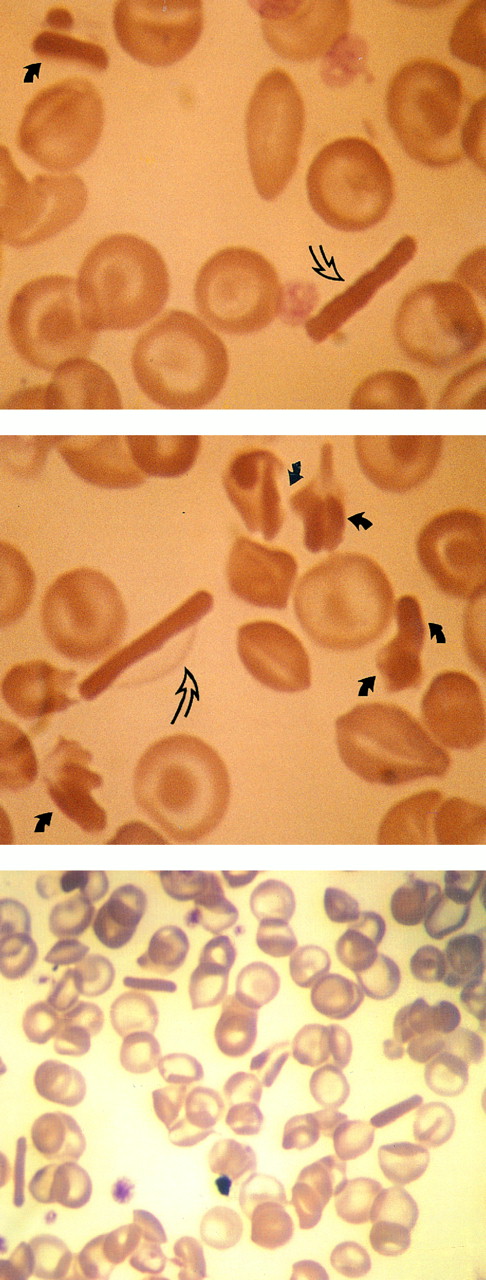
The morphology of the crystals was particularly striking, with exceptionally long SC-like crystals, often twice as long as the diameter of a normal red cell (Fig 2). The entire Hb content of the red cell had been recruited to the crystal (as in CC disease), while the membrane remained intact. Once the membrane ruptured, the crystal appeared to lose surface material at regular intervals along its length, giving the crystal a serrated appearance, resembling a sugar cane. Also, many extracellular block-like clusters, probably the remains of crystals, could be found.
Smears from fingerstick collected blood (propositus). Upper panel: low power magnification, 3 “sugar cane” crystals are observed in one field. Middle and lower panels: full arrows point to intraerythrocytic tetragonal crystals. In the middle panel, the crystal is contained within a red cell membrane (open arrows) and all its Hb content has been included in the crystal. The lower panel shows the crystal without the red cell membrane.
Smears from fingerstick collected blood (propositus). Upper panel: low power magnification, 3 “sugar cane” crystals are observed in one field. Middle and lower panels: full arrows point to intraerythrocytic tetragonal crystals. In the middle panel, the crystal is contained within a red cell membrane (open arrows) and all its Hb content has been included in the crystal. The lower panel shows the crystal without the red cell membrane.
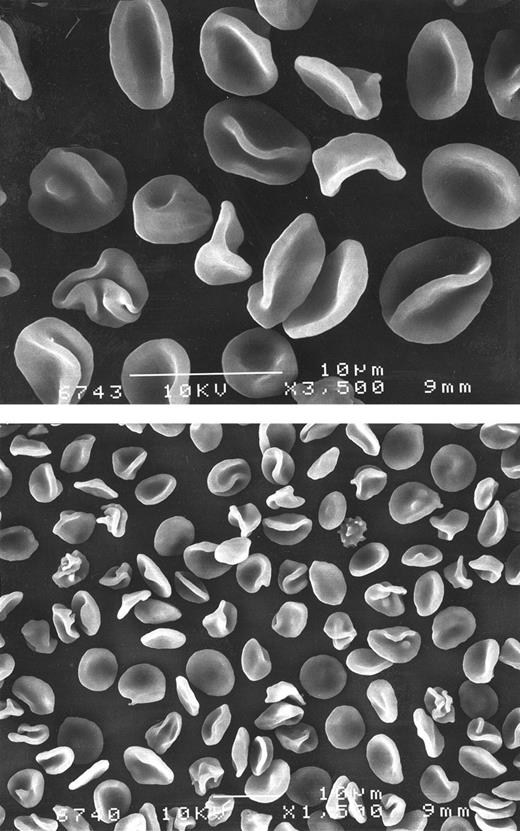
Scanning electron microscopy revealed that red cells of the propositus exhibited a high degree of deformation in whole blood, mostly folding of the membrane. This was reminiscent of CC disease rather than SC disease,13 where folded cells are less frequent and confined primarily to the SC4 density fraction (Fig 3).
Scanning microscopy in the propositus whole blood. Upper panel: shows abundant folded cells and stomatocytes at 3,500 magnification. Lower panel: corresponds to the same sample shown in upper panel. Original magnification × 1,500.
Scanning microscopy in the propositus whole blood. Upper panel: shows abundant folded cells and stomatocytes at 3,500 magnification. Lower panel: corresponds to the same sample shown in upper panel. Original magnification × 1,500.
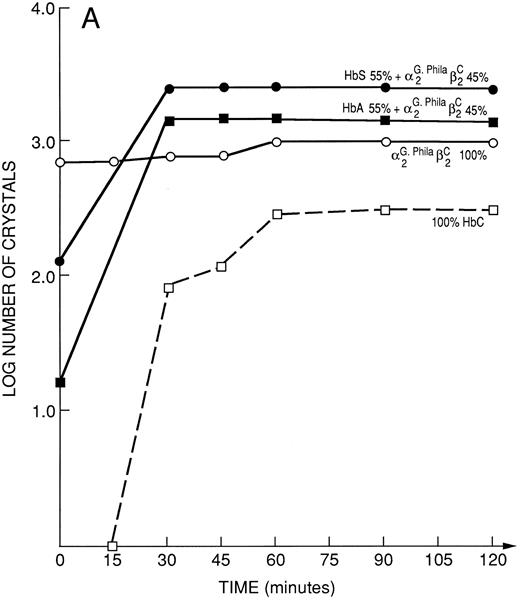
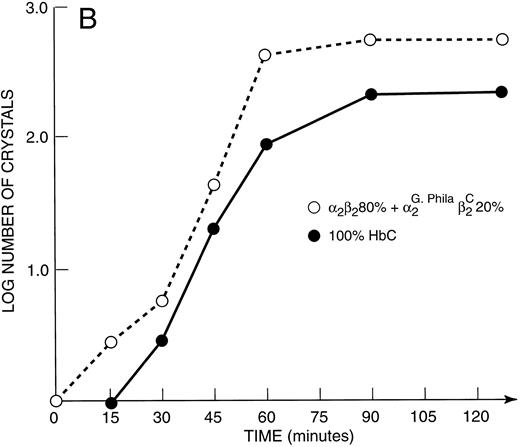
Kinetics of crystal nucleation in hemoglobins, binary Hb mixtures and natural hemolysates.Under the conditions employed, a solution of 100% αG-Phila.2βC2 crystallized completely within the dead time (period in which experimental observations are not possible) of our method. In contrast, with 100% HbC, it took between 15 and 30 minutes to begin to observe the product of a nucleation event, a distinct crystal (Fig 4A). Even a mixture of 80% HbA and 20% αG-Phila.2βC2 began to crystallize earlier than 100% HbC (Fig 4B).
(A) Kinetic curves of the log number of crystals (nucleation rate) formed in various mixtures of Hbs as depicted in the figure. They include 100% HbC; 55% HbA + 45% αG-Phila.2βC2; 55% HbS + 45% αG-Phila.2βC2; and 100% αG Phila.2βC2. (B) Kinetic curves of the log number of crystals (nucleation rate) formed in a mixture of 20% αG-Phila.2βC2 + 80% α2β2 (HbA). The other solution is 100% α2βC2 (HbC).
(A) Kinetic curves of the log number of crystals (nucleation rate) formed in various mixtures of Hbs as depicted in the figure. They include 100% HbC; 55% HbA + 45% αG-Phila.2βC2; 55% HbS + 45% αG-Phila.2βC2; and 100% αG Phila.2βC2. (B) Kinetic curves of the log number of crystals (nucleation rate) formed in a mixture of 20% αG-Phila.2βC2 + 80% α2β2 (HbA). The other solution is 100% α2βC2 (HbC).
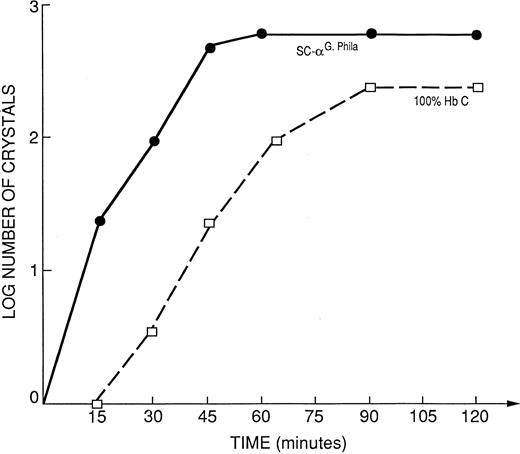
Kinetic curves of the log number of crystals (nucleation rate) form the propositus' hemolysate SC-αG-Phila. = 32% HbS; 32% HbC; 18% αG-Phila.βC; 18% αG-Phila.βS, compared to 100% HbC.
Kinetic curves of the log number of crystals (nucleation rate) form the propositus' hemolysate SC-αG-Phila. = 32% HbS; 32% HbC; 18% αG-Phila.βC; 18% αG-Phila.βS, compared to 100% HbC.
Mixtures of 55% HbS and 45% αG-Phila.2βC2 have almost twice the number of crystals at time zero (dead time of the procedure) as those in an identical mixture of HbA and αG-Phila.2βC2 , showing that HbS accelerates the crystal nucleation of αG-Phila.2βC2 (Fig 4A).
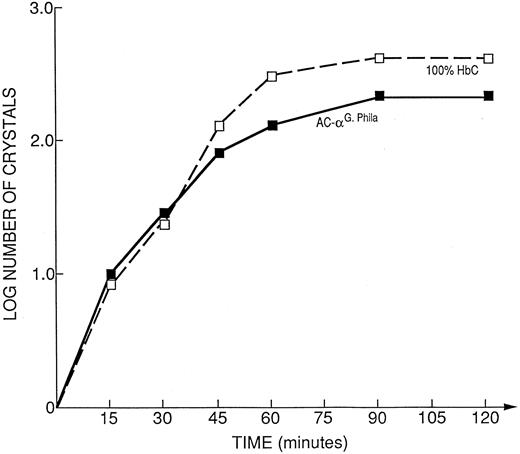
The native hemolysate of the propositus crystallized faster than 100% HbC, as shown in Fig 5. The mother's hemolysate, that contained only 28.7% HbC and 17.4% αG-Phila.2βC2 , showed kinetics of crystallization almost identical to 100% HbC. In other words 17.4% αG-Phila.2βC2 behaved like 72% of HbC (Fig 6), doubling the crystallization rate.
Kinetic curves of the log number of crystals (nucleation rate) from the hemolysate of the propositus' mother (AC-α-G Philadelphia = 17.4% αG-Phila.βC; 28.7% HbC; 24.4% αG-Phila.βA; 29.5% αAβA), compared to 100% HbC.
Kinetic curves of the log number of crystals (nucleation rate) from the hemolysate of the propositus' mother (AC-α-G Philadelphia = 17.4% αG-Phila.βC; 28.7% HbC; 24.4% αG-Phila.βA; 29.5% αAβA), compared to 100% HbC.
The kinetics of in vitro crystal nucleation are: αG-Phila.2βC2 > > SC α-G Philadelphia (propositus hemolysate) > 100% HbC > > > AC α-G Philadelphia (mother's hemolysate). These results show the accelerating effect of the presence of the αG-Phila. chain on crystal nucleation of αG-Phila.2βC2 when coexisting with HbS.
DISCUSSION
The data presented here demonstrate that αG-Phila. (α68 Asn → Lys) promotes the in vitro and in vivo intraerythrocytic crystallization of oxy HbC, so that α68 has to be added to the list of contact sites in the oxyHbC crystal. Based on similar batch crystallization experiments, the other established contact sites in the oxyHbC crystals are β6, β73, β87, β95, and β120.12-18 All of these sites also appear in the contact sites of the deoxyHbS polymer, and α68 is no exception, although it is the first α-chain site implicated in the oxyHbC crystal.
HbS accelerates HbC crystallization (previously known14 ), and as shown here, in an additive fashion with αG-Phila., allowing for the interpretation of a case of SC α-G Philadelphia disease: The propositus has a mild clinical phenotype but with abundant circulating crystal-containing red cells and some free crystals. Some crystals exhibited unusual morphology (discussed below).
The genotype present in our propositus (SC α-G Philadelphia) has been described previously,25 but the phenotype was not fully delineated, nor was the interaction between the Hb components analyzed. The studies presented here seem to indicate that this phenotype is the product of: (1) a decrease in sickling tendencies induced by α-G Philadelphia, based on molecular studies demonstrating that this Hb inhibits the polymerization of HbS26 and (2) abundant crystal formation resulting from the acceleration of crystallization induced by both αG-Phila. and HbS.
The fact that the clinical severity is mild in the propositus, despite increased intraerythrocytic circulating crystals, attests to the relative low pathogenic potential of crystallization. This can be explained by the fact that these circulating crystals, known to be in the oxy state,12 most likely melt before entering the microcirculation due to the different unit cell of the crystals of deoxyHbC compared to oxyHbC. The lack of vasocclusive episodes in splenectomized CC patients with circulating intraerythrocytic crystals strongly supports this interpretation.12 The fact that the propositus has a normal size spleen, in spite of the abundance of circulating intraerythrocytic crystals, is also in keeping with this analysis.
The fact that the propositus' mother (AC α-G Philadelphia) has increased dense cells, a pattern distinctly different than normal AC, suggests that αG-Phila.2βC2 might promote red cell dehydration. The increased morphologic abnormality of red cells, with abundant folded cells reminiscent of the CC phenotype,13 is related to this phenomenon. This raises the possibility that αG-Phila.2βC2 interacts differently with the red cell membrane and its transporters (for example, K:Cl cotransport, and Ca++-stimulated K+ efflux and Band 3).27-29
The peculiar shape of some of the intraerythrocytic and extracellular crystals observed in the fingerstick blood of the propositus is of note. Although many crystals were tetragonal, as previously observed,3 a significant number were very long and thin, the length exceeding the width about eightfold. Hence, the pattern of crystal growth in the red cell favors one dimension resulting in this specific deviation from the classical tetragonal crystal seen in CC and SC disease.
Finally, the α-gene deletion in cis with the gene for α-G Philadelphia in African-Americans23 mandates that the ameliorating effect of α-thalassemia on HbS pathogenesis29 be present in each genotype involving this abnormal Hb and HbS among individuals of African descent23 and some Sardinians.31 Nevertheless, among most Italians31,32 and other ethnic groups, Hbα-G-Philadelphia is not in linkage disequilibrium with α-thalassemia. This is important in terms of the phenotype since the expression of α-G-Philadelphia is maximal when in association with α-thalassemia, and decreases in its absence.33
In conclusion, molecular studies and clinical data from a patient heterozygous for αG-Phila.,, βC, and the βS gene (SC α-G Philadelphia disease) show that αG-Phila. intrinsically promotes the acceleration of βC-induced crystallization, with an additive effect of the gene product of the βS gene. The αG-Phila. gene product increases the number of dense red cells and increases the number of folded cells. Nevertheless, this acceleration of crystallization does not result in increased severity, in part because, due to their ligand state (oxy), circulating intraerythrocytic crystals have relatively low pathogenicity.12 The sickling tendency of these cells is also diminished because the αG-Phila. gene product inhibits HbS-induced polymerization. These circumstances predict low severity for SC α-G Philadelphia disease, as in the case described. Nevertheless, the multitude of epistatic effects in this disease suggest that there might be cases with greater severity due to the cluster of unfavorable genes unlinked to the β-globin gene haplotype.
Address reprint requests to Christine Lawrence, MD, Jacobi Medical Center (Room 3W10), Pelham Parkway S, Bronx, NY 10461.

This feature is available to Subscribers Only
Sign In or Create an Account Close Modal