Abstract
Although chemotherapy effectively reduces the plasma cell burden in multiple myeloma (MM), the disease recurs. MM includes circulating and bone marrow (BM) localized components. A large majority of circulating CD11b+ MM B cells (81%) express an IgH VDJ rearrangement identical to that of autologous BM plasma cells. Unlike plasma cells, these monoclonal circulating B cells exhibit dye and drug transport activity before and throughout chemotherapy. Drug resistance was measured as the ability to export the fluorescent dye Rhodamine123 (Rh123) or the drug adriamycin, using flow cytometry. The role of P-glycoprotein 170 (P-gp), the multidrug transporter, was defined by cyclosporin A (CsA)-sensitive dye export. Only 8% to 11% of BM-localized plasma cells exported dye with the majority retaining dye, identified as bright staining. Circulating leukemic plasma cells were also unable to export dye and remained Rh123bright. However, 53% of circulating clonotypic MM B cells exhibited CsA-sensitive dye export. BM plasma cells taken before or after initiation of first line chemotherapy were equally unable to export dye. Thus in myeloma, differentiation to the plasma cell stage is accompanied by a loss of P-gp function, although P-gp phenotypic expression is retained. In contrast, for monoclonal gammopathy of undetermined significance (MGUS), 54% of BM-localized plasma cells exported dye, comparable to the 53% of circulating MGUS B cells that also exported dye, suggesting that the apparent defect in P-gp function is unique to myeloma plasma cells. Virtually all BM plasma cells in MM retained the drug adriamycin, consistent with their initial drug sensitivity in vivo, in contrast to circulating MM B cells, or to T cells in BM or blood. Thus, circulating B cells appear to be the predominant drug resistant component of the MM B-lineage hierarchy. This report suggests that successful therapeutic strategies will be those that target circulating B cells. Chemosensitization methods involving inhibition of P-gp are likely to improve depletion of these cells by compromising their ability to exclude drug. This work suggests that circulating clonotypic B cells should be monitored in clinical trials to confirm their depletion and the overall efficacy of novel treatment strategies.
MULTIPLE MYELOMA (MM) is characterized by often large numbers of monoclonal plasma cells in the bone marrow (BM) that are responsible for the symptoms of MM.1,2 Most MM patients initially respond to chemotherapy, but nearly all relapse and eventually become refractory to further conventional treatment.2-4 After initial treatment, the decrement in serum monoclonal Ig (MIg) and relief of bone pain indicates substantial depletion of monoclonal BM plasma cells. Despite this, no correlation is detectable between decrement in serum MIg or plasma cell kill after conventional chemotherapy and patient survival.5,6 Thus, generative potential within the MM clone may derive from a less differentiated component. A variety of evidence suggests that MM represents a hierarchy of monoclonal B-lineage cells in the blood and BM7-12 that includes late stage B cells and plasma cells8,10,11 as well as perhaps pre-B cells13 and sIgM+ pre-switch B cells.14-17 Circulating B cells in MM express CD34 and the majority express an IgH VDJ rearrangement identical to that of autologous BM plasma cells,7,17a while the relatively infrequent set of CD34− blood B cells are polyclonal.18 The extensive DNA aneuploidy of these drug resistant B cells suggests they are malignant.18-20
Clinically, in most MM patients BM plasma cells appear sensitive to chemotherapy as measured by reductions in MIg, while the majority of circulating clonotypic B cells are resistant, persisting during and after conventional chemotherapy.7,8,10,17a,18,18a,20a,21 The multidrug transporter P-glycoprotein 170 (P-gp) appears to play a role in resistance to chemotherapy in MM,18a,22-26 and is expressed on members of the MM hierarchy.18a,23,27,28 To determine the functional activity of P-gp expressed on BM plasma cells in MM, their ability to exclude dye and the drug adriamycin was analyzed using multiparameter flow cytometry. The exclusion/retention of the dye Rhodamine 123 (Rh123) and the chemotherapeutic fluorescent drug adriamycin was compared between B-lineage cells related to the malignancy and nonmalignant T cells or monocytes from MM blood and BM. T cells from either blood or BM export both Rh123 and adriamycin, providing an internal control on the assay for each sample. Monocytes, which lack a functional transporter,18a,29,30 retain dye and drug. Circulating MM B cells exhibit efficient transporter function,18a 31 consistent with their drug-resistant status in vivo. In contrast, most circulating terminal leukemic, or BM-localized plasma cells at diagnosis or in relapse retain Rh123 and adriamycin, indicating reduced or absent functional drug transporters. The fact that adriamycin is retained equally well by plasma cells taken at diagnosis or in relapse suggests that resistance mechanisms may be multifactorial in the relapsed or refractory patient.
MATERIALS AND METHODS
Patient tissue. Peripheral blood (PB) was obtained from 73 MM patients and bone marrow (BM) from 28 MM patients, after informed consent. These patients include 11 at diagnosis and untreated, 29 during intermittent chemotherapy, and 32 after cessation of chemotherapy. Some patients gave blood at multiple time points, and over the course of this study an individual patient may appear in all three of the treatment categories indicated above. PB from 7 patients with monoclonal gammopathy of undetermined significance (MGUS) and BM from 3 MGUS patients was also obtained after informed consent, as was PB from 10 healthy donors, and BM from 4 healthy donors. PB mononuclear cells (PBMC) and BM cells (BMC) were promptly purified by centrifugation over FICOLL-PAQUE (Pharmacia, Dorval, Quebec) as previously described.10 18a All experiments were done on freshly obtained cells processed and analyzed without delay.
Antibodies. FMC63 (CD19) was from Dr Heddy Zola32 33 (Women's and Children's Hospital, Adelaide, Australia) and was conjugated to phycoerythrin (PE) or fluorescein isothiocyanate (FITC). Leu17-PE (CD38), Leu15-PE or Leu-15-FITC (CD11B), LeuM3-PE (CD14), Leu2-PE (CD8), and Leu-3PE (CD4) were from Becton Dickinson (San Jose, CA). 8G12 (CD34) was from Dr Peter Lansdorp (Terry Fox Laboratory, Vancouver, British Columbia) and was conjugated to FITC. Isotype matched control antibodies and goat antimouse Ig-PE were from Southern Biotech (Birmingham, AL).
Reagents. Rhodamine 123 was from Molecular Probes (Seattle, WA). Cyclosporin A (CsA) was donated by Sandoz Pharma Inc (Basel, Switzerland).
Rh123 dye efflux. This assay measures the ability of cells to minimize retention of the mitochondrial-binding dye rhodamine 123 (Rh123), and determines whether or not the dye efflux observed, if any, is blocked by agents known to block the P-gp transport pump. As previously described, PBMC were loaded with RH123 (150 ng/mL) (Sigma, St Louis, MO) followed by washing, and resuspension in medium with or without the blocking agent CsA at 1 μg/mL for 3 hours at 37°C to allow dye efflux.18a,34 Cells were then stained with a direct PE conjugate of the indicated monoclonal antibodies (MoAbs), with CsA included in all buffers for the samples treated with it, washed, resuspended in phosphate-buffered saline (PBS) with or without CsA and run immediately on the FACScan (Becton Dickinson). The RH123 emission was collected in the FL1 channel and emissions from MoAbs defining surface phenotype in the FL2 channel. FACScan compensation was set to reduce as much as possible the RH123 emissions detected in FL2. For staining of B cells using dyes emitting in FL2, we used the marker CD11B-PE. CD11b+ MM PBMC are B cells as identified by their expression of CD19 and IgH mRNA,20a which together with CD34, defines a subset of MM B cells10,35 nearly all of which have been shown to express patient-specific IgH rearrangements.7,18 The CD11b+ subset of MM B cells coexpress MRK-1618a and CD34 (see Results), indicating these markers all define the same subset of circulating clonotypic MM B cells. All efflux assays were performed immediately after purification on the day of sample collection. Files of 30,000 to 50,000 cells were gated for surface phenotype in the FL2 channel, and the amount of dye retained plotted as a histogram of FL1 staining. Analysis was using Lysis II (Becton Dickinson).
In situ reverse transcriptase-polymerase chain reaction (RT-PCR) to detect clonotypic B cells. Patient-specific (clonotypic) IgH VDJ sequences were derived from individual BM plasma cells as previously described.7,17a Patient-specific primers were designed from the CDR2 and CDR3 sequences of each patient, and the presence of clonotypic IgH VDJ transcripts was confirmed in at least 10 individual BM plasma cells using single cell RT-PCR, and further confirmed to be expressed by >80% of BM plasma cells using in situ RT-PCR.7,17a In situ RT-PCR using patient-specific primers was as previously described.7 Briefly, freshly drawn and purified PBMC from myeloma patients were stained with MoAb to CD11b and CD19, an within 3 to 4 hours postsample collection were fixed overnight in 10% formalin/PBS. Using the ELITE Autoclone (Coulter, Hialeah, FL) CD11b+19+ B cells were sorted onto In Situ PCR slides (Perkin Elmer, Mississauga, Ontario), and air dried, followed by permeabilization with 2 mg pepsin (Boehringer Mannheim, Laval, Quebec) per mL of 0.01N HCL. The time of pepsin digestion was carefully optimized. Pepsin was inactivated followed by washing with 100% ethanol. Digestion with 1,000 U/mL of DNAseI (RNAse-free) (Boehringer Mannheim) removed genomic DNA from the negative control and the test sample before RT. In situ RT was performed for 60′ at 37°C only for the test samples under standard conditions recommended by the manufacturer using SuperScript (GIBCO-BRL, Burlington, Ontario) and the universal primer dT16. After washing with water and ethanol, an In Situ Core Kit (Perkin Elmer) was used to amplify a target sequence during 25 to 30 cycles (94°C for 1′, 56°C for 1′, and 72°C for 1.5′) with a direct incorporation of DIG-11-dUTP (Boehringer Mannheim) during PCR to label the product. Amplified DNA was detected using anti-DIG Fab conjugated with alkaline phosphatase (Boehringer Mannheim), followed by incubation with NBT/BCIP substrate solution (Boehringer Mannheim). Negative controls for every sample included omitting the RT step to confirm digestion of genomic DNA which would otherwise lead to amplification nonspecific PCR products, and an aliquot with intact DNA as a positive control for the amplification reagents. Every slide had 3 spots of cells which were used for the negative control, the positive control and the test spot; the test sample was only evaluated if the two controls on each slide were, respectively, negative and positive. As a positive control for the RT-PCR with specific primers, when sufficient cells were available, a slide was processed to amplify mRNA for a housekeeping gene, histone, to quantitate the number of cells with intact mRNA. For all tests involving patient-specific primers, parallel slides of sorted B and plasma cells from healthy donors were always run in tandem. Normal B-lineage cells from healthy donors lacked clonotypic transcripts.7 17a
Adriamycin loading and retention. PBMC or BMC were loaded with adriamycin at 2 μg/mL for 30 minutes, followed by washing, incubation for 1.5 hours at 37°C in RPMI plus 5% FCS, and staining with CD19-FITC, CD11b-FITC or Leu17-FITC (CD38), Leu3-FITC or Leu-2 FITC to identify surface phenotype. Files were run on the FACSsort (Becton Dickinson) with adriamycin fluorescence collected in FL2 and the FITC-surface marker in FL1. Files were analyzed using Lysis II to gate for B- or T-cell subsets in FL1 and the drug retention plotted as a histogram of FL2. To compare drug retention by blood and BM subsets, the mean channel fluorescence of BM plasma cells, identified as CD38hi, side scatterhi (SSc), was set to be 100%, and the mean channel FL2 intensity for lymphocyte subsets in PBMC and BMC calculated as the percent of the BM plasma cell level.
RESULTS
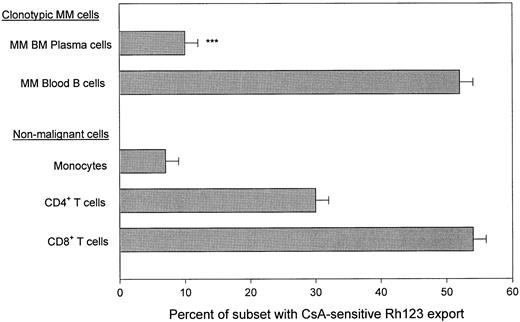
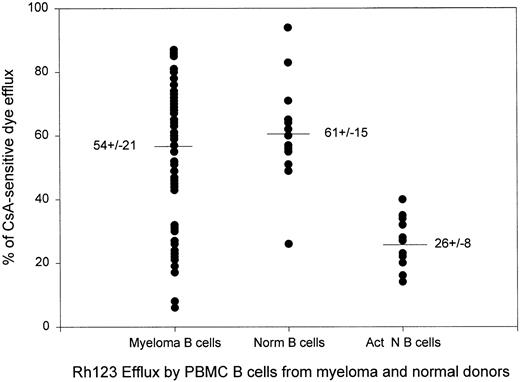
BM plasma cells in MM lack a functional transporter for Rh123 export. BMC from MM patients were loaded with the dye Rh123 and dye export was measured in the presence and absence of the P-gp inhibitor CsA, followed by staining for surface phenotype. BM plasma cells were identified as CD38hi BMC. These have been confirmed elsewhere to be PCA-1+ CD45lo/− cIg+ cells,9,10,18a with monoclonal IgH rearrangments7,17a and their number correlates with the number of plasma cells identified morphologically on cytospins. CsA-sensitive dye export was calculated as the % of cells exporting Rh123 (Rh123dim) in the absence of CsA minus the % of cells exporting dye in the presence of CsA. Figure 1 shows that for the 23 MM BMC analyzed, only 10 ± 2% of BM plasma cells exported dye. In contrast, a mean of 52 ± 2% of blood B cells from 71 MM patients, confirmed below to be members of the malignant clone in MM as defined by the IgH VDJ rearrangement of autologous BM plasma cells, had CsA-sensitive Rh123 export, which is diagnostic for P-gp mediated transporter function (Figs 1 and 2). CsA-sensitive dye export was comparable to that exhibited by B cells from normal donors (Fig 2), and for most patient samples was significantly higher than that of activated normal B cells (Fig 2), which also express CD11b.11 35 Thus, the majority of BM plasma cells were Rh123bright, retaining significantly more dye than did PBMC MM B cells.
Absence of Rh123 export by MM plasma cells, but the presence of CsA-sensitive Rh123 export by subsets of lymphocytes in myeloma PBMC. MM B cells were defined by staining with CD11B-PE. Previous work shows that all CD11B+ PBMC express CD19 and IgH mRNA.20a Plasma cells were defined as CD38hi cells. Monocytes were identified by their CD14bright phenotype and their high scatter after P-gp mediated dye export. T cells were defined by staining with CD4-PE or CD8-PE; the Rh123 export values represent the overall mean CsA-sensitive export incuding both PBMC and BM T-cell subsets. All staining was compared to an isotype-matched control MoAb. Files were gated for the indicated subset and the Rh123 dye export ± CsA was plotted as a histogram. CsA-sensitive, P-gp mediated dye export was defined as Rh123 staining in the absence of CsA minus Rh123 staining in the presence of CsA. BMC from 23 MM patients and PBMC from 68 MM patients were analyzed. ***P < .0001 as compared to MM B cells from PBMC.
Absence of Rh123 export by MM plasma cells, but the presence of CsA-sensitive Rh123 export by subsets of lymphocytes in myeloma PBMC. MM B cells were defined by staining with CD11B-PE. Previous work shows that all CD11B+ PBMC express CD19 and IgH mRNA.20a Plasma cells were defined as CD38hi cells. Monocytes were identified by their CD14bright phenotype and their high scatter after P-gp mediated dye export. T cells were defined by staining with CD4-PE or CD8-PE; the Rh123 export values represent the overall mean CsA-sensitive export incuding both PBMC and BM T-cell subsets. All staining was compared to an isotype-matched control MoAb. Files were gated for the indicated subset and the Rh123 dye export ± CsA was plotted as a histogram. CsA-sensitive, P-gp mediated dye export was defined as Rh123 staining in the absence of CsA minus Rh123 staining in the presence of CsA. BMC from 23 MM patients and PBMC from 68 MM patients were analyzed. ***P < .0001 as compared to MM B cells from PBMC.
Dye efflux by myeloma B cells is comparable to that of normal resting B cells and higher than that of stimulated normal B cells. Each dot represents one blood sample. Normal B cells were from heathy adult volunteers. Activated B cells were from healthy donors and their dye efflux was measured after stimulation in vitro with phytohemaglutinin or pokeweed mitogen for 3 to 5 days as previously described.34 Values are mean ± SE.
Dye efflux by myeloma B cells is comparable to that of normal resting B cells and higher than that of stimulated normal B cells. Each dot represents one blood sample. Normal B cells were from heathy adult volunteers. Activated B cells were from healthy donors and their dye efflux was measured after stimulation in vitro with phytohemaglutinin or pokeweed mitogen for 3 to 5 days as previously described.34 Values are mean ± SE.
Since the Rh123 export assay requires metabolically active freshly isolated cells,18a an internal control on the viability of the cell preparation being tested was always included to confirm that the absence of Rh123 export by BM plasma cells reflected an inactive transporter rather than metabolically depleted cells. BM samples were considered to provide valid data if the T cells in the same aliquot of cells mediated active dye export. Table 1 shows that the level of Rh123 export by nonmalignant CD4+ and CD8+ BM T cells was comparable to that of PBMC T-cell subsets, confirming sample viability, and indicating that lack of dye export in BM was unique to the plasma cells. Overall, T cells from myeloma patients had dye export comparable to that of T cells from normal donors (Fig 1).34 Confirming previous work,18a monocytes from MM blood have little or no CsA-sensitive dye export, similar to the pattern observed here for plasma cells (Fig 1).
In Myeloma, Circulating and BM-Localized Plasma Cells Lack a Functional Transporter for Rh123
| Tissue (no. donors) . | % CsA-Sensitive Dye Efflux . | |||||
|---|---|---|---|---|---|---|
| . | CD38hi . | . | CD4+ . | . | CD8+ . | |
| MM BM | ||||||
| Unt (9) | 8 ± 2‡ | 26 ± 14 | 53 ± 6 | |||
| Tr (14) | 11 ± 3‡ | 44 ± 5 | 53 ± 4 | |||
| Terminal plasma cell leukemia | ||||||
| PBMC (4) | 17 ± 4† | 31 ± 1 | 45 ± 5 | |||
| MGUS BM (3) | 54 ± 5ρ | 21 ± 10 | 51 ± 5 | |||
| CD11B+ | CD4+ | CD8+ | Monocytes | |||
| MM PB | ||||||
| Unt (10) | 62 ± 5 | 30 ± 3 | 54 ± 3 | 6 ± 4 | ||
| Tr (27) | 43 ± 4* | 27 ± 2 | 51 ± 3 | 4 ± 2 | ||
| Off Tr (30) | 57 ± 3 | 30 ± 2 | 54 ± 3 | 6 ± 2 | ||
| MGUS PBMC (7) | 53 ± 5 | 34 ± 3 | 69 ± 4 | 13 ± 6 | ||
BMC or PBMC were loaded with Rh123, allowed to efflux dye for 3 hours followed by staining for surface phenotype as indicated using PE conjugated MoAbs. Monocytes were detected using CD14-PE.
Abbreviation: NA, not applicable.
P = .02.
P < .001.
P < .0001 all as compared to untreated MM blood B cells.
ρ P = .0001 as compared to untreated MM BM plasma cells.
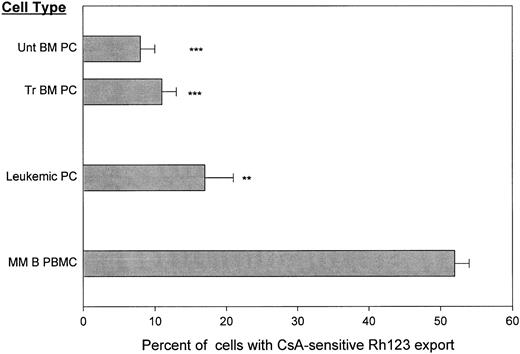
Leukemic and BM-localized plasma cells taken before or after chemotherapy retain Rh123. To determine whether or not tissue of origin and/or treatment status determined the functionality of the Rh123 exporter on plasma cells, circulating leukemic plasma cells from PB of terminal MM patients were compared to BM plasma cells from newly diagnosed or previously treated MM patients (Fig 3). Only 17% of leukemic plasma cells from the blood of terminal MM patients had CsA-sensitive Rh123 export. This indicates that even circulating plasma cells lack transporter function as measured by their Rh123 retention (Fig 3).
Circulating and BM-localized MM plasma cells lack CsA- sensitive dye export before and after chemotherapy. Staining was as for Fig 1. **P < .001 as compared to MM B cells, ***P = <.0001 as compared to MM B cells. T-cell controls are given in Table 1.
Circulating and BM-localized MM plasma cells lack CsA- sensitive dye export before and after chemotherapy. Staining was as for Fig 1. **P < .001 as compared to MM B cells, ***P = <.0001 as compared to MM B cells. T-cell controls are given in Table 1.
Before initiation of chemotherapy, only 8 ± 2% of BM plasma cells exported Rh123 (Fig 3). P-gp phenotypic expression on BM plasma cells increases post-chemotherapy as shown for this cohort of patients18a and by others.23 However, no concomitant increase in transporter function was detectable, indicating that in this assay, on plasma cells surface P-gp lacked dye export function. BM from MM patients who had received chemotherapy included only 11 ± 3% of plasma cells with CsA-sensitive Rh123 export. This confirms that plasma cells from blood or BM lack Rh123 export, even though efficient P-gp function is detected on T cells from the same BMC or PBMC sample (Table 1).
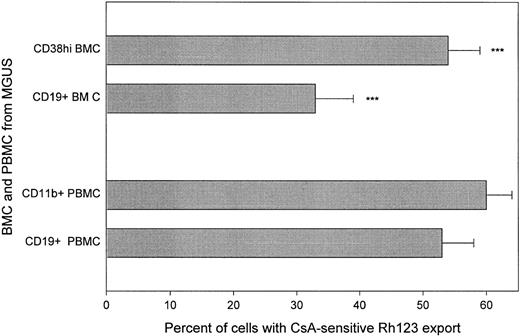
CD38hi or CD19+ cells from MGUS BMC exhibit functional P-gp activity. Sonneveld et al27 have shown that plasma cells in MGUS have high phenotypic expression of P-gp that distinguishes them from MM plasma cells in untreated MM. Consistent with this, MGUS plasma cells have a functionally active Rh123 transporter (Table 1, Fig 4), comparable to that of circulating B cells from MGUS or MM. BMC from MGUS patients include only a low frequency of plasma cells36 and the relationship between phenotypically defined plasma cells in MGUS and MM is largely uncharacterized. CsA-sensitive Rh123 export was analyzed for the CD38hi set of BMC as well as for the CD19+ set (Fig 4). Both CD38hi and CD19+ BMC from MGUS had a significantly greater proportion of cells with CsA-sensitive Rh123 export than did plasma cells from MM, independent of treatment status. In contrast to MM, in MGUS the extent of CsA-sensitive Rh123 export was comparable for blood and BM (Table 1 and Fig 4).
Both circulating B cells and BM plasma cells from patients with MGUS are able to export Rh123. Staining was as for Fig 1. ***P = <.0001 as compared to plasma cells from MM BM. MGUS plasma cells were not significantly different from MGUS B cells. T-cell controls are given in Table 1.
Both circulating B cells and BM plasma cells from patients with MGUS are able to export Rh123. Staining was as for Fig 1. ***P = <.0001 as compared to plasma cells from MM BM. MGUS plasma cells were not significantly different from MGUS B cells. T-cell controls are given in Table 1.
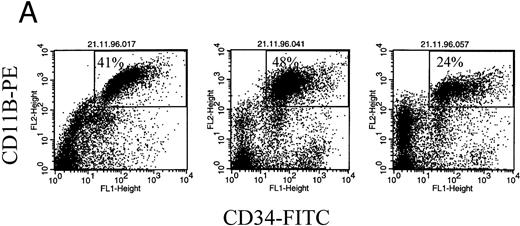
CD11b identifies the clonotypic subset of circulating MM B cells. CD11b was used to phenotypically identify the abnormal set of B cells in MM PBMC.10,18a Other work shows that these CD11B+ blood cells also express CD19 and IgH mRNA.20a Our recent study of clonal IgH rearrangements in circulating B cells showed that B cells expressing the patient-specific IgH VDH rearrangement were identified by their expression of CD347 such that on average 87% of CD34+ MM PBMC were clonotypic B cells.7 Figure 5 (top) shows that all CD11B+ MM PBMC are also CD34+. This confirms that the B cells identified by CD11B in these experiments are clonotypic.
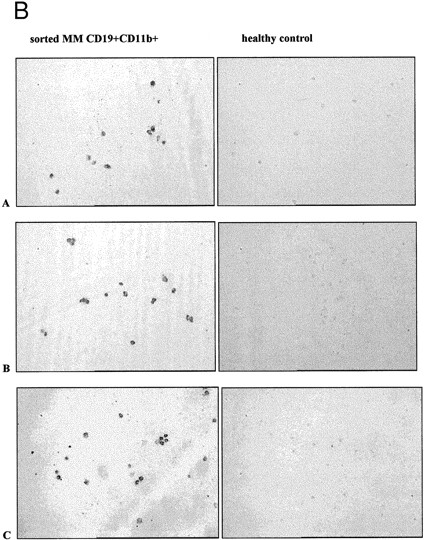
CD11b+ B cells coexpress CD34, which identifies the clonotypic subset. (A) PBMC from 3 different MM patients were stained with CD11b-PE and CD34-FITC. The box indicates the set of cells for which multidrug transporter function has been analyzed in Figs 1, 3, and 6 and Table 1. (B) In situ RT-PCR amplifies clonotypic transcripts from sorted CD19+ 11B+ MM B cells but not from normal B cells. The left column of panels show in situ RT-PCR on CD19+11B+ B cells from (A) patient no. 11, (B) patient no. 6, and (C) patient no. 13. The right column shows patient-specific in situ RT-PCR on CD19+ B cells from healthy donors. Row (A) used primers specific for patient no. 11, row (B) primers specific for patient no. 6 and (C) primers specific for patient no. 13.
CD11b+ B cells coexpress CD34, which identifies the clonotypic subset. (A) PBMC from 3 different MM patients were stained with CD11b-PE and CD34-FITC. The box indicates the set of cells for which multidrug transporter function has been analyzed in Figs 1, 3, and 6 and Table 1. (B) In situ RT-PCR amplifies clonotypic transcripts from sorted CD19+ 11B+ MM B cells but not from normal B cells. The left column of panels show in situ RT-PCR on CD19+11B+ B cells from (A) patient no. 11, (B) patient no. 6, and (C) patient no. 13. The right column shows patient-specific in situ RT-PCR on CD19+ B cells from healthy donors. Row (A) used primers specific for patient no. 11, row (B) primers specific for patient no. 6 and (C) primers specific for patient no. 13.
To directly show clonotypic transcripts in the B cells analyzed for transporter function, CD11B+ cells from MM PBMC were sorted onto slides for in situ RT-PCR using patient-specific primers (Table 2 and Fig 5, bottom). For 5 MM patients, clonotypic transcripts were identified in 81 ± 4% of CD11B+ B cells, but not in sorted B cells from healthy donors (Fig 5).
CD11B+ B Cells in the Circulation Are Predominantly Clonotypic
| Patient (no.) . | % of CD11B+19+ B Cells That Are Clonotypic . |
|---|---|
| 1 | 72 |
| 6 | 78 |
| 11 | 73 |
| 13 | 87 |
| 14 | 93 |
| Mean ± SE | 81 ± 4 |
| Normal PBMC B cells (16) | <0.3% |
| Normal BM plasma cells (5) | <0.3% |
| Patient (no.) . | % of CD11B+19+ B Cells That Are Clonotypic . |
|---|---|
| 1 | 72 |
| 6 | 78 |
| 11 | 73 |
| 13 | 87 |
| 14 | 93 |
| Mean ± SE | 81 ± 4 |
| Normal PBMC B cells (16) | <0.3% |
| Normal BM plasma cells (5) | <0.3% |
Myeloma PBMC were stained with CD11B-PE and CD19-FITC as indicated in Materials and Methods. All CD11B+ PBMC coexpressed CD19. The CD11Bhi and CD19+ subset was sorted onto slides as previously described7 and used in in situ RT-PCR with patient-specific primers to CDR2 and CDR3. Every assay included tests with sorted B cells from 10 healthy normal donors and BM plasma cells from four healthy donors, from which no clonotypic transcripts were detectable. The CDR3 sequence for each of the patients is given below. The CDR3 primer sequences are given in bold.
1.TGTGCTCAC…AAACTTATCACTGGTTGGGACGGTAGTAGT…………TACTTTGACCAG.TGGGGC
6.TGTGCGAGG…GTCCCCATGAACTATGCTATAAGGGGAAACTTAGGT……TCCATTGACTAC.TGGGGC
11.TGTGCGCCA…GTTCTTGCCAACTGGTTT…………………CGCCCCTTTGACCAC.TGGGGC
13.TGTGCGACA…GATCAAGATGACTACGGTGACTACGGGACC……………TTTAACTCC.TGGGGC
14.TGTACGAGA…GTAAATCCTTTCTATGAAGGTAGTCGTTATCCCATA…TACTACTTTGGCTAC.TGGGGC
Most B cells export Rh123 before and after chemotherapy. Although traditionally, multidrug resistance in cancer has been regarded as a drug induced condition, in MM the highest proportion of Rh123 exporting B cells is detected in blood of untreated patients (62 ± 5%) (Table 1, Line 5). The proportion decreases slightly but significantly during intermittant chemotherapy to 43 ± 4% (P = .02), and returns to pretreatment levels after cessation of therapy (Table 1, lines 6 and 7).
Several patients were analyzed at sequential times in their disease for transporter activity of circulating clonotypic B cells. Table 3 shows that dye export by blood B cells remains relatively constant despite treatment with vincristine, adriamycin, deaxamethasone (VAD).
CsA-Sensitive Rh123 Efflux Is Maintained During and After Treatment With VAD
| . | % of Subset With CsA-Sensitive . | |
|---|---|---|
| . | Rh123 Efflux . | |
| . | PBMC B Cells (%) . | BM Plasma Cells (%) . |
| Patient no. 1 | ||
| At diagnosis | 3 | |
| Mo 3/VAD | 62 | |
| Mo 5/VAD | 45 | |
| Mo 7/VAD | 47 | |
| Mo 9/off | 70 | |
| Patient no. 2 | ||
| 2 cycles of VAD/unresponsive | ||
| Mo 10/Ifn | 30 | |
| Mo 12/IL-2 + Ifn | 26 | |
| Mo 13/ante-mortem | 7 | |
| Patient no. 3 | ||
| Mo 4/VAD | 41 | |
| Mo 8/VAD | 63 | |
| Mo 11/VAD | 59 | |
| Mo 18/off | 67 | |
| Patient no. 4 | ||
| VAD | ||
| Mo 10/relapse | 63 | 9 |
| Mo 12/off | 65 | |
| Mo 16/M/P | 17 | |
| Mo 26/death | ||
| Patient no. 5 | ||
| Mo 2/VAD | 76 | |
| Mo 4/VAD | 60 | |
| Mo 5/VAD | 49 | |
| Patient no. 6 | ||
| At diagnosis | 72 | |
| Mo 4/untreated | 60 | |
| Mo 5/untreated | 81 | |
| Patient no. 7 | ||
| Mo 4/M/P | 78 | |
| Mo 9/VAD | 96 | |
Abbreviations: IFn, interferon; M/P, melphalan prednisone.
The time points listed designate months post-diagnosis.
In the scatter plot of Fig 2, there appear to be two sets of patient samples, those with dye export comparable to that of resting normal B cells, and those with relatively low dye export comparable to that of activated normal B cells. Table 4 compares these two groups. Those samples having B cells with low dye export, 13/63 samples, were similar to those with high dye export in their exposure to chemotherapy. In contrast, nearly half of samples from patients within 12 months of death had low dye export, compared with only 20% of those with high dye export (Table 4, line 5, Patient no. 4 Table 3), suggesting a loss of CsA-sensitive dye export as the disease becomes terminal.
Patients With Low CsA-Sensitive Dye Efflux Are More Likely to Die Within the Next 12 Months Than Those With High CsA-Sensitive Dye Efflux
| Patient Status . | Patient Status of PBMC Samples in Which B Cells Have the Indicated % of CsA-Sensitive Dye Efflux . | |
|---|---|---|
| . | Less Than 35% . | Greater Than 35% . |
| Exposed to VAD | 6/13 (46%) | 22/50 (44%) |
| Exposed to M/P | 5/13 (38%) | 16/50 (32%) |
| Other therapy | 2/13 (15%) | 6/50 (12%) |
| Untreated | 0/13 (<7%) | 8/50 (16%) |
| Samples taken within 12 mo of death4-150 | 6/13 (46%) | 10/50 (20%) |
| Total samples | 13/63 (20%) | 50/63 (80%) |
Patients listed as exposed to VAD received this treatment at some point in their therapy before the sample analyzed here; they may or may not also have received other types of therapy. Patients listed as exposed to M/P (melphalan/prednisone) received only M/P and had not been exposed to VAD.
This group is comprised of the same patients listed in the preceding groups.
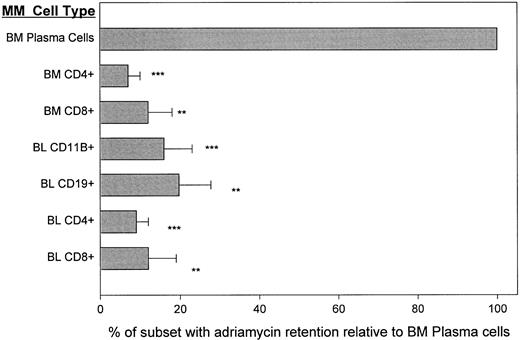
Adriamycin is retained by BM plasma cells but actively exported by circulating MM B cells. To confirm the absence of a functionally active export mechanism from BM plasma cells, we determined their ability to exclude/export the chemotherapeutic drug adriamycin in the absence of any P-gp inhibitors. Cells retaining adriamycin, a fluorescent drug, are bright while those that exclude it are dim. To ensure that test populations were metabolically viable, the adriamycin retention of T cells in blood and BM was evaluated as an internal control. BM plasma cells were adriamycinbright (channel 50-200) indicating drug retention (Fig 6). In aliquots of the same BMC, CD4+ and CD8+ T cells retained adriamycin poorly, with a mean fluorescence intensity that was 7% to 16% of that seen for autologous BM plasma cells. A comparable intensity of staining was seen in T or plasma cells immediately after the uptake period and before the export period (not shown), indicating comparable initial uptake of the drug. Blood samples taken from the same patients at the same time as the BM samples were analyzed in tandem. Two patients were newly diagnosed and untreated, and three were in relapse. For all 5 MM patients, blood B cells, as detected with either CD19 or CD11B, retained only 10% to 20% of adriamycin and T-cell subsets 5% to 12% as compared to autologous plasma cells (Fig 6). Thus within the myeloma hierarchy in blood and BM, as well as among nonmalignant T cells, only the BM plasma cells have the stable intracellular accumulation of adriamycin that is a prerequisite for drug-sensitivity.
MM plasma cells retain adriamycin: MM B and T cells efficiently export adriamycin. Staining was as for Fig 1, but cells were loaded with adriamycin and phenotype was identified using FITC conjugates. T cells from BM or blood and B cells from blood were compared to the BM plasma cells. For each of 3 different MM patients, paired blood and BMC were analyzed in tandem. **P < .001, ***P < .0001 as compared to BM plasma cells.
MM plasma cells retain adriamycin: MM B and T cells efficiently export adriamycin. Staining was as for Fig 1, but cells were loaded with adriamycin and phenotype was identified using FITC conjugates. T cells from BM or blood and B cells from blood were compared to the BM plasma cells. For each of 3 different MM patients, paired blood and BMC were analyzed in tandem. **P < .001, ***P < .0001 as compared to BM plasma cells.
DISCUSSION
This work shows that circulating and BM-localized myeloma plasma cells accumulate the dye Rh123 and the drug adriamycin, indicating their absence of functional P-gp transporter activity, despite their phenotypic expression of P-gp.18a,23 Within the MM B-lineage hierarchy, only circulating B cells efficiently exclude dye and drug. In contrast, plasma cells from MGUS BM express efficient P-gp transporter activity, providing functional confirmation of phenotypic analyses.27 In MM, BM or circulating plasma cells express P-gp as measured phenotypically18a,23,27,28 but Rh123 dye is retained and the cells remain Rh123bright after an export period during which multidrug-resistant cell lines, normal lymphocytes,29,30,34,37 or nonmalignant MM T cells18a efficiently exclude/export internalized dye. Even more relevant clinically, incubation of BM plasma cells with adriamycin results in drug retention as indicated by their bright fluorescence. In contrast, circulating myeloma B cells take up and then rapidly export Rh123 or adriamycin. More than half of circulating B cells in MM express IgH VDJ rearrangements identical to autologous BM plasma cells, indicating their clonal relationship to the malignancy.7,17a,18 The drug resistant subset of blood B cells as identified by CD11B overlaps almost completely with the CD34+ subset previously shown to be clonotypic.7,18 Of sorted CD11B+ B cells, 81 ± 4% were shown to be clonotypic. The preferential expression and function of the multidrug transporter by this these CD11B+ B cells suggests that they may be a primary reservoir of drug resistant clonotypic B cells in myeloma. Although the number of clonotypic MM B cells is reduced post-chemotherapy,8,10 17a they persist during minimal residual disease when clonal BM plasma cells are not clinically detectable by examination of BM biopsies.
Adriamycin is commonly used in combination chemotherapy of MM together with VAD, and as part of chemosensitization drug protocols with agents such as CsA or PSC 833 to inhibit the multidrug transporter. Functional P-gp mediated transport is detected for a large subset of lymphocytes in normal donor PBMC.34 Efficient transport is detected among circulating clonotypic MM B cells before drug exposure in MM18a and is maintained throughout therapy, but appears to decrease during the terminal phase of disease. Our previous work suggested that blood levels of adriamycin significantly higher than those currently obtained with continuous infusion26 would be required to achieve adriamycin-mediated killing of CsA-chemosensitized MM B cells in vivo.18a Grogan et al,23 and ourselves18a showed that P-gp is expressed by plasma cells. Despite this, plasma cells retain adriamycin. Sonneveld et al28 show that the substantial basal retention of adriamycin by plasma cells can be increased further by in vivo exposure to chemosensitizers, indicating relatively inefficient but detectable transport by plasma cells. However, overall the work here suggests that BM plasma cells may be intrinsically susceptible to adriamycin and other P-gp transported drugs. In contrast, the efficient transport of drug and dye by circulating B cells suggests that specifically targeted therapies may be required to achieve their cytoreduction. Chemosensitization strategies that maximize drug retention by inhibition of P-gp transporter function would be predicted to effectively target circulating MM B cells.
The apparent nonfunctionality of P-gp on BM and circulating plasma cells in MM may reflect several biological events. It may indicate a dysfunctional transporter that has been disassociated from its energy source. However, it seems equally likely that the transporter detected phenotypically may be focused on an alternate function. High phenotypic expression of P-gp together with apparent lack of export function is characteristic of normal human monocytes from blood or spleen,29,30,34 which retain Rh123 as indicated by bright fluorescence even after prolonged efflux periods. This pattern is also detected among B cells in thymus and BM of normal donors.34 A variety of evidence suggests that P-gp has functional properties other than transport, possibly including gated ion channel activity38 or ATP channel function.39 These postulated alternative functions may be mutually exclusive with the transporter conformation required for drug/dye exclusion. Thus P-gp on BM or circulating plasma cells may have a conformation different from that on circulating B cells in MM. This appears to be unique to myeloma plasma cells, as plasma cells from MGUS BM had efficient P-gp–mediated transport, comparable to that of autologous circulating B cells. The number of clonotypic B and plasma cells in MGUS BM is unknown. It is important to note however that the B-lineage cells in MGUS BM may vary significantly from the malignant plasma cells in MM. Differences in function and differentiation stage of BM plasma cells in MGUS and those in MM are largely unexplored.
The lack of a functional P-gp mediated transporter on plasma cells suggests that successful responses to chemosensitization may have a predominant impact on circulating B cells, rather than on plasma cells as is commonly supposed. The work reported here confirms that circulating B cells represent a major reservoir of drug resistant disease in myeloma, likely reflecting efficient drug exclusion by functionally active P-gp. The extent to which these cells persist after therapy should be monitored during new clinical trials to evaluate the effects of treatment on their numbers, as well as to confirm the predicted clinical benefits of chemosensitization protocols designed to circumvent P-gp transporter function.
ACKNOWLEDGMENT
The excellent technical assistance of Eva Pruski, Karen Seeburger, and Darlene Paine is gratefully acknowledged.
Supported by a grant from the National Cancer Institute of Canada (Toronto, Ontario) with funds from the Canadian Cancer Society. A.J.S. was supported by a studentship award from the Alberta Heritage Foundation for Medical Research (Edmonton, Alberta).
Address reprint requests to Linda M. Pilarski, PhD, Department of Oncology, 11560 University Ave, Cross Cancer Institute, Edmonton AB T6G1Z2 Canada.

This feature is available to Subscribers Only
Sign In or Create an Account Close Modal