Abstract
To overcome the problem of multidrug resistance, we investigated the effectiveness of phosphrothioate antisense oligonucleotides (MDR1-AS) in suppressing multidrug resistance gene (mdr1) expression in drug-resistant acute myelogenous leukemia (AML) blast cells and the K562 adriamycin-resistant cell line K562/ADM. The percentage of cells with the mdr1 gene product P-glycoprotein (P-gp) was decreased from 100% to 26% by 20 μmol/L MDR1-AS in the K562/ADM cells, and from 48.1% to 10.2% by 2.5 μmol/L MDR1-AS in the AML blast cells. Western blot analysis also showed a decrease in the amount of P-gp in the MDR1-AS–treated K562/ADM cells. This effect was specific to MDR1-AS, and not observed with sense or random control oligonucleotides. The expression of mdr1 mRNA in K562/ADM and AML blast cells treated with MDR1-AS was decreased compared with the random control. Intracellular rhodamine retention and [3H]daunorubicin also increased after antisense treatment. Chemosensitivity to daunorubicin increased in MDR1-AS–treated blast cells up to 5.9-fold in the K562/ADM cells and 3.0- to 6.4-fold in the AML blast cells. The expression of mdr1mRNA derived from colony cells decreased in the MDR1-AS–treated groups. No inhibitory effect of the oligonucleotides on normal bone marrow progenitors was observed. These findings suggest that MDR1-AS is useful to overcome multidrug resistance in the treatment of leukemia.
RESISTANCE TO CHEMOTHERAPY is a major obstacle in cancer treatment and has been closely associated with treatment failure. This phenomenon is termed multidrug resistance (MDR). One of the mechanisms of MDR involves the overexpression of the multidrug resistance gene (mdr1) product, P-glycoprotein (P-gp).1 P-gp is a 170-kD membrane glycoprotein capable of the adenosine triphosphate (ATP)-dependent cellular efflux of a variety of compounds across the plasma membrane. It has been shown that the overproduction of P-gp causes not only an increase in drug excretion from cells, but also a decrease in intracellular drug accumulation, thereby reducing the intracellular drug contents such as daunorubicin (DNR) and adriamycin. We previously reported that the intracellular DNR content is lower in P-gp+ acute myelogenous leukemia (AML) blast cells than in P-gp− blast cells.2 We and several other groups have reported that the presence of P-gp or of mdr1 in AML blast cells is associated with a low complete remission rate and short survival.2-4
Three strategies have been developed for the eradication of P-gp–expressing MDR cells: (1) chemical compounds such as verapamil,5 cyclosporin-A,6 and MS-2092; (2) monoclonal antibodies such as MRK167 or immunotoxins against P-gp8; and (3) antisense (AS) oligonucleotides for the specific inhibition of P-gp gene expression.9-11 AS oligonucleotides are short sequences of DNA that form a specific hydrogen bond with complementary single-strand mRNA sequences, allowing the regulation of specific gene expression.12,13 The possible use of AS oligonucleotides in suppressing the expression of certain genes is now under investigation by several groups.14 15
We addressed the question of whether AS oligonucleotides tomdr1 mRNA (MDR1-AS) could suppress the overexpression of P-gp in AML blast cells. In the present study, we showed that incubation with AS oligonucleotides to mdr1 mRNA reduced the in vitro expression of P-gp in drug-resistant K562 cells and AML blast cells. Furthermore, P-gp function of the AS-treated blast cells was inhibited, as shown by intracellular rhodamine (Rh123) and intracellular DNR retention assays, and the AS-treated blast cells recovered their sensitivity to DNR, as shown by a leukemic blast colony assay.
MATERIALS AND METHODS
Cell Line
The human myelogenous leukemia cell line K562 and the adriamycin-resistant subline K562/ADM16 were grown in RPMI 1640 medium (GIBCO, Grand Island, NY) supplemented with 10% fetal calf serum (FCS; Intergen, Purchase, NY). The P-gp positivity of K562/ADM cells was 100% using MRK16 antibody (Kyowa Medex, Tokyo, Japan).7 The cellular sensitivity to DNR measured by clonogenic assay showed that the degree of resistance of K562/ADM was 52.6-fold greater than that of K562 (D10value,17 the dose of DNR reducing the colony numbers to 10% of the control; 1.0 × 10⁻⁵ mol/L v1.9 × 10−7 mol/L).
AML Blast Cells
Mononuclear cells from peripheral blood or bone marrow cells taken from patients with AML including chronic myelogenous leukemia in blast crisis (CMLbc) were separated through a Ficoll-Conray density gradient (density, 1.077). The leukemic subtype was determined according to the French-American-British (FAB) classification. Contaminated T cells were removed by rosette formation with sheep erythrocytes as described in previous paper.17,18 Leukemic blast cells thus prepared17,18 were suspended in alpha-modified Eagle's minimal essential medium (Flow Laboratories, Mclean, VA), and were either used immediately or cryopreserved in liquid nitrogen with 10% dimethylsulfoxide and 50% FCS until being used. Each sample thus prepared contained cells that were more than 90% leukemic blasts. P-gp positivity was examined as described below, and the blast cells of 10 P-gp+ patients were used in this study. The characteristics of these patients are shown in Table1. Ten patients received combination chemotherapy, and only 2 out of 9 evaluated patients achieved complete remission. Cellular sensitivity to DNR (D10 values) of these leukemic blast progenitors varied from 9.0 × 10⁻⁷mol/L to 6.0 × 10⁻⁶ mol/L, and these values were considered to be resistant, as judged from our previous study.2 The frequency of P-gp+ samples in acute leukemia was 38.8% (62 out of 160 patients) (submitted data).
Clinical Characteristics of Patients With AML Whose Blast Cells Were Treated With MDR1-AS
| Patient . | FAB Subtype . | I/R . | Source of Cell . | WBC (×109/L) . | Blast (%) . | Treatment . | Outcome of Treatment . | P-gp (%) . | MDR1-AS P-gp (%) . | D10 Value (mol/L) . | MDR1-AS D10 Ratio-150 . | |
|---|---|---|---|---|---|---|---|---|---|---|---|---|
| No. . | Sex/ Age . | |||||||||||
| 1 | M/47 | M1 | I | P | 400.0 | 98 | BHAC-DMP | NR | 47.0 | 20.9 | 9.0 × 10⁻⁷ | 3.3 |
| 2 | F/79 | M1 | I | P | 130.0 | 94 | BHAC-DMP | NR | 54.8 | 14.8 | 2.0 × 10⁻⁶ | ND |
| 3 | M/70 | M2 | I | P | 26.0 | 62 | BHAC-DMP | NR | 76.1 | 5.2 | 2.0 × 10⁻⁶ | ND |
| 4 | M/47 | M2 | R | B | 437.0 | 75 | BHAC-EM | CR | 34.0 | 10.5 | 2.0 × 10⁻⁶ | ND |
| 5 | M/47 | M3 | I | B | 14.1 | 78 | RA, DNR | CR | 33.5 | 4.7 | NE-151 | ND |
| 6 | M/71 | OL-MDS | I | P | 7.2 | 85 | VP, CAG | NR | 26.2 | 4.3 | 1.0 × 10⁻⁶ | ND |
| 7 | M/57 | OL-MDS | I | P | 58.0 | 55 | AraC, VP16 | NR | 48.8 | 2.5 | 2.8 × 10⁻⁶ | ND |
| 8 | F/61 | CMLbc | I | P | 63.6 | 73 | VP | NE | 49.4 | 19.5 | 6.0 × 10⁻⁶ | 3.0 |
| 9 | M/44 | CMLbc | I | P | 49.3 | 60 | AraC, DNR, VCR | NR | 45.8 | 14.8 | 4.0 × 10⁻⁶ | 6.4 |
| 10 | M/44 | CMLbc | I | P | 140.0 | 98 | BHAC-DMP | NR | 65.7 | 5.0 | 1.0 × 10⁻⁶ | 3.2 |
Abbreviations: M, male; F, female; OL-MDS, overt leukemia from myelodysplastic syndromes; I, initial presentation; R, relapse stage; P, peripheral blood; B, bone marrow; WBC, white blood cell; BHAC, behenoyl AraC; DMP, DNR + 6-mercaptopurine + prednisolone; EM, VP16 + 6-mercaptopurine; RA, retinoic acid; VP, vincristine + prednisolone; CAG, AraC + ACR + G-CSF; VCR, vincristine; CR, complete remission; NR, no response; NE, not evaluable; ND, not done.
The values of D10 ratio in random- and MDR1-S–treated cells were from 0.7 to 1.3, except for MDR1-S–treated cells in case No. 9 (2.2).
This could not be evaluated because only clusters were formed.
Oligonucleotides
The following three phosphrothioate oligonucleotides were synthesized and purified by high performance liquid chromatography: MDR1-AS, complementary to mdr1 mRNA location −12 to +12, 5′ TTC AAG ATC CAT CCC GAC CTC GCG 3′; MDR1-sense (S), sense sequence of MDR1-AS, 5′ CGC GAG GTC GGG ATG GAT CTT GAA 3′; and random control (random), a 24-mer random sequence oligonucleotide.
Oligonucleotide Treatments of Cells With Lipopolyamine
Lipopolyamine, a cationic liposome (Transfectam; Biospra, Marlbourough, MA) was used to increase the oligonucleotide uptake of cells according to the method reported by Behr et al.19 The oligonucleotide/lipid complex was obtained by adding various concentrations of oligonucleotide solution to lipopolyamine solution (when the DNA content of the oligonucleotides was x μg, 0.5x μL of lipopolyamine solution was added according to the manufacturer's protocol). In every experiment, the oligonucleotide/lipid complex thus prepared was added every 12 hours to the cell suspension (1 ∼ 2 × 10⁶ cells/mL) in RPMI medium with 7% FCS, and incubated at 37°C in a humidified atmosphere with 5% CO2. After 96 hours, the cells were washed with phosphate-buffered saline (PBS), then analyzed for the determination of P-gp positivity, functional assay, and drug sensitivity.
Efficiency of Oligonucleotide Uptake by Cells
Oligonucleotides were treated with 3′ end-labeled [α-32P] dATP using terminal deoxynucleotidyl transferase (Amersham, Little Chalfort, UK) in 0.14 mol/L sodium cacodylate (pH 7.2), 1 mmol/L CoCl2, and 0.1 mmol/L dithiothreitol for 1 hour at 37°C. After elution through a Sephadex G-50 column to remove unincorporated ATP, labeled oligonucleotides (1 μmol/L) and lipopolyamine were mixed and added to K562/ADM cells. At various times after incubation (from 10 minutes to 24 hours), cells were washed, and the cell-bound radioactivity was measured by a scintillation counter.
Determination of P-gp by Fluorescence Microscopy
The P-gp of the leukemic blast cells was stained according to the method described by Schinkel et al20 with some modifications. The cytospin preparations of leukemic blast cells were fixed with 3% formaldehyde, then incubated with 100 μg/mL MRK16 antibody. After washing, the preparations were incubated with goat anti-mouse IgG-conjugated fluorescein isothiocyanate (dilution, 1:25; Tago, Burlingame, CA), then examined by fluorescence microscopy. The percentage of P-gp+ cells was determined for 1,000 cells counted.
Determination of P-gp by Flow Cytometry
The leukemic blast cells were stained according to the method reported previously using MRK16 monoclonal antibody,7 and analyzed using an Epics-Profile II flow cytometer (Coulter Co, Miami, FL). P-gp positivity was determined by the Epics Elite software Immuno 4 computer program21 (Coulter), and the sample was considered to be P-gp+ when more than 20% of the cells were stained.3
Determination of P-gp by Western Blot Analysis
Plasma membrane fractions from random- or MDR1-AS–treated K562/ADM cells were isolated as described by Kawai et al.22Membrane-enriched fractions (10 μg proteins) were electrophoresed in a 7.5% sodium dodecyl sulfate (SDS)-polyacrylamide gel and then electrotransferred to polyvinylfluoride paper. Western blot analysis was performed with monoclonal anti–P-gp antibody C219 (Centcor, Malvern, PA) using peroxidase-conjugated goat anti-mouse IgG (dilution, 1:1,500; Sigma Chemical Co, St Louis, MO) and enhanced chemiluminescence (Amersham).
Detection of mdr1 mRNA Expression by Reverse Transcription-Polymerase Chain Reaction (RT-PCR) Analysis
Total RNA from oligonucleotide-treated cells (K562/ADM 5 μmol/L, AML blast cells 2.5 μmol/L) was extracted using acid-guanidium-phenol-chloroform as described23 and converted to single-strand cDNA using a random primer and reverse transcriptase under reaction conditions described previously.24 PCR was performed on the cDNA after the addition of Taq DNA polymerase, dNTP, and each primer using a Perkin-Elmer Cetus thermal cycler as described previously.24 An aliquot of each reaction mixture was then analyzed by electrophoresis on a 2% agarose gel, and the amplified DNA band was visualized by ethidium bromide staining. The amplification products of mdr1 and β2-microglobulinwere 309 bp and 261 bp, respectively.
Determination of Intracellular Rh123 Retention
Rh123 (Sigma) studies were performed according to our previous study2 with some modifications. Briefly, oligonucleotide-treated cells (2 × 10⁵) (K562/ADM 5 μmol/L, AML blast cells 2.5 μmol/L) were loaded with 150 ng/mL of Rh123 in 5 mL of PBS for 10 minutes at 37°C. Rh123 retention was assayed by allowing the dye efflux in 5 mL of PBS with 10% FCS for 3 hours at 37°C. After two washes, intracellular Rh123 fluorescence intensity was quantitated by flow cytometry using a 530-nm (Rh123) long band-pass filter and determined by the Epics Elite software Immuno 4 computer program.21
Determination of Intracellular [3H]DNR Retention
A [3H]DNR retention assay was performed according to the method described by Tsuruo et al16 with some modifications. Briefly, oligonucleotide-treated cells (2 × 10⁵) (K562/ADM 5 μmol/L, AML blast cells 2.5 μmol/L) were incubated at 37°C with [3H]DNR (1 μmol/L; specific activity 4.4 Ci/mmol; Daiichi Pure Chemical Co Ltd, Tokyo, Japan) for 1 hour in 1 mL of RPMI medium. Then, each cell suspension was washed and resuspended in 1 mL of medium at 37°C for 3 hours. The amount of intracellular DNR was measured with liquid scintillation counter after the cells were lysed with 0.5 mL of 0.2 N NaOH. The [3H]DNR retention/accumulation ratio was calculated as follows: intracellular retention was divided by intracellular accumulation.
Measurement of Cellular Sensitivity to DNR
DNR sensitivity of leukemic blast cells from patients and K562/ADM was examined. The effect of oligonucleotides was also examined in K562/ADM (5 μmol/L) and in four AML samples (2.5 μmol/L). Leukemic blast cells (5 × 10⁵ cells/mL) were exposed to different concentrations of DNR (10−7 mol/L ∼5 × 10⁻⁵ mol/L) for 1 hour at 37°C according to the method reported previously.17 After being washed three times with PBS, the cells were suspended with 0.8% methylcellulose and 20% FCS, and plated in a 96-microwell plate (Linbro; Flow Laboratories) at a concentration of 5 × 10⁴ cells/0.1 mL. A mixture of recombinant human granulocyte-macrophage colony-stimulating factor (rGM-CSF; 103 U/mL), recombinant human granulocyte CSF (rG-CSF; 104 U/mL), and recombinant human interleukin-3 (102 U/mL) was added to the culture as a CSF. All of the CSFs were obtained from Kirin-Brewery Co Ltd (Tokyo, Japan). Culture plates were incubated at 37°C in a humidified atmosphere with 5% CO2. After 7 days, colonies consisting of more than 20 cells were counted under an inverted microscope. The cellular sensitivity to DNR was determined by calculating the dose of DNR that reduced the colony numbers to 10% of the control (D10 value).17 To examine the effect of the three oligonucleotides on the sensitivity to DNR, the D10ratio was calculated as follows: the D10 value without oligonucleotides was divided by the D10 value with oligonucleotides.
Persistence of P-gp Suppression After AS Treatment
To examine the persistence of P-gp suppression after MDR1-AS treatment, oligonucleotide-treated cells (K562/ADM 5 μmol/L, AML blast cells 2.5 μmol/L) were washed and incubated in oligonucleotide-free RPMI medium with 10% FCS for 1 to 10 days, and then the P-gp was examined.
Effect of Oligonucleotides on Bone Marrow Progenitors
Bone marrow cells were obtained from normal volunteers who had given their informed consent, and mononuclear cells were separated using a Ficoll-Conray density gradient. The colony assay for bone marrow progenitors was performed by the method described by Fauser and Messner25 and Dover et al26 with slight modifications. Bone marrow mononuclear cells (2 × 10⁶cells/mL) were incubated with or without oligonucleotide/lipid complex added every 12 hours for 96 hours at the concentration of 2.5 μmol/L, washed, then plated in 35-mm tissue culture dishes (Nunc Inc, Naperville, IL) containing 1 mL of a mixture of 0.9% methylcellulose, 30% FCS, 1% bovine serum albumin, 1 U/mL recombinant human erythropoietin (Kirin), and 5 × 10⁶ U/mL rG-CSF. Granulocyte-macrophage colony-forming units (CFU-GM) and erythroid colony-forming units (CFU-E) were scored on day 7, and erythroid burst-forming units (BFU-E) and pluripotent hemopoietic progenitors (CFU-GEMM) were scored on day 14, respectively. The criteria for positive colony formation for each different lineage were defined as described by Fauser and Messner25 and Dover et al26 The numbers of colonies were counted in three dishes in all experiments and compared with the untreated controls.
Statistical Analysis
Student's t-test was used to evaluate the differences between two groups.
RESULTS
Oligonucleotide Uptake Efficiency
The uptake of oligonucleotides into K562/ADM cells reached the maximum value after 30 minutes of incubation (9%), and the overall uptake efficiency was 5%∼9%.
Effect of MDR1-AS on K562/ADM Cells
Expression of P-gp and mdr1 mRNA in MDR1-AS–treated K562/ADM cells.
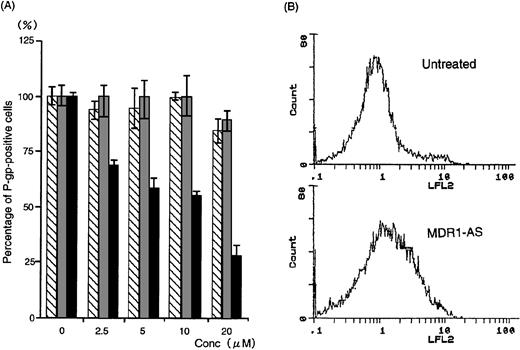
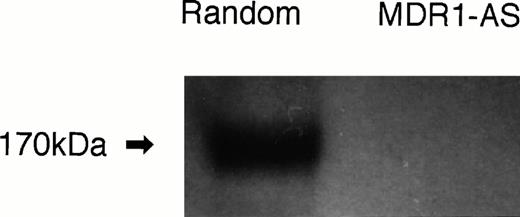
The number of K562/ADM cells did not decline after exposure to MDR1-AS, and the viability of the blast cells remained at 80%∼90%. Figure1A shows the percentages of P-gp+ cells among K562/ADM cells after incubation with MDR1-AS, as detected by fluorescence microscopy. The percentages of P-gp+ cells were reduced in proportion to the dose of MDR1-AS used (at 2.5 μmol/L, 69%; 5 μmol/L, 58%; 10 μmol/L, 55%; 20 μmol/L, 26%). The maximum effect of MDR1-AS was observed at the highest concentration (20 μmol/L), and the percentage of P-gp+ cells decreased from 100% to 26% at this concentration. The suppression of P-gp was observed when leukemic blast cells were treated with MDR1-AS, but was not observed with the MDR1-S or random oligonucleotides in low (2.5 μmol/L ∼ 10 μmol/L) concentrations. Only slight inhibition was seen in the random- and MDR1-S–treated groups at the high (20 μmol/L) concentration. Because a reduction of P-gp positivity was observed after treatment with 5 μmol/L MDR1-AS, we used this concentration for further experiments. The reduction of P-gp expression on K562/ADM cells was also observed by Western blot analysis, as shown in Fig 2.Only scarce P-gp expression was detected on K562/ADM cells treated with MDR1-AS (5 μmol/L), whereas P-gp from random-treated K562/ADM cells was definitely observed. P-gp expression from untreated K562/ADM cells was similar to that of random-treated cells, and a slight decrease was seen in MDR1-S–treated cells (data not shown).
(A) The percentage of P-gp+ cells in K562/ADM cells after oligonucleotide treatment (5 μmol/L). Determination of P-gp by fluorescence microscopy was performed after random (▧), MDR1-S (▧), and MDR1-AS (▩) treatment at various concentrations. The results are expressed as the percentage of treated cells compared with the untreated control, and represent the mean ± the SD of the three experiments. (B) Intracellular Rh123 retention in K562/ADM cells after oligonucleotide treatment (5 μmol/L). Intracellular Rh123 retention of untreated, random-, MDR1-S–, and MDR1-AS–treated cells was measured using flow cytometry, and the figure represents untreated and MDR1-AS–treated cells.
(A) The percentage of P-gp+ cells in K562/ADM cells after oligonucleotide treatment (5 μmol/L). Determination of P-gp by fluorescence microscopy was performed after random (▧), MDR1-S (▧), and MDR1-AS (▩) treatment at various concentrations. The results are expressed as the percentage of treated cells compared with the untreated control, and represent the mean ± the SD of the three experiments. (B) Intracellular Rh123 retention in K562/ADM cells after oligonucleotide treatment (5 μmol/L). Intracellular Rh123 retention of untreated, random-, MDR1-S–, and MDR1-AS–treated cells was measured using flow cytometry, and the figure represents untreated and MDR1-AS–treated cells.
P-gp expression after random- or MDR1-AS treatment (5 μmol/L) in K562/ADM cells. Western blot analysis using C219 monoclonal antibody was performed.
P-gp expression after random- or MDR1-AS treatment (5 μmol/L) in K562/ADM cells. Western blot analysis using C219 monoclonal antibody was performed.
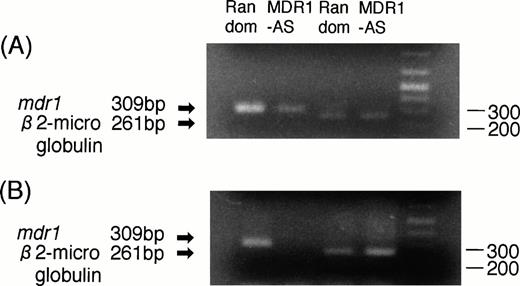
RT-PCR analyses were performed to determine whether the decrease in P-gp expression was directly caused by an AS-mediated specific inhibition of mdr1 mRNA. As shown in Fig3A, the magnitude of the mdr1transcript of K562/ADM cells treated with MDR1-AS (5 μmol/L) was significantly decreased compared with that of cells treated with the random oligonucleotide, even though an equal amount ofβ2-microglobulin was detected in both lanes.
(A) Expression of mdr1 mRNA in K562/ADM cells after random or MDR1-AS treatment (5 μmol/L) by RT-PCR analysis. The ratio of mdr1/β2-microglobulin in random- and MDR1-AS–treated groups by scanning densitometry were 5.26 and 1.89, respectively. (B) Expression of mdr1 mRNA of cells from pooled colonies produced by K562/ADM cells treated with random or MDR1-AS oligonucleotide (5 μmol/L) by RT-PCR analysis. The ratio ofmdr1/β2-microglobulin in random- and MDR1-AS–treated groups by scanning densitometry were 1.94 and 0.49, respectively.
(A) Expression of mdr1 mRNA in K562/ADM cells after random or MDR1-AS treatment (5 μmol/L) by RT-PCR analysis. The ratio of mdr1/β2-microglobulin in random- and MDR1-AS–treated groups by scanning densitometry were 5.26 and 1.89, respectively. (B) Expression of mdr1 mRNA of cells from pooled colonies produced by K562/ADM cells treated with random or MDR1-AS oligonucleotide (5 μmol/L) by RT-PCR analysis. The ratio ofmdr1/β2-microglobulin in random- and MDR1-AS–treated groups by scanning densitometry were 1.94 and 0.49, respectively.
P-gp function in MDR1-AS–treated K562/ADM cells.
As shown in Fig 1B and Table 2,intracellular Rh123 retention in the MDR1-AS–treated K562/ADM cells (5 μmol/L, 37.4%) increased compared with untreated cells (13.3%), indicating Rh123 efflux is inhibited. In contrast, intracellular Rh123 retention did not change in random- (13.4%) or MDR1-S–treated cells (11.7%). As shown in Table 2, the [3H]DNR retention/accumulation ratio of K562/ADM cells after MDR1-AS treatment (5 μmol/L) was 25.0% in the MDR1-AS–treated group, and this value was higher than that of untreated, random-treated and MDR1-S–treated cells.
Intracellular Rh123 Retention and 3[H]DNR Retention/Accumulation Ratio in K562/ADM Cells and AML Blast Cells From Two Patients After Oligonucleotide Treatment
| . | K562/ADM . | AML Blast Cells . | |
|---|---|---|---|
| Case 8 . | Case 9 . | ||
| Rh123 retention (%) | |||
| Untreated | 13.3 | 16.5 | 40.4 |
| Random | 13.4 | 16.1 | 40.5 |
| MDR1-S | 11.7 | 15.9 | 42.1 |
| MDR1-AS | 37.4 | 23.4 | 49.1 |
| 3[H]DNR retention/accumulation ratio (%) | |||
| Untreated | 20.8 | 14.2 | 18.0 |
| Random | 19.6 | 19.3 | 16.5 |
| MDR1-S | 15.0 | 15.8 | 14.9 |
| MDR1-AS | 25.0 | 25.1 | 22.0 |
Data represent mean of two experiments.
Sensitivity to DNR of leukemic blast progenitors in MDR-1-AS–treated K562/ADM cells.
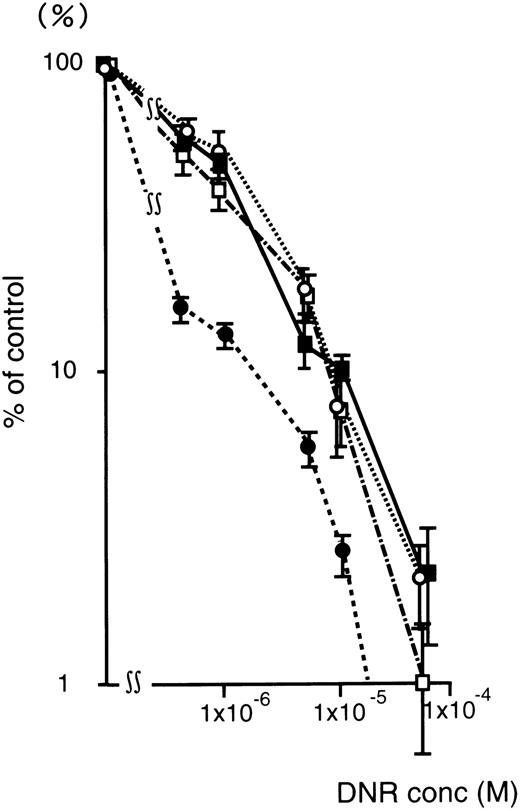
Figure 4 shows the DNR dose-response curve of oligonucleotide treated (5 μmol/L) K562/ADM cells for colony formation. The numbers of leukemic blast colony cells incubated with DNR was decreased remarkably in the MDR1-AS–treated group compared with those of the untreated, random-treated, and MDR1-S–treated groups. In the MDR1-AS–treated cells, the D10 value was 1.7 × 10⁻⁶ mol/L, whereas that of untreated cells was 1.0 × 10⁻⁵ mol/L. The D10 ratio was 5.9-fold higher in the MDR1-AS–treated cells compared with the untreated cells, indicating the occurrence of the recovery of the cell's drug sensitivity to DNR. In contrast, the D10values and the D10 ratios did not change in the cells treated with the random (1.0 × 10⁻⁵ mol/L, 1.0-fold) or MDR1-S oligonucleotides (9.0 × 10⁻⁶ mol/L, 1.1-fold).
Changes in the sensitivity of K562/ADM cells to DNR after oligonucleotide treatment (5 μmol/L). Leukemic blast colony assays were performed in untreated (▪), random- (□), MDR1-S– (○), and MDR1-AS–treated cells (•). The results are expressed as the percentage of DNR treated colonies compared with the DNR untreated control, and represent the mean ± the SD of colony numbers of three dishes.
Changes in the sensitivity of K562/ADM cells to DNR after oligonucleotide treatment (5 μmol/L). Leukemic blast colony assays were performed in untreated (▪), random- (□), MDR1-S– (○), and MDR1-AS–treated cells (•). The results are expressed as the percentage of DNR treated colonies compared with the DNR untreated control, and represent the mean ± the SD of colony numbers of three dishes.
mdr1 expression in leukemic blast colony cells after MDR1-AS treatment.
K562/ADM cells from pooled colonies formed after incubation with DNR were examined for mdr1 mRNA expression. As shown in Fig 3B, the cells of colonies formed from MDR1-AS–treated cells did not expressmdr1 mRNA, whereas the cells of colonies formed from random-treated cells expressed mdr1 mRNA. The levels ofβ2-microglobulin expression were quite similar in the two groups.
Persistence of P-gp suppression by MDR1-AS treatment.
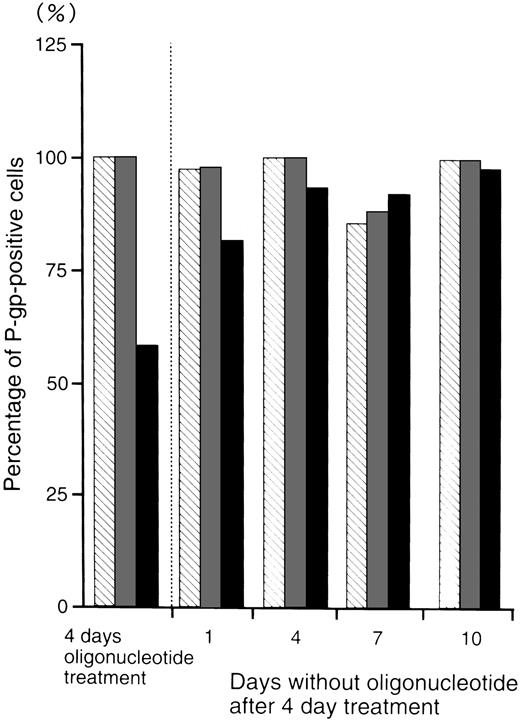
Figure 5 shows the percentage of P-gp+ cells which were treated with oligonucleotides, then incubated in oligonucleotide-free medium for various durations. After 4 days incubation in oligonucleotide-free medium, the percentage level of P-gp+ cells (93%) recovered to those of the random- (100%) and MDR1-S– (99%) treated groups.
The percentage of P-gp+ cells in oligonucleotide-treated K562/ADM cells (5 μmol/L) after incubation with oligonucleotide-free medium. After random (▧), MDR1-S (▧), and MDR1-AS (▪) treatment, these cells were incubated with oligonucleotide-free medium for 1 to 10 days, and measurement of P-gp using fluorescence microscopy was performed. The results are expressed as the percentage of treated cells compared with the untreated control, and represent the mean of two experiments.
The percentage of P-gp+ cells in oligonucleotide-treated K562/ADM cells (5 μmol/L) after incubation with oligonucleotide-free medium. After random (▧), MDR1-S (▧), and MDR1-AS (▪) treatment, these cells were incubated with oligonucleotide-free medium for 1 to 10 days, and measurement of P-gp using fluorescence microscopy was performed. The results are expressed as the percentage of treated cells compared with the untreated control, and represent the mean of two experiments.
Effect of MDR1-AS on AML Blast Cells
Expression of P-gp and mdr1 mRNA in MDR1-AS–treated AML blast cells.
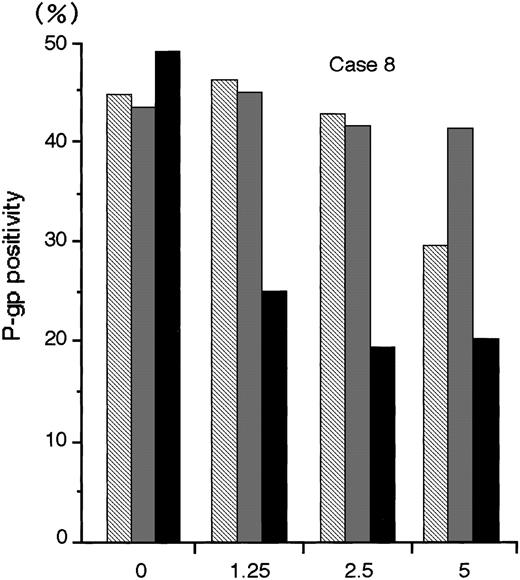
The numbers of blast cells did not decline after exposure to MDR1-AS; the viability of the blast cells remained at 80%∼90%. Figure6 shows a typical dose-response curve for oligonucleotide treatment of AML blast cells (Case No. 8) as detected by flow cytometry. The P-gp positivity was reduced in proportion to the dose of MDR1-AS added, and the maximum effect of MDR1-AS was observed at the concentration of 2.5 μmol/L. The P-gp positivity at this concentration decreased from 49.4% to 19.5%. The P-gp positivity was specifically suppressed when AML blast cells were treated with MDR1-AS, and was not suppressed when the cells were treated with the MDR1-S or random oligonucleotides. These findings were also observed in Case No. 9 AML blast cells (data not shown), and confirmed by fluorescence microscopy in both AML blast cells (data not shown). Therefore, we used this concentration for further experiments. The P-gp positivity of blast cells from 10 AML patients before and after treatment with MDR1-AS are listed in Table 1. The P-gp positivity was greatly decreased by the treatment with MDR1-AS; the mean P-gp positivity of AML blast cells declined from 48.1% (±15.1%) to 10.2% (±6.8%). The maximum reduction of P-gp positivity was observed in Case No. 3, from 76.1% to 5.2% (about one-fifteenth).
The P-gp positivity in AML blast cells (Case No. 8) after oligonucleotide treatment (2.5 μmol/L). Measurement of P-gp using flow cytometry was performed after random (▧), MDR1-S (▧), and MDR1-AS (▪) treatment, and figure represents the mean of two experiments.
The P-gp positivity in AML blast cells (Case No. 8) after oligonucleotide treatment (2.5 μmol/L). Measurement of P-gp using flow cytometry was performed after random (▧), MDR1-S (▧), and MDR1-AS (▪) treatment, and figure represents the mean of two experiments.
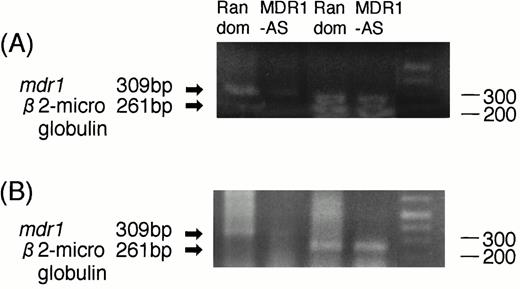
The RT-PCR analysis performed on two AML blast samples showed that the expression of mdr1 mRNA in AML blast cells treated with MDR1-AS (2.5 μmol/L) was decreased compared with that of cells treated with the random oligonucleotide. A typical case is shown in Fig7A (Case No. 9). An equal amount of total RNA was present, as shown by theβ2-microglobulin gene expression in both lanes in this figure. A similar result was obtained in another AML blast cells (Case No. 1).
(A) Expression of mdr1 mRNA on AML blast cells (Case No. 9) after random or MDR1-AS treatment (2.5 μmol/L) by RT-PCR analysis. The ratio ofmdr1/β2-microglobulin in random- and MDR1-AS–treated groups analyzed by scanning densitometry were 2.06 and 0.55, respectively. (B) Expression of mdr1 mRNA of cells from pooled colonies produced by AML blast cells (Case No. 9) treated with random or MDR1-AS oligonucleotide by RT-PCR analysis. The ratio ofmdr1/β2-microglobulin in random- and MDR1-AS–treated groups analyzed by scanning densitometry were 0.93 and 0.58, respectively.
(A) Expression of mdr1 mRNA on AML blast cells (Case No. 9) after random or MDR1-AS treatment (2.5 μmol/L) by RT-PCR analysis. The ratio ofmdr1/β2-microglobulin in random- and MDR1-AS–treated groups analyzed by scanning densitometry were 2.06 and 0.55, respectively. (B) Expression of mdr1 mRNA of cells from pooled colonies produced by AML blast cells (Case No. 9) treated with random or MDR1-AS oligonucleotide by RT-PCR analysis. The ratio ofmdr1/β2-microglobulin in random- and MDR1-AS–treated groups analyzed by scanning densitometry were 0.93 and 0.58, respectively.
P-gp function in MDR1-AS–treated AML blast cells.
As shown in Table 2, intracellular Rh123 retention in MDR1-AS–treated AML blast cells (2.5 μmol/L) increased 1.4- and 1.2-fold, respectively, compared with the untreated cells. These values were apparently higher than those of untreated, random-treated, and MDR1-S–treated cells. As shown in Table 2, the [3H]DNR retention/accumulation ratio of MDR1-AS–treated AML blast cells (2.5 μmol/L) increased 1.8- and 1.2-fold for Cases No. 8 and 9, respectively, and these values were higher than those of untreated, random-treated, and MDR1-S–treated cells.
Sensitivity to DNR of AML blast progenitors in MDR1-AS–treated AML blast cells.
The sensitivity to DNR of oligonucleotide-treated leukemic progenitors were examined in four cases. As shown in Table 1, MDR1-AS–treated AML blast cells (2.5 μmol/L) were more sensitive to DNR than were untreated blast cells and those treated with random or MDR1-S. The D10 ratios of the MDR1-AS–treated blast cells were between 3.0 and 6.4; in contrast, those of the random- and MDR1-S–treated cells were from 0.7 to 1.3, except for MDR1-S–treated cells in case No. 9 (2.2).
mdr1 expression in AML blast colony cells after MDR1-AS treatment.
AML cells from pooled leukemic colonies formed after incubation with DNR were examined for mdr1 mRNA expression. As shown in Fig 7B (Case No. 9), cells in colonies formed from MDR1-AS–treated cells did not express mdr1 mRNA, whereas those from random-treated cells expressed mdr1 mRNA. The levels ofβ2-microglobulin expression were quite similar in the two groups. A similar result was obtained in another AML blast cells (Case No. 1).
Persistence of P-gp suppression after AS treatment.
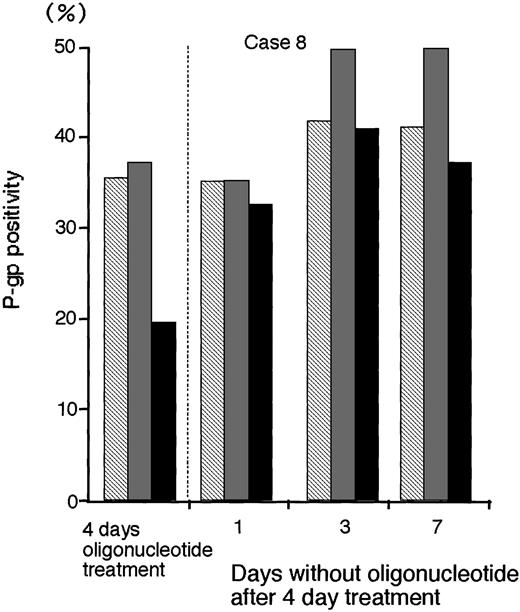
To determine the persistence of P-gp suppression in MDR1-AS–treated AML blast cells (2.5 μmol/L), oligonucleotide-treated cells were washed, incubated at various durations in oligonucleotide-free medium, and analyzed for P-gp expression (Fig 8).After 3 days incubation in oligonucleotide-free medium, P-gp positivity (40.9%) recovered to the levels of P-gp with random- (41.6%) and MDR1-S– (49.6%) treated groups (Case No. 8).
The P-gp positivity in oligonucleotide-treated AML blast cells (Case No. 8; 2.5 μmol/L) after incubation with oligonucleotide-free medium. After random (▧), MDR1-S (▧), and MDR1-AS (▪) treatment, these cells were incubated with oligonucleotide-free medium for 1 to 7 days, and P-gp was measured using flow cytometry. Results represent the mean of two experiments.
The P-gp positivity in oligonucleotide-treated AML blast cells (Case No. 8; 2.5 μmol/L) after incubation with oligonucleotide-free medium. After random (▧), MDR1-S (▧), and MDR1-AS (▪) treatment, these cells were incubated with oligonucleotide-free medium for 1 to 7 days, and P-gp was measured using flow cytometry. Results represent the mean of two experiments.
Effect of MDR1-AS on Bone Marrow Progenitors
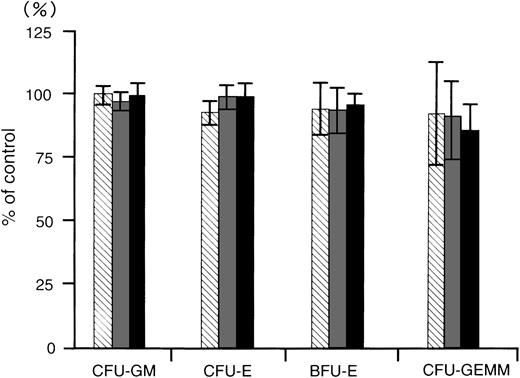
To determine whether the MDR1-AS has any inhibitory effect on normal bone marrow progenitors, we examined the colony growth of bone marrow progenitor cells after MDR1-AS treatment for 4 days. The numbers of colonies produced by the cells treated with random, MDR1-AS, or MDR1-S were expressed as percentages of colonies formed by untreated cells, as shown in Fig 9. The mean CFU-GM colony numbers from untreated cells from four volunteers were 295 ± 34; CFU-E, 408 ± 49; BFU-E, 99 ± 20; and CFU-GEMM, 13 ± 6; respectively. CFU-GM colony numbers from random-, MDR1-S–, and MDR1-AS–treated cells were 294 (99%), 283 (96%), and 293 (100%); CFU-E colony numbers were 379 (93%), 403 (99%), and 404 (99%); BFU-E colony numbers were 91 (95%), 91 (94%), and 92 (96%); and CFU-GEMM colony numbers were 12 (93%), 12 (92%), and 11 (86%); respectively. Colony formation of CFU-GM, CFU-E, BFU-E, and CFU-GEMM was not suppressed by treatment with MDR1-AS nor was it suppressed by MDR1-S or random treatment.
The effect of oligonucleotides on colony formation of normal bone marrow progenitors. Methylcellulose colony assays were performed after oligonucleotide treatment. The oligonucleotides were random (▧), MDR1-S (▧), and MDR1-AS (▪). The results are expressed as the percentage of treated colonies compared with the untreated control. The standard error bars denote the mean ± the SD of the mean of the CFU-GM, CFU-E, BFU-E, and CFU-GEMM. The mean colony numbers of the untreated controls from four experiments were 295 ± 34 for CFU-GM, 408 ± 49 for CFU-E, 99 ± 20 for BFU-E, and 13 ± 6 for CFU-GEMM, respectively.
The effect of oligonucleotides on colony formation of normal bone marrow progenitors. Methylcellulose colony assays were performed after oligonucleotide treatment. The oligonucleotides were random (▧), MDR1-S (▧), and MDR1-AS (▪). The results are expressed as the percentage of treated colonies compared with the untreated control. The standard error bars denote the mean ± the SD of the mean of the CFU-GM, CFU-E, BFU-E, and CFU-GEMM. The mean colony numbers of the untreated controls from four experiments were 295 ± 34 for CFU-GM, 408 ± 49 for CFU-E, 99 ± 20 for BFU-E, and 13 ± 6 for CFU-GEMM, respectively.
DISCUSSION
In the present study, we showed that a lipopolyamine-coated antisense oligonucleotide complementary to mdr1 (MDR1-AS) was effective in inhibiting P-gp expression in AML blast cells. The effectiveness of MDR1-AS use with lipopolyamine was observed not only in adriamycin-resistant K562/ADM cells, but also in blast cells taken from patients with acute leukemia. The maximum suppression of P-gp was obtained with 20 μmol/L MDR1-AS in the K562/ADM cells, and with 2.5 μmol/L MDR1-AS in AML blast cells. The reduction of P-gp was also observed in the K562/ADM cells by Western blot analysis using C219 monoclonal antibody. This is considered to be caused by the reduction of P-gp expression, because K562/ADM did not express mdr3 (our observation). The suppression effect of MDR1-AS was observed not only on P-gp but also on mdr1 mRNA. In the AML blast cells, P-gp positivity was reduced by MDR1-AS treatment to less than 20%, which was considered to be P-gp− in our previous study2 and in others,3 but by only one-fourth in the K562/ADM cells. As mentioned above, the concentration of MDR1-AS necessary for the maximum suppression of P-gp differed between the K562/ADM cells and leukemic blast cells from patients. These results may be explained by the difference in the degree of resistance between K562/ADM cells and leukemic blast cells. They may also be because the half-life of P-gp is reported to be long (T1/2 about 72 hours),27 and the P-gp present at the time of MDR1-AS treatment may have remained after the 96-hour incubation with MDR1-AS, although the AS treatment may suppress newly synthesized P-gp. Our present study showed that the P-gp suppression effect of MDR1-AS recovered to a normal level after 3 to 4 days incubation with oligonucleotide-free medium. We found that P-gp was also slightly suppressed by the sense sequence and random control in K562/ADM cells when high concentrations of the oligonucleotide were used. This may be caused by a non–sequence-specific RNase inhibition effect of phosphrothioate oligonucleotides,12 as reported by Thierry et al9 and Bertram et al.11
Rh123 retention is known as one of the most sensitive assays for P-gp function.2,28 An increase in intracellular Rh123 retention and intracellular [3H] DNR retention in both MDR1-AS–treated cell lines and leukemic blast cells was observed, confirming the inhibition of P-gp function by MDR1-AS. Recently, Li et al29 reported Rh123 retention in verapamil-treated cells was not further increased by AS treatment in vincristine-resistant human lymphoblastic leukemia cell line CCRF-CEM cells.
In our previous study, we showed that leukemic blast progenitors from P-gp+ patients were more resistant to DNR than were those from P-gp− patients.2 This result is supported by the findings of Campos et al.30 In the present study, we investigated whether treatment with MDR1-AS could not only reduce P-gp positivity, but also recover the sensitivity to DNR of leukemic blast progenitors. The D10 values obtained in blast cells after exposure to DNR decreased only in the MDR1-AS–treated cells. The D10 ratios of the MDR1-AS–treated cells increased to a range between 3 and 6, indicating that treatment with MDR1-AS increased the sensitivity to DNR of leukemic blast progenitors by threefold to sixfold. A reduction ofmdr1 mRNA expression was also observed in cells that formed colonies after treatment with MDR1-AS. This suggests that themdr1 mRNA expression of the leukemic progenitors was also decreased, although our data is founded on pooled colonies. It seems unlikely that MDR1-AS is toxic to P-gp+ blast cells, because the viability and cell numbers of blast cells did not change after the treatment with MDR1-AS, MDR1-S, or random oligonucleotide. Some population of P-gp+ leukemic progenitors may be changed from P-gp+ to P-gp− by the treatment of MDR1-AS. Thus, cells from colonies after incubation with DNR may be derived from a larger population of P-gp− progenitors. Because the proliferation of leukemic blast cells is based on a small subset of leukemic blast progenitors,17 31 the recovery of drug sensitivity in leukemic progenitors by MDR1-AS indicates the effectiveness of MDR1-AS treatment in multidrug-resistant acute leukemia.
To increase the cellular uptake and stability of oligonucleotides in serum-containing medium, we used phosphrothioate oligonucleotides and an artificial cationic liposome, lipopolyamine.19 Thierry et al9 showed that liposome-encapsulated oligonucleotides remained homogeneously in cells even after 24 hours. In addition, Wagner13 reported that oligonucleotides complexed with cationic liposome localized preferentially in the cell nucleus, whereas oligonucleotides added alone localized mainly in the cytoplasm. Accordingly, the use of liposome seems to be effective not only for increasing the cellular uptake of oligonucleotides, but also for prolonging the action of oligonucleotides within the nucleus.
Bishop et al32 systemically administered phosphrothioate AS oligonucleotides to p53 in 6 refractory AML patients and 10 advanced myelodysplastic syndrome patients. No patients achieved complete remission, although none showed any complications. Thep53 AS oligonucleotides thus administered in vivo did not reach the concentration which is thought to be effective in vitro except in 3 patients, and this may be one of the reasons for the clinical ineffectiveness observed in the study. Zhao et al33 showed that leukemic cells had greater AS oligonucleotide uptake than did their normal counterparts in vitro; however, it may be more effective to use AS oligonucleotides created to specifically target leukemic blast cells in clinical applications. The application of an antibody such as the anti-HLA class I antibodies34 or transferrin receptor35 combined with AS oligonucleotides and liposome seems to be promising.
Although several investigators reported the effectiveness of AS oligonucleotides against mdr1 in other carcinoma cell lines,9-11 our present results suggest that the use of MDR1-AS is also effective for eliminating P-gp+ leukemic blast cells from patients. The risk of suppression of normal hematopoiesis by AS oligonucleotides is a problem to be dealt with in the clinical use of these oligonucleotides, because it is well known that hematopoietic stem cells (CD34+) express P-gp.36 However, our present results did not show an inhibitory effect of MDR1-AS on normal bone marrow progenitor cells for CFU-GEMM. This may be explained as a result of the small colony numbers of CFU-GEMM. There is another possibility that when an assay for detecting more immature progenitors such as the cobble stone–forming assay or the long-term culture initiating cells assay is used, an inhibitory effect of MDR1-AS may be observed. Treatment withmdr1 AS oligonucleotides and vincristine in mice bearing HL60 leukemia cells resistant to vincristine significantly prolonged the survival of the mice, as recently reported by Cucco and Calabretta.37 Although problems remain to be resolved, our present results suggest that MDR1-AS could be useful to overcome drug resistance in the treatment of leukemia.
ACKNOWLEDGMENT
We thank Dr K. Takeuchi of the Nara Institute of Science and Technology (NAIST), Graduate School of Biological Science for useful technical advice, and I. Yamato for technical assistance. We also thank Dr T. Mekawa of The Institute of Medical Science, University of Tokyo for his critical advice, and David Brown for checking the manuscript.
Supported by a research grant from the Japanese Ministry of Education (Grant No. 06671114).
Address reprint requests to Sayuri Motomura, MD, Department of Hematology, Tokyo Women's Medical College, 8-1, Kawada-cho, Shinjuku-ku, Tokyo, 162-8666, Japan.
The publication costs of this article were defrayed in part by page charge payment. This article must therefore be hereby marked “advertisement” in accordance with 18 U.S.C. section 1734 solely to indicate this fact.

This feature is available to Subscribers Only
Sign In or Create an Account Close Modal