Abstract
We prospectively assessed the pharmacokinetics of methotrexate, mercaptopurine, and erythrocyte thioguanine nucleotide levels in a homogenous population of children with lower risk acute lymphoblastic leukemia and correlated pharmacokinetic parameters with disease outcome. The maintenance therapy regimen included daily oral mercaptopurine (75 mg/m2) and weekly oral methotrexate (20 mg/m2). One hundred ninety-one methotrexate doses and 190 mercaptopurine doses were monitored in 89 patients. Plasma drug concentrations of both agents were highly variable. The area under the plasma concentration-time curve (AUC) of methotrexate ranged from 0.63 to 12 μmol•h/L, and the AUC of mercaptopurine ranged from 0.11 to 8 μmol•h/L. Drug dose, patient age, and duration of therapy did not account for the variability. Methotrexate AUC was significantly higher in girls than boys (P = .007). There was considerable intrapatient variability for both agents. Erythrocyte thioguanine nucleotide levels were also highly variable (range, 0 to 10 pmol/g Hgb) and did not correlate with mercaptopurine dose or AUC. A Cox regression analysis showed that mercaptopurine AUC was a marginally significant (P = .043) predictor of outcome, but a direct comparison of mercaptopurine AUC in the remission and relapsed patient groups failed to show a significant difference. Methotrexate and mercaptopurine plasma concentrations and erythrocyte thioguanine nucleotide levels were highly variable, but measurement of these pharmacokinetic parameters at the start of maintenance will not distinguish patients who are more likely to relapse.
INTERMITTENT oral methotrexate (MTX) and daily oral mercaptopurine (MP) are integral components of maintenance chemotherapy for children with lower risk acute lymphoblastic leukemia (ALL). Both agents are routinely administered in a standard, fixed starting dose, and subsequent dose adjustments are based on ensuing toxicity, primarily myelosuppression or hepatotoxicity. Despite substantial variability in plasma drug concentrations after oral dosing,1 2 therapeutic drug monitoring is not routinely used for individualizing and optimizing dosing of oral MTX and MP.
At standard oral doses of 7.5 to 20 mg/m2, the bioavailability of MTX is highly variable.1,3-5 Peak plasma concentrations can occur from 0.5 to 5 hours after oral administration, and the percentage of the dose that is absorbed ranges from 5% to 97%.1 Absorption from the gastrointestinal tract is also saturable, such that, if the dose of oral MTX is increased, the fraction absorbed declines.6-8
The bioavailability of oral MP is limited by extensive first-pass metabolism of the drug by xanthine oxidase in the liver and intestinal mucosa and averages less than 20%.2 The resulting plasma MP concentrations are also highly variable,2,9,10 and only one third of patients achieve plasma concentrations of MP above the minimal in vitro cytotoxic concentration of 1 μmol/L.11
This substantial degree of pharmacokinetic variability resulting from oral administration of MTX and MP has prompted a number of studies that have attempted to define a relationship between pharmacokinetic parameters and disease outcome. In a prospective analysis of 127 children with ALL randomized to receive oral or intramuscular MTX, there was no relationship between MTX pharmacokinetic parameters, such as peak concentration and area under the plasma concentration-time curve (AUC), and relapse rate.12 Other investigators have reported that MP plasma concentration13and product of the erythrocyte MTX and thioguanine nucleotide levels (TGN)14 were predictive of disease outcome in children with ALL.
MP is a prodrug that must be converted to its nucleotide form intracellularly to exert a cytotoxic effect. Erythrocyte levels of MP-derived TGN have been monitored as a surrogate of leukemic cell levels in children receiving oral MP therapy. Erythrocyte TGN are also highly variable and have been correlated with the degree of myelosuppression and the risk of relapse.15-17
Study populations from these prior reports have included patients from all risk groups or combined patients who had received a variety of treatment regimens. The present study was designed to prospectively evaluate the relationship between the pharmacokinetics of MTX, MP, and erythrocyte TGN and disease outcome in children with lower risk ALL who were treated on the identical standard therapy regimen that included weekly oral MTX and daily oral MP maintenance therapy.
PATIENTS AND METHODS
Patients.
CCG-105PH accrued patients with lower risk ALL who were treated on the standard maintenance therapy regimen from the CCG front line leukemia trials, CCG-104, CCG-105 (regimens 1D and 2D),18 and CCG-139 (regimen 2).19 Patients eligible for CCG-105PH were 12 months to 21 years old, with a white blood cell count (WBC) less than 50,000/μL at diagnosis. Patients with bulky extramedullary disease (lymphoma syndrome) and patients with greater than 10% lymphoblasts with French-American-British (FAB) L2 morphology from the initial diagnostic bone marrow (except for patients who were 2 to 10 years of age with an initial WBC of <10,000/μL) were excluded. Patients receiving chronic anticonvulsant therapy were ineligible for CCG-105PH. Patients who were treated at participating centers were eligible for enrollment on CCG-105PH if they were in continuous remission at the start of maintenance therapy.
Treatment regimen.
All patients on CCG-105PH received identical systemic chemotherapy, which included induction therapy with vincristine at 1.5 mg/m2/wk intravenously (IV) for 4 doses, prednisone at 60 mg/m2/d orally (PO) for 28 days followed by a tapering dose for 14 days (during consolidation), L-asparaginase at 6,000 IU/m2 intramuscularly (IM) for 3 days per week for 9 doses, and 2 doses of intrathecal MTX (dosed according to age) on days 1 and 14 of induction; consolidation therapy with vincristine on day 1, MP at 75 mg/m2/d for 28 days, and intrathecal MTX weekly for 4 doses; and maintenance therapy with daily oral MP at 75 mg/m2, weekly oral MTX at 20 mg/m2, and pulses of vincristine and prednisone at 40 mg/m2/d for 5 days every 4 weeks. Patients on CCG-105, regimen 1D, received 18 Gy of cranial radiation in 10 fractions over the first 2 weeks of consolidation therapy. All other patients received intrathecal MTX on day 1 of each 84-day maintenance cycle.
The starting doses of oral MTX and MP were based on body surface area, and the doses were adjusted during maintenance therapy as prescribed by the primary treatment protocol to maintain the neutrophil count between 1,000 and 2,000/μL and the platelet count above 100,000/μL. Specially prepared 10 mg tablets of MP (Burroughs Wellcome, Research Triangle, NC) were provided to patients on CCG-105PH to improve the accuracy of doses, especially for small children.
Sample collection and processing.
Pharmacokinetic sampling was scheduled to be performed on day 28 of maintenance cycles 1, 2, 4, and 6 (during months 1, 3, 9, and 15 of maintenance therapy). Patients were fasted, except for water, for at least 8 hours before dosing. Patients who were receiving trimethoprim-sulfamethoxazole as pneumocystis prophylaxis had this therapy held for at least 3 days before pharmacokinetic testing. Other chronic medications were allowed but had to be withheld 36 hours before pharmacokinetic testing. The scheduled doses of vincristine and prednisone were administered after all of the pharmacokinetic samples had been drawn.
Patients received their regular oral doses of MP and MTX simultaneously on the morning of the test. Heparinized blood samples were collected before and at 0.5, 1, 2, 3, 4, 6, and 8 hours after the oral doses. Blood samples were kept on ice and centrifuged, and plasma was separated and frozen. The erythrocyte pellet from the pretreatment sample was frozen separately for erythrocyte TGN analysis. All samples were sent on dry ice to the central laboratory at the Pediatric Oncology Branch (POB; National Cancer Institute, Bethesda, MD).
Drug assays.
MTX and MP assays were performed at the POB. MTX concentration was measured using the dihydrofolate reductase inhibition assay.20 MP was measured with a reverse-phase high-pressure liquid chromatography (HPLC) method.2,21 Dithiothrietol (10 μL of a 1.0 mol/L solution) was added to the thawed plasma samples before solid phase extraction. Erythrocyte TGN levels were measured at Children’s Hospital of Los Angeles (Los Angeles, CA). The thawed, lysed erythrocyte pellet was extracted on a mercurial cellulose column and assayed by HPLC with 4-thiouridine as an internal standard.22 Thioguanosine triphosphate was the major intracellular metabolite detected. Because the extraction method depends on binding of the sulfhydryl group to mercury, this method does not detect thio-methylated derivatives of the thiopurines. The amount of TGNs in red blood cells (RBCs) was normalized to the amount of hemoglobin in the sample, because the erythrocytes were lysed by the freezing and thawing process.
Pharmacokinetics and statistical analysis.
The AUC was determined by the linear trapezoidal method and the half-life was derived using regression analysis.23 The skewed distribution of the MTX and MP AUC and the erythrocyte TGN data could be normalized by log transformation; therefore, the geometric mean is reported. The apparent clearance (Cl/F) was derived from dose/AUC. Gender differences and differences between remission and relapsed groups were assessed using the nonparametric Mann-Whitney-U test. For these nonparametric analyses, the mean value for plasma MTX and MP AUCs and erythrocyte TGN from each patient were used. Intrapatient variability was assessed by quantifying the degree of deviation of the AUC from the prior measurement in patients who were monitored on ≥3 maintenance cycles. AUCs were normalized to dose for this analysis. Deviation was calculated using the equation: % Deviation = (AUC2 −AUC1)/AUC1 × 100, whereAUC1 and AUC2 are sequential normalized AUCs measured in the same patient.
The MTX AUC, MP AUC, and erythrocyte TGN were used as time-dependent covariates in a Cox regression analysis of event-free survival. The analyses updated the values each time a patient had a new measurement. Because not all patients had pharmacokinetic monitoring at the designated times, the EGRET (Epidemiological Graphics, Estimation, and Testing) software package (Cytel Software Corp, Cambridge, MA) was used to allow for the actual serum sampling times of each patient in a Cox regression. We tested both the most recent values and the mean of all previous values as predictors of future outcome. Each pharmacokinetic variable was tested for its ability to predict outcome as a continuous variable with an assumed linear effect on the regression and also as a binary variable split into two groups, above and below the median value.
RESULTS
Between January 1984 to January 1991, pharmacokinetic samples were obtained from 89 patients (37 female and 52 male). The median age of the patients at study entry was 4.6 years (range, 1.1 to 17.3 years). Most patients did not have a set of pharmacokinetic samples obtained on all 4 of the designated maintenance cycles. Twenty patients were studied on 4 cycles, 18 were studied on 3 cycles, 15 on 2 cycles, and the remainder on a single cycle. Plasma pharmacokinetics were monitored after a total of 191 doses of MTX and 190 doses of MP, and 148 erythrocyte samples were obtained for TGN. The median dose of MTX was 18.5 mg/m2 (range, 2.1 to 36 mg/m2), and the median dose of MP was 66 mg/m2 (range, 17.5 to 99 mg/m2).
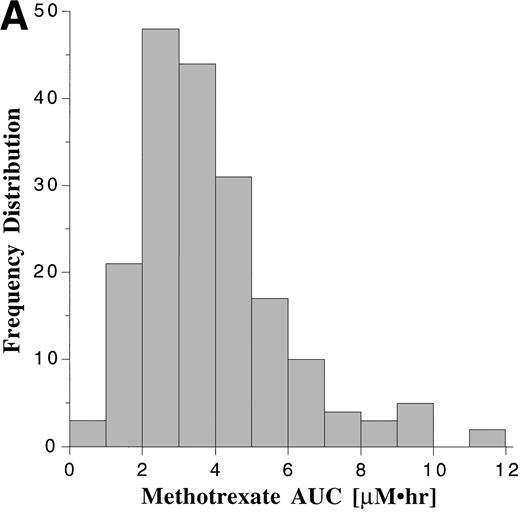
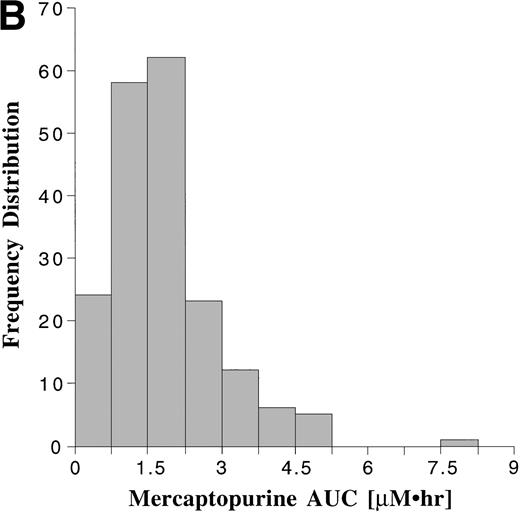
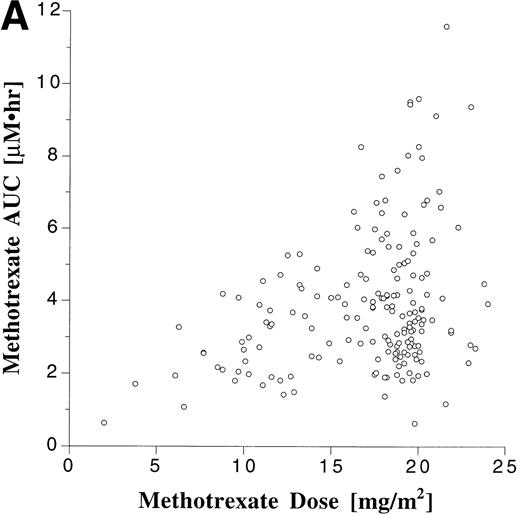
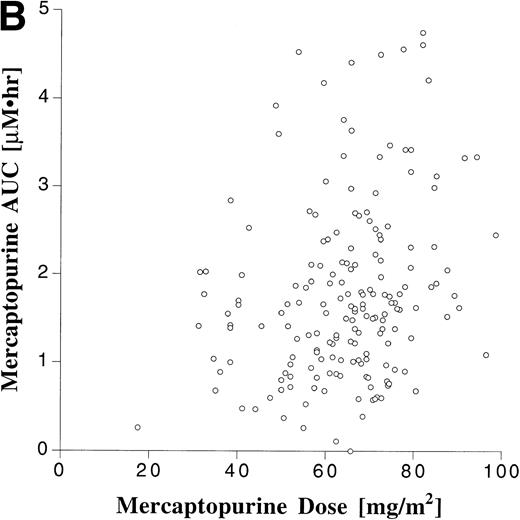
Pharmacokinetic parameters for MTX and MP are summarized in Tables 1 and 2, respectively. There was marked interpatient variability in the AUCs of MTX and MP (Fig 1). The AUC of MTX varied by 20-fold (range, 0.63 to 12 μmol•h/L), and the AUC of MP varied by 70-fold (range, 0.11 to 8.0 μmol•h/L). The dose of MTX and MP varied in these patients, because of adjustments made for toxicities; but there was a poor correlation between AUC and dose for both drugs (Fig 2). There was also no apparent increase or decrease in dose or AUC of MTX and MP over the course of maintenance therapy (Table 3).
Pharmacokinetic Parameters for Oral MTX
| Dose Range (mg/m2) . | n . | . | Cmax (μmol/L) . | AUC (μmol · h/L) . | T1/2 (h) . |
|---|---|---|---|---|---|
| 2.1-36 | 191 | Median | 1.1 | 3.5 | 1.7 |
| Mean* | 1.1 | 3.5 | 1.7 | ||
| Range | 0.10-4.3 | 0.63-12 | 0.70-3.1 | ||
| 1st-3rd Quartile† | 0.83-1.6 | 2.6-4.7 | 1.4-2.0 | ||
| 17.5-22.3 | 106 | Median | 1.2 | 3.6 | 1.7 |
| Mean* | 1.2 | 3.7 | 1.7 | ||
| Range | 0.21-3.1 | 0.63-12 | 1.1-2.9 | ||
| 1st-3rd Quartile† | 0.89-1.6 | 2.8-5.3 | 1.4-2.0 |
The top portion of the table summarizes the parameters derived from all monitored doses (n = 191), and the bottom portion summarizes the same parameters derived only from monitored doses that were within (±) 2.5 mg/m2 of the standard dose of 20 mg/m2 (n = 106).
Geometric mean.
The lower and upper limits of the middle 50% of the data.
Pharmacokinetic Parameters for Oral MP
| Dose Range (mg/m2) . | n . | . | Cmax (μmol/L) . | AUC (μmol · h/L) . | T1/2 (h) . |
|---|---|---|---|---|---|
| 17.5-99 | 190 | Median | 0.54 | 1.6 | 1.2 |
| Mean* | 0.52 | 1.5 | 1.2 | ||
| Range | 0.040-2.3 | 0.11-8.0 | 0.40-3.3 | ||
| 1st-3rd Quartile† | 0.34-0.86 | 1.0-2.2 | 0.90-1.5 | ||
| 65-85 | 89 | Median | 0.59 | 1.8 | 1.3 |
| Mean* | 0.56 | 1.7 | 1.3 | ||
| Range | 0.13-2.3 | 0.39-4.8 | 0.50-3.3 | ||
| 1st-3rd Quartile† | 0.37-0.89 | 1.2-2.5 | 1.0-1.6 |
The top portion of the table summarizes the parameters derived from all monitored doses (n = 190), and the bottom portion summarizes the same parameters derived only from monitored doses that were within (±) 10 mg/m2 of the standard dose of 75 mg/m2(n = 89).
Geometric mean.
The lower and upper limits of the middle 50% of the data.
Frequency distribution of the AUCs of MTX (A) monitored after 191 oral doses ranging from 2.1 to 36 mg/m2 (median, 18.5 mg/m2), and the AUCs of MP (B) monitored after 190 oral doses ranging from 17.5 to 99 mg/m2 (median, 66 mg/m2).
Frequency distribution of the AUCs of MTX (A) monitored after 191 oral doses ranging from 2.1 to 36 mg/m2 (median, 18.5 mg/m2), and the AUCs of MP (B) monitored after 190 oral doses ranging from 17.5 to 99 mg/m2 (median, 66 mg/m2).
Scattergram relating dose to AUC for all monitored doses of oral MTX (A) and MP (B). The correlation coefficients (r) for a linear regression forced through the origin were .23 and .22 for MTX and MP, respectively.
Scattergram relating dose to AUC for all monitored doses of oral MTX (A) and MP (B). The correlation coefficients (r) for a linear regression forced through the origin were .23 and .22 for MTX and MP, respectively.
Median (range) Dose and AUC for MTX and MP by Maintenance Cycle
| Cycle . | Dose (mg/m2) . | AUC (μmol · h/L) . | ||
|---|---|---|---|---|
| MTX . | MP . | MTX . | MP . | |
| 1 | 19 | 69 | 3.2 | 1.7 |
| (7.7-22) | (36-94) | (1.2-12) | (0.5-4.8) | |
| 2 | 19 | 68 | 3.3 | 1.6 |
| (2.1-36) | (35-88) | (0.6-7.0) | (0.3-4.6) | |
| 4 | 17 | 60 | 4.0 | 1.1 |
| (6.3-24) | (18-99) | (1.1-8.0) | (0.3-4.1) | |
| 6 | 18 | 66 | 3.4 | 1.8 |
| (6.1-23) | (31-99) | (1.7-9.4) | (0.1-4.2) | |
Values are the median, with the range in parentheses.
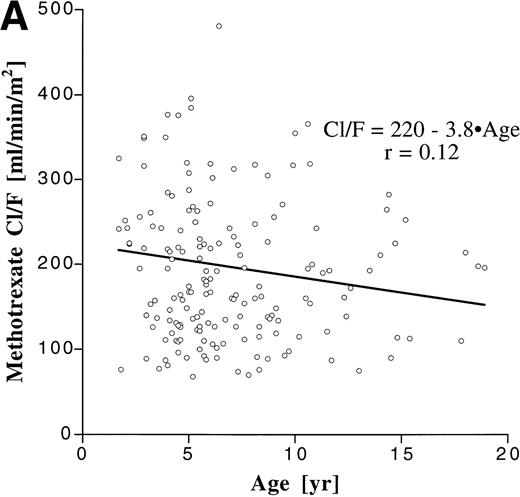
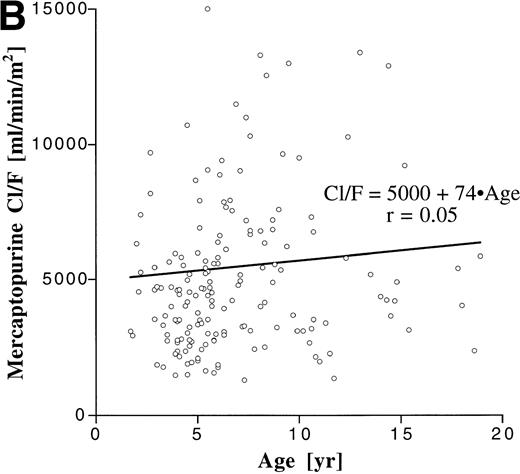
We assessed the influence of age on the degree of interpatient variability by correlating age with apparent clearance, which is a parameter that is dose-independent and incorporates both bioavailability and elimination (Fig 3). Although the patient population encompassed a broad age range, age accounted for only less than 2% of the variability in Cl/F for both MTX (r2 = .014) and MP (r2 = .0025).
Correlation between age and apparent clearance for oral MTX (A) and MP (B).
Gender comparisons for the AUCs of MTX and MP are shown in Table 4. MTX AUCs were significantly higher in girls than in boys, but there were no gender differences for MP. The higher AUC of MTX in girls could not be accounted for by a higher dose of oral MTX.
MTX and MP AUC and Erythrocyte TGN Level in Girls (n = 37) and Boys (n = 52)
| . | Girls4-150 . | Boys4-150 . | P Value . |
|---|---|---|---|
| Age (yr) | 4.1 (1.6-13.8) | 4.9 (1.1-17.3) | |
| MTX dose (mg/m2) | 18 (9.5-21) | 18 (3.8-23) | .25 |
| MTX AUC (μmol · h/L) | 4.0 (1.9-12) | 3.0 (1.1-9.4) | .0074 |
| MP dose (mg/m2) | 66 (33-85) | 68 (18-99) | .28 |
| MP AUC (μmol · h/L) | 1.7 (0.39-4.2) | 1.6 (0.26-8.0) | .71 |
| RBC TGN (pmol/g hgb) | 2.0 (0.16-8.2) | 1.8 (0.32-7.2) | .47 |
Abbreviation: RBC TGN, erythrocyte TGN level.
Values represent the median and range of the mean parameters from each patient.
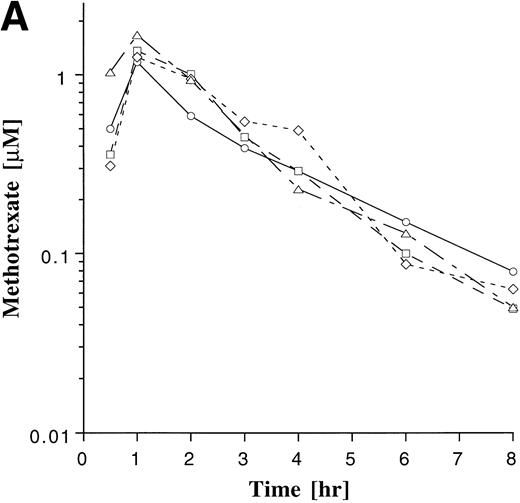
Intrapatient variability of MTX and MP was evaluated in the 38 patients who were monitored on ≥3 cycles of maintenance therapy. The plasma concentration-time profile of MP appeared to be more variable within patients than that of MTX (Fig 4). The coefficient of variation (CV) for the AUCs was derived for each of the 38 patients, and these individual CVs were then averaged for each agent. The average of the individual CVs for MTX and MP were 34% and 45%, respectively. The degree to which AUCs deviated from the previously measured value was also assessed in each patient, as described in Materials and Methods. Subsequent AUC determinations deviated by more than 25% from the previous value in 70% of the subsequent AUC measurements with MTX and in 68% of the subsequent AUC measurements with MP, indicating that a single measurement of the AUC was poorly predictive of subsequent measurements. Regression analysis also showed a poor correlation between baseline and subsequent normalized AUC measurements for MTX (r = .27) and MP (r= .21).
Plasma drug concentration profile for MTX (A) and MP (B) monitored after 4 doses on maintenance cycles 1 (○), 2 (□), 4 (◊), and 6 (▵) in a single patient who was on a stable dose of 20 mg/m2 of MTX and 75 mg/m2 MP. The plots illustrate the greater intrapatient variability with MP.
Plasma drug concentration profile for MTX (A) and MP (B) monitored after 4 doses on maintenance cycles 1 (○), 2 (□), 4 (◊), and 6 (▵) in a single patient who was on a stable dose of 20 mg/m2 of MTX and 75 mg/m2 MP. The plots illustrate the greater intrapatient variability with MP.
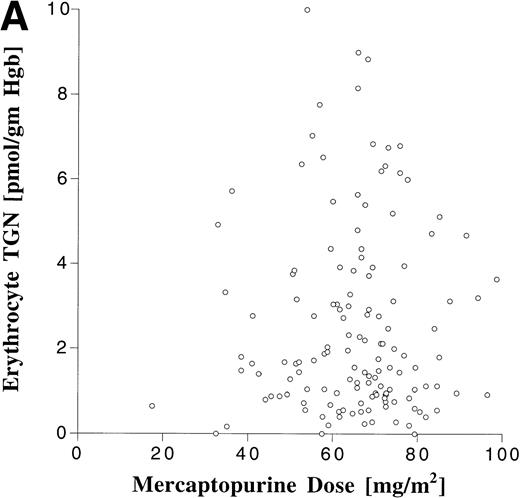
Erythrocyte TGN levels were also highly variable in this patient population (Fig 5). The median erythrocyte TGN from the 148 erythrocyte samples was 1.6 pmol/g hemoglobin (range, 0 to 10 pmol/g hemoglobin). There was no correlation between erythrocyte TGN and MP dose or AUC (Fig 6). When analyzed by maintenance cycle, there was no apparent increase or decrease in the erythrocyte TGN (data not shown). Age (data not shown) and gender (Table 4) did not appear to influence the erythrocyte TGN. Erythrocyte TGN levels were also variable within individual patients over the course of maintenance therapy. Subsequent erythrocyte TGN determinations in patients studied on multiple maintenance cycles deviated by more than 25% from the previous (baseline) value in 75% of the subsequent erythrocyte TGN measurements.
Frequency distribution of the erythrocyte TGN levels in 148 erythrocyte samples obtained during maintenance therapy.
Frequency distribution of the erythrocyte TGN levels in 148 erythrocyte samples obtained during maintenance therapy.
Relationship between erythrocyte TGN level and MP dose (A) and MP AUC (B).
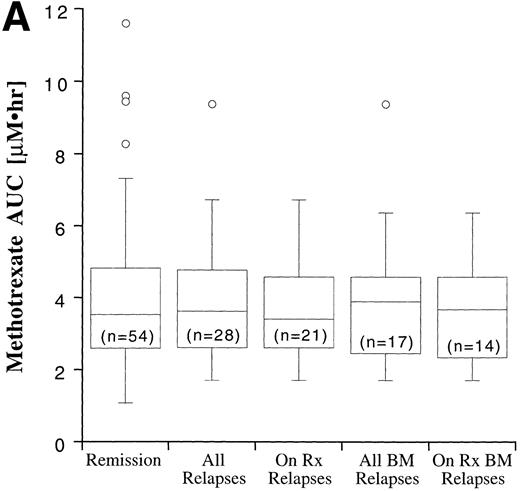
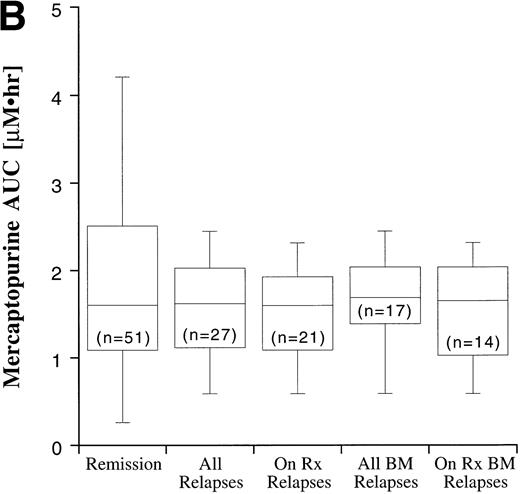
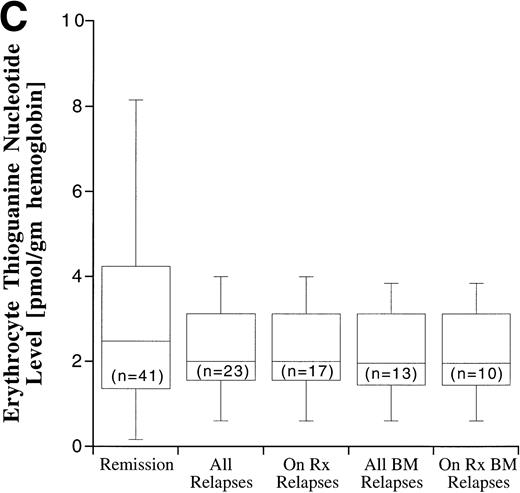
Disease outcome was available in 82 patients. Six patients who were treated according to standard treatment regimen, but not officially enrolled on the CCG trial, and one patient who was enrolled on CCG-105 regimen 1D, but later taken off study and treated with the BFM intensification regimen, were not included in the outcome analysis. The potential duration of follow-up exceeded 60 months. Disease outcome in the patients entered on the CCG-105PH was not significantly different than the outcome of other patients treated on the standard therapy arms of CCG-104, CCG-105, and CCG-139 (P = .82). Fifty-four patients remain in complete remission and 28 have experienced a relapse, including 17 bone marrow relapses, 8 meningeal relapses, and 3 testicular relapses. Twenty-one of the 28 relapses occurred during therapy or within 6 months of the end of maintenance therapy and are considered on-therapy relapses. The MTX and MP AUCs and erythrocyte TGN according to disease status are shown in Fig 7. In all cases, the range of values in the patients who experienced a relapse fell within the range of values for the patients who have remained in complete remission, but median erythrocyte TGN in the relapsed groups was approximately 20% lower than the median from the remission group. There were no statistically significant differences in plasma MTX and MP AUCs and erythrocyte TGN between the relapsed groups (all relapses, bone marrow relapses, extramedullary relapses, on-therapy relapses, and on-therapy bone marrow relapses) and the remission group.
Box plots of MTX AUC (A), MP AUC (B), and erythrocyte TGN level (C) in remission and relapse. AUCs and erythrocyte TGN level are the mean value for each patient. The box represents the 1st to 3rd quartile (the middle 50% of the data), the horizontal line is the median value, the bars represent the range, and the individual points are statistical outliers. On Rx, on therapy (see text for definition); BM, bone marrow.
Box plots of MTX AUC (A), MP AUC (B), and erythrocyte TGN level (C) in remission and relapse. AUCs and erythrocyte TGN level are the mean value for each patient. The box represents the 1st to 3rd quartile (the middle 50% of the data), the horizontal line is the median value, the bars represent the range, and the individual points are statistical outliers. On Rx, on therapy (see text for definition); BM, bone marrow.
Plasma MTX and MP AUCs and erythrocyte TGN were analyzed as time-dependent covariates with event-free survival in a Cox regression analysis. Either the most recent measured value or the mean of all previous values for each patient was used, and these variables were assessed as continuous variables and split into two groups (above and below the median value). The results of the Cox regression analysis are presented in Table 5. MTX AUC was not a statistically significant predictor of event-free survival. The predictive value of MP AUC was of borderline significance (P = .043) only for the mean value as a continuous variable. The regression coefficient was −.43, suggesting that there was a better outcome for children with higher MP AUCs. The most recent MP AUC was not predictive. The most recent value for erythrocyte TGN also showed a trend toward significance as a continuous variable (P = .07). The regression coefficient of −.0068 suggests that children with the highest values had the best outcome. There were no significant correlations when the pharmacokinetic variables were split into two groups.
Cox Proportional Hazards Survival Analysis for MTX AUC, MP AUC, and Erythrocyte TGN Level as Continuous Variables and Split Into Two Groups (above and below the median)
| Variable . | n . | . | Most Recent Value . | Mean Value . | ||
|---|---|---|---|---|---|---|
| P Value . | Hazard Ratio . | P Value . | Hazard Ratio . | |||
| MTX AUC | 74 | Continuous | .981 | 1.002 | .946 | 0.995 |
| Split | .285 | 1.462 | .603 | 1.202 | ||
| MP AUC | 70 | Continuous | .185 | 0.788 | .043 | 0.655 |
| Split | .816 | 0.919 | .390 | 0.733 | ||
| RBC TGN | 63 | Continuous | .070 | 0.993 | .116 | 0.994 |
| Split | .586 | 0.808 | .871 | 0.939 | ||
DISCUSSION
Current empirical dosing methods for oral MTX and MP result in highly variable plasma drug concentrations and erythrocyte TGN levels, as demonstrated by the present study and by other investigators.1-5,9 10 The variability presumably arises primarily from individual differences in bioavailability. Other factors that could contribute to this variability were evaluated in this homogeneous group of patients who were treated on the identical standard therapy regimen. We studied children over a wide age range, but age did not account for the variability. Patients were also monitored throughout maintenance therapy, but there was no apparent relationship between maintenance cycle and MTX or MP AUC. The doses of MTX and MP varied in our patient population because of dose adjustments made in patients experiencing toxicity. However, dose was a poor predictor of AUC for both drugs.
Gender did appear to have some impact on the bioavailability or elimination of MTX. The AUC of MTX was 30% higher in girls compared with boys receiving the same dose. The mechanism for this difference is unclear, but may be related to differences in the carrier-mediated absorption mechanism. In a study of 297 children with ALL, Schmiegelow et al14 reported higher erythrocyte MTX levels in boys than girls, but plasma pharmacokinetics of MTX were not determined in these patients. Plasma drug exposure (AUC) is determined by bioavailability and the rate of drug elimination, whereas intracellular MTX levels are determined by drug uptake into the cell and polyglutamation; therefore, the results from these two studies may not be contradictory. Although girls tend to have a better outcome than boys in most ALL trials, we cannot conclude that this improved outcome is related to a greater exposure to MTX, because we were unable to identify a relationship between MTX AUC and disease outcome.
In the initial subset of 14 patients on the CCG-105PH study, we evaluated MP pharmacokinetics on 2 consecutive days, with and without MTX, and demonstrated that MTX, which is an inhibitor of xanthine oxidase, resulted in a 30% increase in the mean AUC of MP.24 The role of this pharmacokinetic drug interaction in the variability of MP plasma concentrations is probably not significant in this study, because, after the initial measurements on the first 14 patients, all other subjects always received the drugs together for pharmacokinetic monitoring.
We also observed substantial intrapatient and interpatient variability in erythrocyte TGN levels, and the variability was not related to variation in the dose or AUC of MP. Patient age and gender and the maintenance cycle on which the erythrocyte TGNs were measured did not account for the variability. Because erythrocyte TGN levels reflect accumulation over multiple doses, patient compliance could contribute to variability.25 Several patients on our study had undetectable erythrocyte TGN levels on a single measurement, which could be a reflection of poor compliance.
The present study was designed to determine if the substantial variability in pharmacokinetic parameters after standard doses of MTX and MP had an impact on disease outcome in a homogeneous population of patients treated on an identical standard therapy regimen. The hypothesis being tested was that some relapses occur because of subtherapeutic drug concentrations. If a relationship could be identified between pharmacokinetic parameters and disease outcome, then therapeutic levels could be defined and dose adjustments could be based on plasma drug concentrations (therapeutic drug monitoring). An underlying assumption of therapeutic drug monitoring is that plasma concentrations measured after a single dose are representative of drug disposition for subsequent doses. Therefore, intrapatient variability is an impediment to therapeutic drug monitoring. Basing dose adjustments on the plasma concentrations measured after a single dose is not likely to be a successful strategy if the same dose on a different day yields a substantially different result. In patients who were monitored on multiple maintenance cycles, we observed substantial intrapatient variability with both agents; as a result, measuring an AUC of MTX or MP early in maintenance therapy may not be predictive of drug exposure over the entire course of maintenance therapy.
We observed a trend in Cox regression analysis suggesting that higher MP AUC (P = .04) and erythrocyte TGN (P = .07) values were predictive of better disease outcome. The association with MP AUC was marginally significant only for the mean value as a continuous variable. The most recent MP AUC was not predictive, presumably because the intrapatient variability resulted in the single measurements being less predictive of drug exposure over the course of maintenance therapy. The fewer number of monitored doses in this analysis also may have reduced the power of the statistical analysis. In the direct comparison of MTX and MP AUC and erythrocyte TGN level (Fig 7), remission and relapse groups failed to show a significant difference for any of the pharmacokinetic parameters. The range of values in the relapse group overlapped completely with the remission group, indicating that these pharmacokinetic parameters could not prospectively identify patients who are at higher risk of relapse. In addition, without a clear difference between the relapse and remission groups, therapeutic concentrations cannot be defined for these parameters. Because of the substantial degree of intrapatient variability and the inability to define a therapeutic level for any of the pharmacokinetic parameters, this study does not support a role for therapeutic drug monitoring as a dosing strategy for oral MTX and MP.
Prior studies have found a significant relationship between MP pharmacokinetic parameters or a combination of MTX and MP parameters and disease outcome.13-15 Lennard and Lilleyman15 reported that children with ALL whose erythrocyte TGN level was below the median value of 275 pmol/8 × 108 erythrocytes had a significantly higher relapse rate than patients with values above the median. However, the erythrocyte TGN levels in the 19 patients in the relapse group (median, 228 pmol/8 × 108 RBCs; range, 156 to 742 pmol/8 × 108 RBCs) overlapped with values for the total study group of 120 patients (median, 275 pmol/8 × 108 RBCs; range, 126 to 832 pmol/8 × 108 RBCs). The median erythrocyte TGN level was 17% lower in the relapse group, which is similar to the 19% lower levels in our relapsed group, but we did not find a significant difference when patients were split into two groups based on the median erythrocyte TGN level.
Koren et al13 reported that systemic exposure to MP was predictive of outcome in 23 children with low or average risk ALL. However, the MP AUCs in their study were normalized to a dose of 1 mg/m2 (AUC/dose), which is actually the reciprocal of apparent clearance (dose/AUC) rather than a true measure of drug exposure (AUC). The intrapatient variability that we observed would suggest that a single measurement of MP AUC would not be predictive of MP exposure over the course of maintenance therapy.
MTX AUC was not predictive of outcome in this study and a prior trial.12 Schmiegelow et al14 monitored erythrocyte MTX and TGN concentrations over multiple maintenance cycles in children with ALL and found that the product of the erythrocyte MTX and TGN levels, but not the erythrocyte MTX and TGN alone, was predictive of outcome (a higher erythrocyte-MTX • erythrocyte-TGN was associated with a better outcome). However, these investigators used a mean value for these parameters across multiple maintenance cycles that does not account for the influence of intrapatient variability.
Demonstrating a relationship between pharmacokinetic parameters of individual agents and disease outcome is complicated for a disease that is treated with combination chemotherapy. Based on the experience with single-agent therapy in ALL, it is unlikely that an individual agent in the combination regimen accounts for the success or failure of the regimen, and the contribution of each agent may vary from patient to patient based on the underlying sensitivity or resistance to the agents included in the combination regimen.
Despite the high degree of interpatient variability in the pharmacokinetic parameters measured in the present study, we were unable to define a relationship between the plasma pharmacokinetics of MTX and MP or the erythrocyte TGN levels and disease outcome. A relationship between erythrocyte TGN levels and outcome has been observed in prior trials, but the lack of relationship between MP dose and erythrocyte TGN level suggests that modifications of MP dose may not have a predictable or proportional effect on erythrocyte TGN levels. Thus, the current dosing method of increasing or decreasing MTX and MP dose based on each patient’s blood counts may still be the most rational dosing method.
Participating Principal Investigators—Children’s Cancer Group (Institution, Investigators, Grant No.): Group Operations Center, Arcadia, CA, W. Archie Bleyer, MD, Anita Khayat, PhD, Harland Sather, PhD, Mark Krailo, PhD, Jonathan Buckley, MBBS, PhD, Daniel Stram, PhD, Richard Sposto, PhD, CA 13539; University of Michigan Medical Center, Ann Arbor, MI, Raymond Hutchinson, MD, CA 02971; University of California Medical Center, San Francisco, CA, Katherine Matthay, MD, CA 17829; Children’s Hospital & Medical Center, Seattle, WA, Ronald Chard, MD, CA 10382; Children’s Hospital of Los Angeles Los Angeles, Los Angeles, CA, Jorge Ortega, MD, CA 02649; Vanderbilt University School of Medicine, Nashville, TN, John Lukens, MD, CA 26270; Doernbecher Memorial Hospital for Children, Portland, OR, Lawrence Wolff, MD, CA 26044; University of Minnesota Health Science Center, Minneapolis, MN, William Woods, MD, CA 07306; University of Texas Health Sciences Center, San Antonio, TX, Thomas Williams, MD, CA 36004; Memorial Sloan Kettering Cancer Center, New York, NY, Peter Steinherz, MD, CA 42764; James Whitcomb Riley Hospital for Children, Indianapolis, IN, Philip Breitfeld, MD, CA 13809; Children’s Hospital Medical Center, Cincinnati, OH, Robert Wells, MD, CA 26126; Harbor/UCLA & Miller Children’s Medical Center, Torrance/Long Beach, CA, Jerry Finklestein, MD, CA 14560; Children’s Hospital of Denver, Denver, CO, Lorrie Odom, MD, CA 28851; Izaak Walton Killam Hospital for Children, Halifax, Canada, Dorothy Barnard, MD; University of North Carolina Chapel Hill, Chapel Hill, NC, Joseph Wiley, MD.
For research support, see .
The publication costs of this article were defrayed in part by page charge payment. This article must therefore be hereby marked “advertisement” in accordance with 18 U.S.C. section 1734 solely to indicate this fact.
REFERENCES
Author notes
Address reprint requests to Frank M. Balis, MD, Pediatric Oncology Branch, NCI, Bldg 10, Room 13N240, 10 Center Dr, MSC 1928, National Institutes of Health, Bethesda, MD 20892-1928; e-mail:balisf@nih.gov.




This feature is available to Subscribers Only
Sign In or Create an Account Close Modal