Abstract
The pattern of expression of several protein kinase C (PKC) isoforms (, βΙ, δ, ɛ, η, and ζ) during the course of hematopoietic development was investigated using primary human CD34+ hematopoietic cells and stable cell lines subcloned from the growth factor-dependent 32D murine hematopoietic cell line. Each 32D cell clone shows the phenotype and growth factor dependence characteristics of the corresponding hematopoietic lineage. Clear-cut differences were noticed between erythroid and nonerythroid lineages. (1) The functional inhibition of PKC-ɛ in primary human CD34+ hematopoietic cells resulted in a twofold increase in the number of erythroid colonies. (2) Erythroid 32D Epo1 cells showed a lower level of bulk PKC catalytic activity, lacked the expression of ɛ and η PKC isoforms, and showed a weak or absent upregulation of the remaining isoforms, except βΙ, upon readdition of Epo to growth factor-starved cells. (3) 32D, 32D GM1, and 32D G1 cell lines with mast cell, granulo-macrophagic, and granulocytic phenotype, respectively, expressed all the PKC isoforms investigated, but showed distinct responses to growth factor readdition. (4) 32D Epo 1.1, a clone selected for interleukin-3 (IL-3) responsiveness from 32D Epo1, expressed the ɛ isoform only when cultured with IL-3. On the other hand, when cultured in Epo, 32D Epo1.1 cells lacked the expression of both ɛ and η PKC isoforms, similarly to 32D Epo1. (5) All 32D cell lines expressed the mRNA for PKC-ɛ, indicating that the downmodulation of the ɛ isoform occurred at a posttranscriptional level. In conclusion, the PKC isoform expression during hematopoiesis appears to be lineage-specific and, at least partially, related to the growth factor response.
THE INTERLEUKIN-3 (IL-3)–dependent 32D cell line1 is multipotent in that factor-dependent subclones have been obtained under selective culture conditions in vitro.2 Subclones responsive to and dependent for growth upon granulocyte-macrophage colony-stimulating factor (GM-CSF) 32D GM1, granulocyte colony-stimulating factor (G-CSF) 32D G1, and erythropoietin (Epo) 32D Epo1 have been isolated.2 Each of these subclones shows a specific phenotype. Parental 32D and the subclones 32D GM1, 32D G1, and 32D Epo1 have predominantly mast cell, granulo-macrophagic, granulocytic, and erythroid features, respectively. 32D Epo1.1 is an IL-3–dependent revertant of 32D Epo12 3 that shows the ability to proliferate in the presence of IL-3 or Epo. Whereas 32D G1 cells are strictly dependent on G-CSF for their growth, as 32D Epo1 from Epo, 32D GM1 can be cultured equally well in GM-CSF or IL-3.
All of these cell lines, which have the same diploid genotype and do not induce tumors when injected into syngeneic recipients, have the features of the lineages characteristic of the growth factors they are supported by.2,3 The most terminally differentiated cell lines (the G-CSF– and Epo-dependent subclones) cannot be interconverted, ie, Epo-dependent subclones will not give rise to G-CSF–dependent clones and vice versa. Thus, the lineage commitment of the cells on which the relevant growth factors work appears univocally determined, although 32D Epo1 cells can give rise with low frequency to IL-3–dependent revertants (such as 32D Epo1.1).4Therefore, these cell lines represent an optimal model to explore the relationships existing between a given hematopoietic phenotype and the effect of a specific growth factor.
The intracellular signal transduction pathways elicited by the different hematopoietic growth factors is now delineated in some details.5 An important role in mediating at least some of the pleiotropic effects of hematopoietic growth factors on the survival, growth, and differentiation of their target cells is thought to be played by members of the protein kinase C (PKC) family of serine/threonine kinases.6 PKC enzymes are well-conserved among species, participate in signal transduction in many cells, and mediate a wide number of intracellular functions. At least 12 different isoforms of PKC have been characterized so far,7,8 and these have been grouped into three categories based on Ca2+ requirement for activation and phorbol ester binding activity. Conventional PKCs (α, βΙ, βΙΙ, and γ) are Ca2+-dependent phorbol ester receptor/kinases; novel PKCs (δ, ε, θ, and η) are Ca2+-independent phorbol ester receptor/kinases; and atypical PKCs (ζ, ι, λ, and μ) are kinases independent of both Ca2+ and phorbol esters. Most PKC isoforms exist in an inactive form in the cytosol of resting cells, with an amino-terminal pseudosubstrate sequence occupying the active site. The generation of diacylglycerol (DAG) causes redistribution of conventional and novel PKC isoforms to the membrane by binding the regulatory domain of the kinase. It is believed that ceramide plays a similar role in the activation of the atypical PKC-ζ isoform.9
The primary aims of this study were to compare the presence and distribution of various PKC isoforms in hematopoietic cells of different lineages and to evaluate how their expression is affected by the lineage-specific growth factors.
MATERIALS AND METHODS
Primary human CD34 hematopoietic progenitor cells.
Informed consent to the study was obtained according to the Helsinki declaration of 1975 from six normal donors. Mononuclear cells were isolated from leukapheresis units by Ficoll-Paque (d = 1.077 g/mL; Pharmacia, Uppsala, Sweden) and adherence-depleted overnight. After removal of adherent cells, CD34+ cells were isolated using a magnetic cell sorting program Mini-MACS (Miltenyi Biotec, Auburn, CA) and the CD34 isolation kit in accordance with the manufacturer’s recommendations. The purity of CD34-selected cells was determined for each isolation by flow cytometry using a monoclonal antibody that recognizes a separate epitope of the CD34 molecule (HPCA-2; Becton Dickinson, San Jose, CA) followed by a goat antimouse IgG directly conjugated to fluorescein (GAM-FITC). CD34+ cells averaged about 90% to 98%. Freshly isolated CD34+ cells were either subjected to Western blot analysis or assayed in semisolid culture for clonogenic progenitors.
Assay for primary human clonogenic cells.
CD34+ cells (105) were seeded in 300 μL of medium containing 75 μg of an inhibitor peptide (H-Glu-Ala-Val-Ser-Leu-Lys-Pro-Thr-OH; Calbiochem, La Jolla, CA) that specifically blocks the translocation of PKC-ε from the cytosol to the cell membrane for 2 hours at room temperature. This procedure was slightly modified with respect to the original description, in which the peptide inhibitor was used in cardiomyocytes.10 In particular, the transient permeabilization step with saponin or other detergent was avoided, because it resulted in being extremely toxic for primary hematopoietic cells. Moreover, the time of exposure of CD34+ cells to the peptide was prolonged to 2 hours before performing semisolid cultures. A myelin basic protein peptide substrate (H-Ala-Pro-Arg-Thr-Pro-Gly-Gly-Arg-Arg-OH; Calbiochem) was used as a control peptide. Colony assays for erythroid (burst-forming unit-erythroid [BFU-E]) and granulocyte-macrophage (colony-forming unit–granulocyte-macrophage [CFU-GM]) were performed in serum-free fibrinclot cultures as previously described.11Briefly, 10,000 CD34+ cells were seeded in Iscove’s modified Dulbecco’s medium (IMDM), supplemented with 300 μg/mL iron-saturated transferrin, 3 mg bovine serum albumin (BSA), 280 μg/mL CaCl2, 10−4 mol/L BSA-adsorbed cholesterol, 20 μg of L-asparagine, 1.7 × 10⁶ mol/L insulin, nucleosides (10 μg/mL each), 0.1 mL of 0.2% (wt/vol) purified fibrinogen resuspended in phosphate-buffered saline (PBS), and 0.1 mL of 0.2 U/mL purified human thrombin (95%) in PBS. All reagents, except fibrinogen, which was provided by Kabi (Stockholm, Sweden), were purchased from Sigma (St Louis, MO).
Pure erythroid and mixed granulocyte-macrophage colonies were identified in situ according to standard morphological criteria at the day of maximal growth (12 to 14 days). Whereas BFU-E were readily detectable for the presence of hemoglobin, for the identification of CFU-GM, fibrinclots were fixed and stained with Wright-Giemsa.
Cell lines and cytokines.
The murine 32D cell line and its subclones were maintained at 37°C in a 5% CO2 atmosphere and split biweekly in Kircade medium supplemented with 15% horse serum (Defined HS; HyClone, Logan, UT) plus 15% fetal calf serum (Defined FCS; HyClone) plus 1% (vol/vol) conditioned medium of a CHO line transfected with the murine IL-3 gene (CHO; Genetics Institute, La Jolla, CA; 32D, 32D GM1, and 32D Epo1.1), 100 ng/mL of recombinant human G-CSF (Genzyme, Cambridge, MA; 32D G1), and 1.5 U/mL recombinant human Epo (Globuren, Dompè, France; 32D Epo1 and 32D Epo1.1), as previously described.2 3 Cells were kept at an optimal cell density comprising between 0.05 and 0.9 × 10⁶/mL.
In the experiments aimed to evaluate the effect of specific growth factors on PKC isoform expression, cells were first cultured for 4 hours in medium deprived of growth factors. At this time point of growth factor starvation, the number of apoptotic cells was constantly less than 10%, whereas longer periods of starvation induced a significant increase of apoptosis that interfered with the subsequent preparation of cell homogenates and Western blot analysis.12 After readdition of the growth factors, the cells were collected at 15, 30, and 60 minutes.
In some experiments, 2 × 10⁵ 32D cells were pretreated with 75 μg of the PKC-ε inhibitor or control peptide (Calbiochem) in 300 μL of Kircade for 2 hours at room temperature and then cultured in the presence of IL-3 or Epo, as described above. The total number of viable cells was scored at days 4 (IL-3) and 7 (Epo) of culture.
Preparation of cell homogenates and fractions.
Cell homogenates were prepared as previously described.13Freshly isolated human CD34+ cells and 32D cell lines were initially washed twice with cold (4°C) medium, resuspended in a lysis buffer (10 mmol/L Tris-HCl, pH 7.4, 10 mmol/L NaCl, 2 mmol/L MgCl2, 5 μg/mL leupeptin, 1 μg/mL aprotinin, 10 μg/mL soybean trypsin inhibitor, 1 mmol/L phenylmethylsulfonyl fluoride, 0.1 mmol/L sodium orthovanadate, and 20 nmol/L okadaic acid, all from Sigma) for 30 minutes at 4°C and then passed through a 22-G needle and centrifuged for 10 minutes at 1,000 rpm at 4°C. Pellets containing predominantly nuclei were discharged. Supernatants containing most membrane and cytoplasmic proteins were subjected to Western blot analysis.
In some cases, fractionation experiments were performed following a previously described technique.14 32D cells (8 × 10⁶/experimental point) were incubated for 4 hours in the absence of IL-3. During the last 2 hours of starvation, cells were supplemented with 1 mg of the PKC-ε inhibitor or the control peptide and then supplemented with 1% IL-3 for 30 minutes. Cells were then harvested in 100 μL of lysis buffer without Triton X-100, sonicated, and centrifuged at 100,000g for 60 minutes at 4°C. The supernatants were collected as the cytosolic or soluble fractions. The pellets were solubilized in 100 μL of lysis buffer containing 0.1% Triton X-100 and centrifuged again at 100,000gfor 1 hour at 4°C. These supernatants were harvested as the membrane fractions.
Anti-PKC isoform-specific antibodies and Western blot analysis.
Rabbit peptide-specific antibodies (IgG fraction) that recognize PKC α, βΙ, δ, ε, η, and ζ isoforms were from Santa Cruz Biotechnologies (Santa Cruz, CA). Equal amounts of proteins, determined by Bradford assay (Bio-Rad Labs, Munchen, Germany) were diluted 1:3 with 4× loading buffer (250 mmol/L Tris-HCl, pH 6.8, 20% β-mercaptoethanol, 40% glycerol, 8% Na deoxycholate, and 0.003% bromophenol blue) and subjected to sodium dodecyl sulfate-polyacrylamide gel electrophoresis (SDS-PAGE) on 7.5% gel. Gels were then transferred to nitrocellulose membrane by Trans-Blot (Bio-Rad). SDS-PAGE and transfer were performed according to the manufacturer’s recommendations. Equal loading of each fraction was verified by staining duplicate gels with Coomassie Brilliant Blue R-250 (Sigma). The membranes were incubated in PBS, supplemented with 3% (wt/vol) BSA (Sigma) for 30 minutes at room temperature, and then incubated overnight at 4°C with anti-α (dilution, 1:500), -βΙ (dilution, 1:500), -δ (dilution, 1:50), -ε (dilution, 1:250), -η (dilution, 1:125), and -ζ (dilution, 1:500) isoform-specific antibodies. After four washings with PBS/0.1% Tween 20/0.1% BSA, peroxidase-conjugated goat antirabbit IgG antibody (1:1,500; Cappel, Durham, NC) was applied to the membrane for 60 minutes at room temperature. Bound antibody was visualized by the ECL Western blotting detection reagents and Hyperfilm-ECL luminescence detection film (Amersham Corp, Arlington Heights, IL). Semiquantitative densitometric analysis was performed with an imaging densitometer (Model GS 670; Bio-Rad) using the Molecular Analyst software (Bio-Rad).
The following criteria were used to confirm that the immunostaining was specific for the monitored enzymes.13 No immunostaining was obtained by antibodies preadsorbed with 1 mg of the corresponding immunizing peptide. When the blots were stripped, reblocked, and reprobed with antibodies, which had been previously incubated 1:1 for 10 minutes with the corresponding immunizing peptide (1 mg/mL), the specific peptide blocked immunoreactivity.
Assay of PKC activity.
Cells were washed twice with cold (4°C) PBS and directly resuspended in a lysis buffer (20 mmol/L Tris-HCl, pH 7.4, 137 mmol/L NaCl, 10% glycerol, 0.1% SDS, 0.5% Na deoxycholate, 1% Triton X-100, 2 mmol/L EDTA, 1 mmol/L phenylmethylsulfonyl fluoride, plus inhibitors of proteases and phosphatases) for 20 minutes. One hundred micrograms of proteins were incubated at 37°C for 10 minutes in a reaction mixture containing 50 mmol/L Tris-HCl, pH 7.4, 5 mmol/L MgCl2, 0.3 mmol/L dithiothreitol, 100 μmol/L sodium orthovanadate, 100 μmol/L CaCl2, 5 μg/mL DAG, 100 μg/mL phosphatidylserine, 13 μmol/L ATP, and 1 μCi of γ(32P)ATP in a final volume of 50 μL. PKC activity was assayed by measuring the incorporation of 32Piinto a serine substituted peptide corresponding to amino acids 19 through 36 of PKC (UBI, Lake Placid, NY). The reactions were stopped with an appropriate volume of 4× loading buffer, boiled 5 minutes, and electrophoresed on 18% PAGE. The gels were stained with Coomassie R-250, destained, and autoradiographed on Kodak X-OMATS S films (Eastman Kodak, Rochester, NY). Under these conditions, the peptide was clearly separated and migrated to the bottom of the gel according to the calculated molecular weight (2.342 kD, dephosphorylated form). The peptide spots were excised and radioactivity was counted in a liquid scintillation counter.
RNA isolation, reverse transcription, and polymerase chain reaction (PCR) amplification.
Total RNA was prepared with the commercial (Trizol; GIBCO, Paisley, UK) guanidine thiocyanate/phenol protocol15 and reverse transcribed (1 μg RNA/reaction) at 42°C for 30 minutes in 20 μL of 10 mmol/L Tris-HCl, pH 8.3, containing 5 mmol/L MgCl2, 1 U RNAse inhibitor, dNTPs (200 μmol/L each), 2.5 U cloned Moloney murine leukemia virus reverse transcriptase, and 2.5 μmol/L random hexamers (all from Perkin-Elmer, Norwalk, CT). An aliquot of the cDNA (2.5 μL corresponding to 125 ng of total RNA) was dissolved in 10 mmol/L Tris-HCl, pH 8.3, containing 2 mmol/L MgCl2, dNTPs (200 μmol/L each), 2 U AmpliTaq DNA polymerase (final volume, 100 μL), and the sense and antisense primers (100 nmol/L each) specific for each isoform of human PKC.16 As an internal control of the PCR amplification, the primers specific for the β-actin cDNA (50 nmol/L each) were added to each tube after the first 20 cycles of amplification as described.17 The amplification reactions were performed in a PTC-100 Thermocycler (MJ Research Inc, Watertown, MA) with the following parameters: denaturing for 60 seconds at 95°C, annealing for 60 seconds at 60°C, and primer extension for 60 seconds at 72°C. Two positive controls (whole human cord blood and murine bone marrow cDNA) and a negative control (H2O) were included in each amplification. The amplification products were separated on standard 1.5% agarose gel and evidentiated by ethidium staining. All the procedures were performed according to standard protocols.18
Statistical analysis.
The results were expressed as means ± standard deviations (SD) of three or more experiments performed in duplicate. Statistical analysis was performed using the two-tailed Student’s t-test for unpaired data.
RESULTS
Enhancing effect of a PKC-ε peptide inhibitor on the development of human erythroid colonies and Epo-dependent 32D cells.
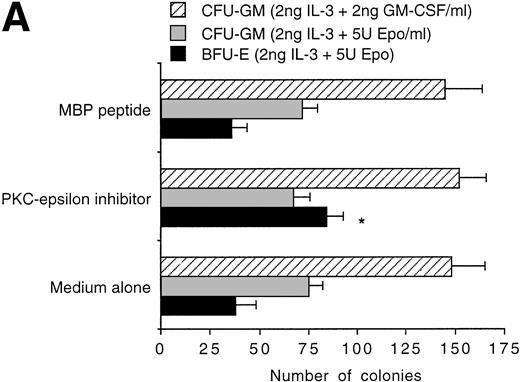
The pattern of PKC isoform expression was evaluated by Western blot analysis in primary human CD34+ hematopoietic progenitor cells (Fig 1). Among the PKC isoforms analyzed, CD34+ cells showed a specific expression of isoforms belonging to classical (α and βΙ), novel (δ, ε, and η), and atypical (ζ) groups. Because previous studies performed on both human and murine erythroleukemic cells have shown that modulation of PKC-ε may play a prominent role in erythroid maturation,19-21primary CD34+ cells were pretreated with a recently described inhibitory peptide, which specifically blocks PKC-ε activation,10 for 2 hours at room temperature and then seeded in semisolid culture. At the end of the incubation period, a twofold increase (P < .01) in the yield of erythroid colonies was observed in the presence of PKC-ε inhibitory peptide, but not in the presence of a chemically similar control peptide (Fig 2A). It is noteworthy that the PKC-ε inhibitory peptide was unable to induce any modification in the number of nonerythroid colonies, independently of the cytokine combination added in culture (Fig 2A).
Western blot analysis of PKC-, βΙ , δ, ɛ, η, and ζ isoforms in homogenates obtained from freshly isolated CD34+ cells. Isoform-specific antibodies were added to the membranes in the absence (left of each couple lanes) or presence of the corresponding immunizing peptide (right of each couple of lanes). A representative of three separate experiments is reported.
Western blot analysis of PKC-, βΙ , δ, ɛ, η, and ζ isoforms in homogenates obtained from freshly isolated CD34+ cells. Isoform-specific antibodies were added to the membranes in the absence (left of each couple lanes) or presence of the corresponding immunizing peptide (right of each couple of lanes). A representative of three separate experiments is reported.
Effect of PKC-ɛ inhibitory peptide on the growth of erythroid (BFU-E) and granulo-macrophagic (CFU-GM) colonies (A) and the translocation of PKC-ɛ to the membrane fraction (B). In (A), data are expressed as the means ± SD of three separate experiments performed in triplicate. A statistically significant (*P < .01) increase in the number of BFU-E was noticed in the presence of the PKC-ɛ inhibitory peptide. In (B), Western blot analysis of PKC-ɛ in the fractionated lysates of untreated and IL-3–treated 32D cells cultured in the presence or absence of PKC-ɛ inhibitory peptide or control peptide. S, soluble fractions. M, membrane fractions.
Effect of PKC-ɛ inhibitory peptide on the growth of erythroid (BFU-E) and granulo-macrophagic (CFU-GM) colonies (A) and the translocation of PKC-ɛ to the membrane fraction (B). In (A), data are expressed as the means ± SD of three separate experiments performed in triplicate. A statistically significant (*P < .01) increase in the number of BFU-E was noticed in the presence of the PKC-ɛ inhibitory peptide. In (B), Western blot analysis of PKC-ɛ in the fractionated lysates of untreated and IL-3–treated 32D cells cultured in the presence or absence of PKC-ɛ inhibitory peptide or control peptide. S, soluble fractions. M, membrane fractions.
Parallel experiments were performed on the multipotent 32D cell line, which shows the ability to give rise to factor-dependent subclones in the presence of specific cytokines.1 When 2 × 10⁵ 32D cells were exposed to the PKC-ε inhibitory peptide for 2 hours and then seeded in liquid culture in the presence of IL-3 or Epo, the total number of viable cells scored in IL-3–containing cultures at various days of culture was similar in the presence or absence of the PKC-ε inhibitory peptide (27.6 × 10⁵v 28 × 105, respectively, at day 4). On the other hand, the total number of viable cells scored in Epo-containing cultures was significantly (P < .01) higher in the presence than in the absence of the PKC-ε inhibitory peptide (190 × 104v 6.4 × 10⁴, respectively, at day 7). Furthermore, the specificity of the PKC-ε inhibitory peptide was formally demonstrated in experiments performed on parental 32D cells, in which the amount of PKC-ε translocated to the membrane in response to 30 minutes of treatment with IL-3 was significantly reduced in the presence of the PKC-ε peptide inhibitor but not in the presence of the control peptide (Fig2B).
Selective expression of PKC isoforms in various hematopoietic lineages.
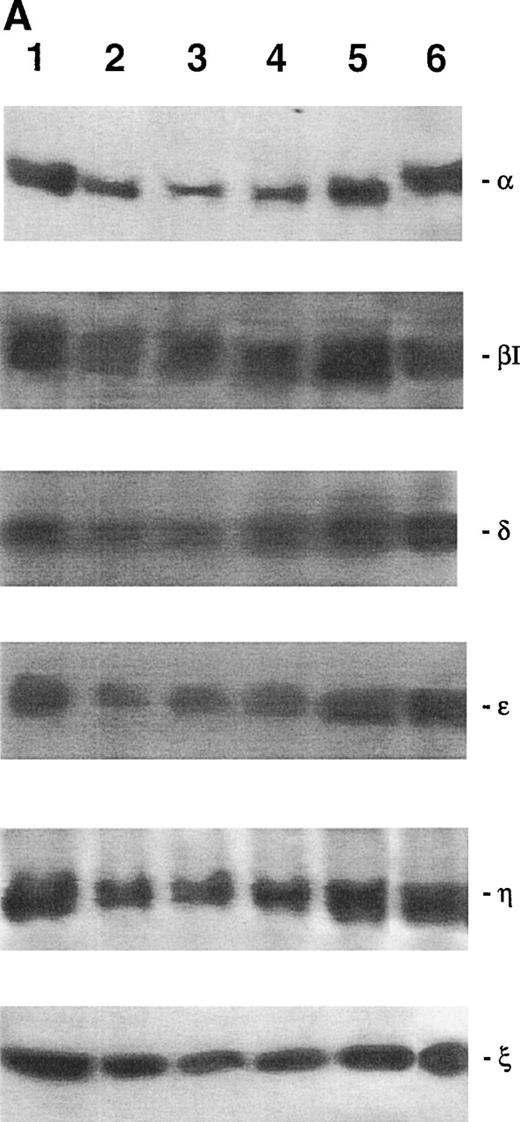
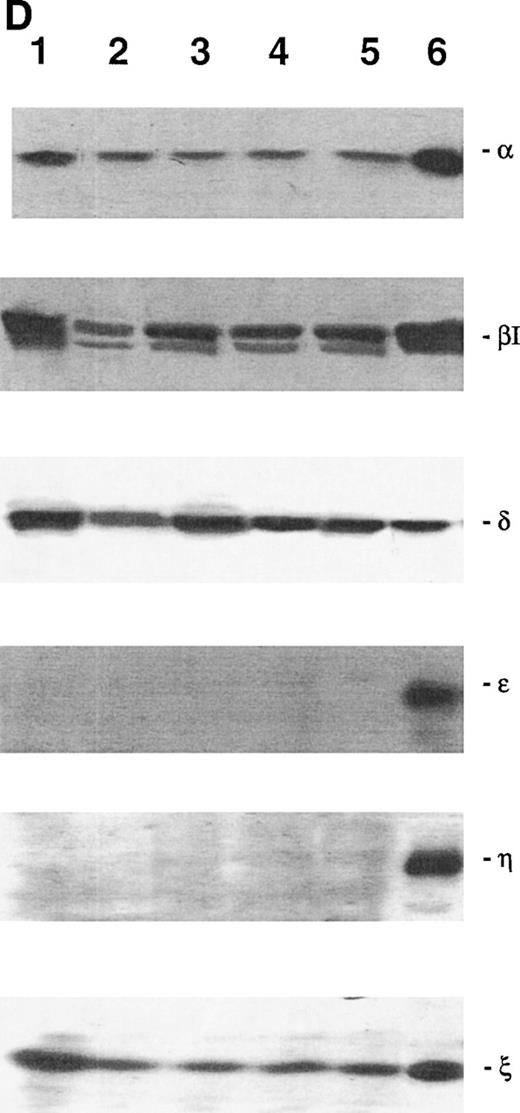
Because the previous data strongly suggest that the modulation of PKC-ε activity is an important step for erythroid development, the next groups of experiments were performed using, as a model system, the 32D, 32D GM1, 32D G1, and 32D Epo1 murine cell clones (Fig 3A through D). A specific expression pattern of PKC isoforms was observed in the lineage-restricted 32D cell lines. PKC isoforms α, βΙ, δ, ε, η, and ζ were all expressed in the mast cell (Fig 3A), granulo-monocytic (Fig 3B), and granulocytic (Fig3C) lineages. The erythroid cell lines only expressed α, βΙ, δ, and ζ, but not ε and η (Fig 3D).
Western blot analysis of PKC-, βΙ, δ, ɛ, η, and ζ isoforms in homogenates obtained from 32D (A), 32D GM1 (B), 32D G (C), and 32D Epo1 (D) cell lines. Cells were examined before (lane 1) and after 4 hours of serum-starvation (lanes 2 through 5) in the absence (lane 2) or presence of the specific growth factor that was readded for 15 (lane 3), 30 (lane 4), and 60 (lane 5) minutes. The positive control was represented by a rat brain homogenate (lane 6). A representative of five separate experiments is reported.
Western blot analysis of PKC-, βΙ, δ, ɛ, η, and ζ isoforms in homogenates obtained from 32D (A), 32D GM1 (B), 32D G (C), and 32D Epo1 (D) cell lines. Cells were examined before (lane 1) and after 4 hours of serum-starvation (lanes 2 through 5) in the absence (lane 2) or presence of the specific growth factor that was readded for 15 (lane 3), 30 (lane 4), and 60 (lane 5) minutes. The positive control was represented by a rat brain homogenate (lane 6). A representative of five separate experiments is reported.
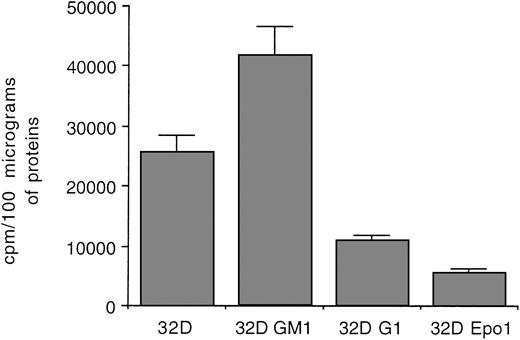
Because most PKC isoforms show similar substrate specificities, reflecting the conservation of the substrate binding site,6we next performed an assay using a serine substituted peptide of the amino-terminal region of PKC to investigate the whole PKC catalytic activity in cell homogenates obtained from the various 32D subclones (Fig 4). Although some variability in the basal PKC catalytic activity was noticed among 32D cell lines, 32D Epo1 showed markedly lower levels with respect to all the nonerythroid cell lines investigated. The absence of ε and η isoforms likely accounts for the lower levels of PKC catalytic activity observed in erythroid cell lines in comparison with the other cell clones (Fig 3). In this respect, we have previously demonstrated the existence of a strict positive correlation between the amount of a given isoform observed at Western blot analysis and the catalytic activity immunoprecipitated by the same isoform-specific antibody.13
Assay of PKC catalytic activity in homogenates obtained from various 32D subclones. Data are reported as the means ± SD of three separate experiments performed in duplicate.
Assay of PKC catalytic activity in homogenates obtained from various 32D subclones. Data are reported as the means ± SD of three separate experiments performed in duplicate.
Effects of growth factor starvation and readdition on PKC isoform expression.
The various 32D cell clones are dependent for proliferation and survival on the continuous presence of the specific growth factor.2 In preliminary experiments, we found that, after 4 hours of incubation at 37°C in medium without growth factor, about 90% of the cells were still Tripan Blue negative and were able to respond to the readdition of the specific growth factor. The cell lines were next incubated for 4 hours in the absence of growth factors, after which each sample was divided into aliquots and the growth factors were readded. The amount of the PKC isoforms was quantified at time 0 (after 4 hours of growth factor deprivation) and at 15, 30, and 60 minutes from the readdition of the growth factor.
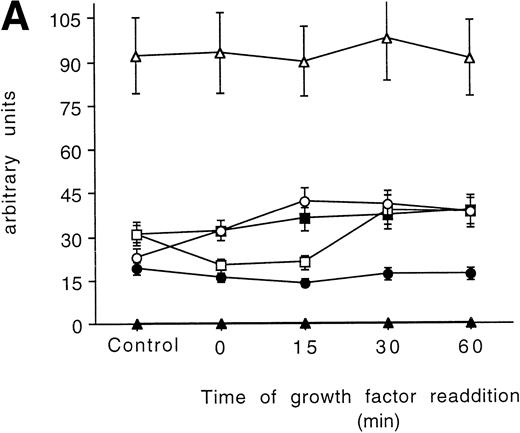
In the 32D parental cell line, all the PKC isoforms were decreased after the starvation and slowly recovered to the initial values after 60 minutes of incubation with the growth factors, with the fastest isoform to return to normal levels being the PKC βΙ at 15 minutes (Figs 3A and 5A).
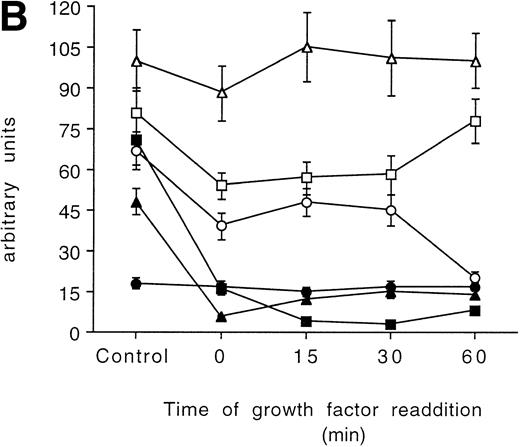
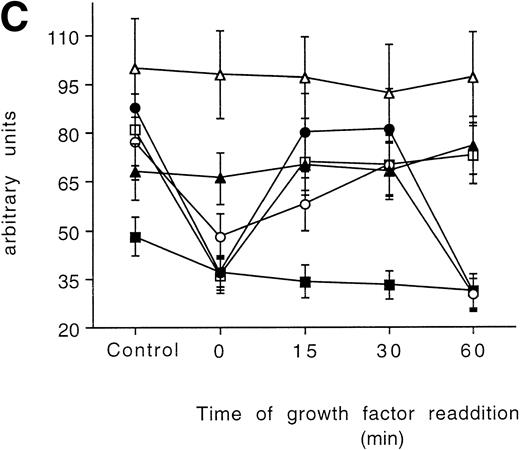
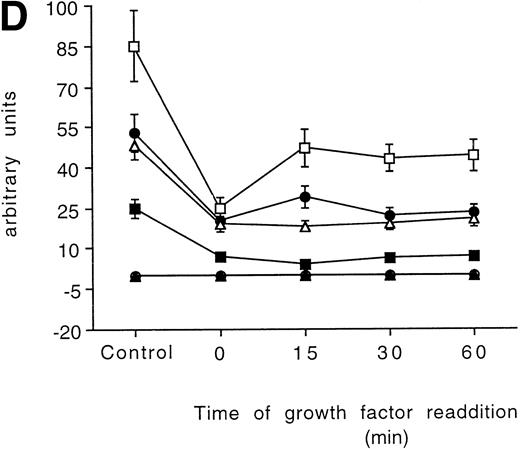
Time-course analysis of the effect of growth factor readdition on PKC isoform expression in 32D (A), 32D GM1 (B), 32D G (C), and 32D Epo1 (D) cell lines. Semiquantitative densitometric analysis on Western blot experiments shown in the legend of Fig 3 is reported. The values represent the means ± SD of five separate experiments. (▪) ; (□) βI; (•) δ; (○) ɛ; (▴) η; (▵) ζ.
Time-course analysis of the effect of growth factor readdition on PKC isoform expression in 32D (A), 32D GM1 (B), 32D G (C), and 32D Epo1 (D) cell lines. Semiquantitative densitometric analysis on Western blot experiments shown in the legend of Fig 3 is reported. The values represent the means ± SD of five separate experiments. (▪) ; (□) βI; (•) δ; (○) ɛ; (▴) η; (▵) ζ.
In the 32D GM1 cell line, all but the δ isoform were reduced after the starvation. The ζ isoform was only marginally reduced and returned to the normal level in about 15 minutes of culture with the growth factor. The isoform α, βΙ, ε, and η were strongly decreased, and only the βΙ recovered to the initial level after 60 minutes of incubation with the growth factor (Figs 3B and 5B).
In the 32D G1, the amounts of the isoforms α, η, and ζ were not modified after the starvation. The concentration of isoform ε was decreased and did not recover after 60 minutes, whereas the concentrations of isoform βΙ and δ both returned to normal values after 15 minutes of incubation (Figs 3C and 5C).
Growth factor-dependent modulation of PKC-ε in 32D Epo1.1 cells.
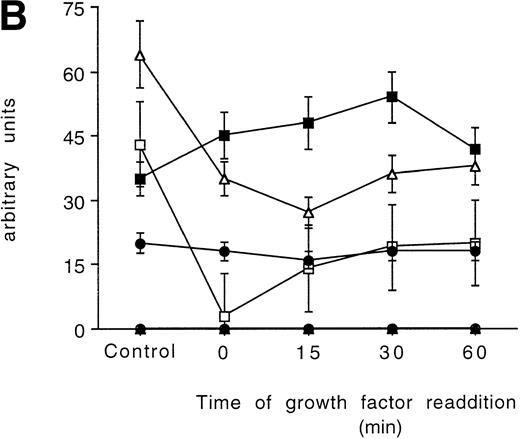
To ascertain whether the pattern of PKC isoform expression was modulated by growth factors, besides being dependent on the specific phenotype, we used as a model system the 32D Epo1.1 revertant cell clone (Fig 6A and B). This cell line was derived from the 32D Epo1 by selection with IL-3 in serum-free medium and can be grown alternatively in medium containing IL-3 or Epo.4 The pattern of isoform expression in the steady-state culture of 32D Epo1.1 cells supplemented with Epo was not modified with respect to the parental 32D Epo1. When the 32D Epo1.1 cells were grown in the presence of IL-3, the only major modification regarded the ε isoform, which was absent in Epo- but present in IL-3–supplemented cultures (Figs 6 and 7).
Western blot analysis of PKC-, βΙ, δ, ɛ, η, and ζ isoforms in homogenates obtained from 32D Epo1.1 cells cultured in Epo (A) or IL-3 (B). Cells were examined before (lane 1) and after 4 hours of serum-starvation (lanes 2 through 5) in the absence (lane 2) or presence of the specific growth factor that was readded for 15 (lane 3), 30 (lane 4), and 60 (lane 5) minutes. The positive control was represented by a rat brain homogenate (lane 6). A representative of four separate experiments is reported.
Western blot analysis of PKC-, βΙ, δ, ɛ, η, and ζ isoforms in homogenates obtained from 32D Epo1.1 cells cultured in Epo (A) or IL-3 (B). Cells were examined before (lane 1) and after 4 hours of serum-starvation (lanes 2 through 5) in the absence (lane 2) or presence of the specific growth factor that was readded for 15 (lane 3), 30 (lane 4), and 60 (lane 5) minutes. The positive control was represented by a rat brain homogenate (lane 6). A representative of four separate experiments is reported.
Time-course analysis of the effect of growth factor readdition on PKC isoform expression in 32D Epo1.1 cells cultured in Epo (A) or IL-3 (B). Semiquantitative densitometric analysis on Western blot experiments shown in the legend of Fig 6 is reported. The values represent the means ± SD of five separate experiments. (▪) ; (□) βI; (•) δ; (○) ɛ; (▴) η; (▵) ζ.
Time-course analysis of the effect of growth factor readdition on PKC isoform expression in 32D Epo1.1 cells cultured in Epo (A) or IL-3 (B). Semiquantitative densitometric analysis on Western blot experiments shown in the legend of Fig 6 is reported. The values represent the means ± SD of five separate experiments. (▪) ; (□) βI; (•) δ; (○) ɛ; (▴) η; (▵) ζ.
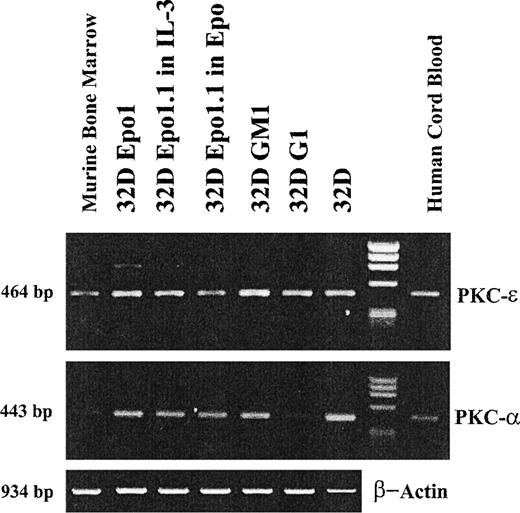
To further evaluate the regulation of PKC-ε during erythroid differentiation, we have also analyzed the expression of PKC-ε and -α mRNA in all 32D cell lines (Fig 8). Both 32D Epo1 and 32D Epo1.1 cells, either cultured in IL-3 or Epo, expressed detectable levels of PKC-ε and -α mRNA by reverse transcriptase-PCR (RT-PCR). Although not quantitative, these data suggest that PKC-ε downregulation in erythroid cell lines occurs at the posttranscriptional level.
RT-PCR analysis of the expression of PKC-ɛ and - mRNA in the subclones of the 32D cell lines. The ethidium bromide staining of products amplified by 30 cycles of PCR with primers specific for the PKC-ɛ and - or for murine actin and separated by electrophoresis on agarose gel are presented. Comparable amounts of products of the expected molecular weights were amplified not only from cDNA obtained from human cord blood (last lane) and mouse bone marrow (first lane) mononuclear cells, as controls, but also from cDNA obtained from all subclones of the 32D cell lines. The specificity of the PKC-ɛ band amplified from the 32D Epo cell line was proved by direct sequencing of the band eluted from the gel.
RT-PCR analysis of the expression of PKC-ɛ and - mRNA in the subclones of the 32D cell lines. The ethidium bromide staining of products amplified by 30 cycles of PCR with primers specific for the PKC-ɛ and - or for murine actin and separated by electrophoresis on agarose gel are presented. Comparable amounts of products of the expected molecular weights were amplified not only from cDNA obtained from human cord blood (last lane) and mouse bone marrow (first lane) mononuclear cells, as controls, but also from cDNA obtained from all subclones of the 32D cell lines. The specificity of the PKC-ɛ band amplified from the 32D Epo cell line was proved by direct sequencing of the band eluted from the gel.
DISCUSSION
The complexity of hematopoiesis arises from the requirement for highly regulated progression through successive stages involving commitment of pluripotent hematopoietic stem cells to specific cell lineages, terminal differentiation of lineage-restricted progenitors, and growth arrest with production of functional end cells with a defined life span, which must be constantly replenished.22 Hematopoiesis is under control of soluble hematopoietic cytokines, which are capable of stimulating the proliferation and enhancing the survival of the appropriate hematopoietic progenitor cells.5 However, the mechanisms by which cytokines promote hematopoietic differentiation remain controversial. Two general models for the role of cytokines in controlling hematopoietic differentiation have been proposed. In the instructive model,23 cytokines transmit specific signals to multipotent hematopoietic cells directing lineage commitment. In the stochastic model,24 cytokines only support the proliferation and survival of lineage-committed cells. A major distinction between these two models is that in the instructive model the cytokine receptors are transmitting specific lineage commitment signals. Recently, an hybrid model has been proposed,25using the 32Dcl3 mouse hematopoietic cell line that is capable of differentiating into granulocytes in response to G-CSF. When 32Dcl3 cells were transfected with the antiapoptotic genes bcl-2 orbcl-Xl, some features of granulocytic differentiation, namely nuclear segmentation, appear to be preprogrammed and did not require G-CSF, whereas the complete maturation of 32D cells to granulocytes, involving the induction of myeloperoxidase activity, was dependent on G-CSF. Thus, the regulation of lineage commitment is, at least in part, extrinsic: the growth factors in which the cells are cultured can influence the type of mature cells formed.
Most hematopoietic growth factors are able to activate common signaling pathways: increased intracellular pH, which appears to be required for the survival of hematopoietic progenitors with suppression of programmed cell death26,27 and activation of the Ras/Raf/MAPK pathway.28 However, what is still not clear is how growth factors elicit varied developmental responses in hematopoietic progenitors. Candidate intracellular regulatory molecules, which may be involved in the development of hematopoietic cells, are members of the serine- and threonine-specific PKC family.13,19-21,29-33 Because most of previous studies used transformed or leukemic cell lines that were induced to differentiate by pharmacological agents, their physiological implications for normal hematopoiesis remain to be determined. To further address the role of the different PKC isoforms in hematopoiesis, we used primary human CD34+ cells and cell lines subcloned from the 32D cell line, a pluripotent murine myeloid cell line, that has a diploid karyotype. 32D cells were originated by a bone marrow long-term culture in the presence of murine IL-31-3 and are widely used as a model for myeloid progenitor cells also to study signal transduction pathways.34
A potentially important role for PKC-ε downmodulation in the process of erythroid maturation was suggested in experiments performed on primary human CD34+ cells that gave rise to a significant higher number of erythroid colonies in the presence of a specific PKC-ε peptide inhibitor. Similarly, the total number of parental 32D cells cultured in Epo for 7 days, showing the potentiality to give rise to Epo-dependent subclones, was significantly higher in the presence of the PKC-ε inhibitory peptide. Moreover, analysis of the cytoplasmatic levels of the PKC isoforms in murine 32D cell lines showed that the ε and η isoforms were absent in the erythroid lineage (32D Epo1) and present in the granulomonocytic (32D, 32D GM1, and 32D G1).
The PKC isoforms were variably upregulated in response to growth factor readdition, with each cell line showing a distinctive expression pattern. However, the time necessary to recover from growth factor starvation changed from less than 15 minutes to more than 60 minutes, indicating that translation of the PKC isoform mRNAs is differently regulated both inside the same cell line and between the different phenotypes. In fact, at 15 minutes, PKC βΙ returned to the levels observed in unstarved cells in the 32D cell clone. In the 32D GM1, PKC ζ recovered to the basal values, albeit from a small decrease, in the 15-minute time frame. In the 32D G1, both PKC isoforms βΙ and δ recovered at 15 minutes. The erythroid 32D Epo1 did not show any isoform recovering in the short time after starvation. Interestingly, some of the isoforms investigated were not affected by the growth factor starvation at all, as the δ in the 32D GM1 and α, η, and ζ in the 32D G1.
The linkage between stimulation of specific growth factor receptor and PKC isoform composition was evident in the 32D Epo1.1, an IL-3–dependent revertant of 32D Epo1 that displays an hybrid behavior. In fact, when Epo1.1 cells were cultured with IL-3, they only lacked the expression of η isoform and showed an upregulated expression of βΙ and ε isoforms in response to IL-3. On the other hand, when Epo 1.1 cells were supplemented with Epo, they did not express both ε and η isoforms and did not upregulate the βΙ isoform, similarly to 32D Epo. In this respect, it is noteworthy that the 32D Epo1.1 are as differentiated as the 32D Epo1 when grown in Epo (high levels of α and β globin expression and erythroid-specific splicing of the spectrin-binding domain of band 4.1) but are less differentiated when grown in IL-3 (only high levels of expression of α and β globin).4
To further evaluate the role of PKC-ε in erythroid differentiation, we have analyzed the expression of PKC-ε mRNA in erythroid cell lines. 32D Epo1 and 32D Epo1.1 cells, cultured in either IL-3 or Epo, expressed apparently normal levels of PKC-ε mRNA by RT-PCR. This result was expected because posttranscriptional regulation of PKC-ε has been found alreadly in other hematopoietic cell lines35,36 and indicates that experiments of forced PKC-ε expression will probably require the isolation of stable transfectants and high levels of expression.36 In this respect, we have obtained a recently described PKC-ε construct37 that will allow us to develop stable transfectants to identify both the posttranscriptional mechanisms that downmodulate the activity of PKC-ε in 32D Epo cells and how downmodulation of PKC-ε favors the erythroid differentiation program (run-off experiments of several genes after forced expression, etc).
Thus, each hematopoietic phenotype shows a cell type-specific pattern of expression of the different PKC isoenzymes, fully consistent with the hypothesis that the different isoenzymes might fulfill different biological functions in hematopoietic development. In particular, the erythroid commitment induced by Epo does not seem to involve PKC activation and is rather accompanied by the downregulation of specific isoforms. The only isoform upregulated by growth factor readdition in all myeloid lineages was PKC-βΙ, which has been previously implicated in mediating survival/proliferation signals rather than differentiation.30 Our findings support the notion that both qualitative and quantitative differences in the levels of PKC isoform expression may play a role in mediating differentiation decisions along distinct hematopoietic lineages.
Supported by “Blood Project” of the Istituto Superiore di Sanità and “Sant’Anna Hospital of Ferrara Project.”
The publication costs of this article were defrayed in part by page charge payment. This article must therefore be hereby marked “advertisement” in accordance with 18 U.S.C. section 1734 solely to indicate this fact.
REFERENCES
Author notes
Address reprint requests to Giorgio Zauli, MD, PhD, Human Anatomy Section, Department of Morphology and Embryology, Via Fossato di Mortara 66, 44100 Ferrara, Italy.








This feature is available to Subscribers Only
Sign In or Create an Account Close Modal