Abstract
A unique subclone of a bone marrow-derived stromal cell line, BMS2.4, produces soluble factors that inhibit proliferation of several types of hematopoietic cell lines. An understanding of these molecules may be informative about negative regulatory circuits that can potentially limit blood cell formation. We used expression cloning to identify interleukin-6 (IL-6) as one factor that suppressed growth of a pre-B–cell variant line, 1A9-M. Moreover, IL-6 induced macrophage-differentiation and apoptosis of 1A9-M cells. During this process, IL-6 downregulated expression of BCL2 in 1A9-M cells and stimulated BCL-XL expression, but had no effect on p53, Bax, or Bak gene expression. Mechanisms for transduction of IL-6–induced signals were then evaluated in IL-6–stimulated 1A9-M cells. Whereas the signal transducer and activator of transcription 3 (Stat3) was phosphorylated and activated, there was no effect on either Stat1 or Stat5. The importance of BCL2 and Stat3 on IL-6–induced macrophage-differentiation and apoptosis was studied with 1A9-M cells expressing human BCL2 or a dominant-negative form of Stat3, respectively. IL-6–induced apoptosis, but not macrophage-differentiation, was blocked by continuously expressed BCL2. A dominant-negative form of Stat3 inhibited both macrophage-differentiation and apoptosis induced by IL-6. However, diminished Stat3 activity did not prevent IL-6–induced downregulation of the BCL2 gene. Therefore, activation of Stat3 is essential for IL-6–induced macrophage-differentiation and programmed cell death in this model. Whereas overexpression of BCL2 abrogates the apoptotic response, Stat3-independent signals appear to downregulate expression of the BCL2 gene.
BLOOD CELL FORMATION is strictly regulated by the bone marrow microenvironmental factors, including adhesion molecules, extracellular matrix components, and cytokines.1-3 Interactions between very late antigen 4 and vascular cell adhesion molecule 1 and between CD44 and hyaluronan play an essential role, because antibodies against them blocked the production of lymphoid and/or myeloid cells in long-term bone marrow cultures.4-6 Modification of cell-cell adhesion by an antibody against CD9 also blocked production of myeloid cells in Dexter cultures.7 Regulatory cytokines in bone marrow are typically produced in extremely small quantities, and some of them are capable of binding to extracellular matrix.2
A number of genes that may be involved in lympho-hematopoiesis have been identified by experiments using cloned stromal cell lines that were originally selected for the ability to support proliferation and/or differentiation of a particular type of hematopoietic cells. A stromal cell line, BMS2, which was established from adherent cells of long-term bone marrow cultures, has been shown to have the capacity to support growth of pre-B cells.8 However, BMS2.4, a subclone of BMS2, has unique characteristics. It blocked proliferation of certain types of hematopoietic cells selectively and interacted with the pH indicator, phenol red.9 We now report that interleukin-6 (IL-6) is one of the growth-suppressors produced by BMS2.4 cells. Recombinant human IL-6 as well as the supernatant of cells transfected with mouse IL-6 cDNA induced macrophage-differentiation and apoptosis of 1A9-M cells, a variant 1A9 pre-B–cell line.
IL-6 is a multifunctional cytokine that regulates proliferation and differentiation of a variety of cells.10-12 IL-6 induces terminal differentiation of B cells to antibody-producing cells, proliferation of myeloma cells, and production of acute-phase proteins by hepatocytes.13-15 IL-6 also induces macrophage differentiation of several myeloid cell lines, including M1 and Y6.16, 17 Recent studies have shown that IL-6 induced phosphorylation and activation of signal transduction molecules, such as Janus kinases (JAK1, JAK2, and Tyk2) and signal transducer and activator of transcription family proteins (Stat1 and Stat3).18,19 In particular, activation of the Stat3 molecule has been shown to be essential for IL-6–induced macrophage-differentiation of M1 cells.20-22 We describe here two IL-6–induced signal transduction pathways that lead to macrophage-differentiation and apoptosis of 1A9-M cells.
MATERIALS AND METHODS
Cells.
A stromal cell line BMS2 and its subclone, BMS2.4, were cultured in Dulbecco’s modified Eagle medium (DMEM) supplemented with 10% fetal calf serum (FCS; Flow Laboratories, North Ryde, Australia). 1A9, a pre-B–cell line, and its variant line, designated 1A9-M, were cultured in McCoy’s 5A medium supplemented with 5% FCS and 5 × 10⁻⁵ mol/L 2-mercaptoethanol.23 The 1A9-M line has rearranged both JH alleles. However, one JH allele is different from the original 1A9 line and therefore may have undergone a secondary rearrangement. 1A9-M has also lost expression of IgM and CD19. Lymphoma cell lines (7OZ/3 and EL4), an IL-3–dependent pro-B–cell line (BaF3), and myeloid leukemia cell lines (FDCP1 and WEHI3) were maintained as previously described.4
To make stable transformants of 1A9-M cells expressing human BCL2 or a dominant-negative form of Stat3, pSVBT (a kind gift of Dr Y. Tsujimoto, Osaka University, Osaka, Japan) or pCAGGS-Neo-HA-Stat3D21were transfected into 1A9-M cells by electroporation and the transformants were selected with 1 mg/mL of G418 (Sigma, St Louis, MO).
Expression cloning and sequence analysis.
Polyadenylated RNA was isolated from BMS2.4 cells using a Fast Track mRNA isolation kit (Invitrogen, San Diego, CA). Double-stranded cDNA was synthesized with a TimeSaver cDNA synthesis kit (Pharmacia, Uppsala, Sweden), ligated with BstXI adaptors (Invitrogen), and cloned into a mammalian expression vector, pEF-BOS (a kind gift of Dr S. Nagata, Osaka Bioscience Institute, Osaka, Japan). Plasmid cDNAs were purified from pools of a few hundreds of clones and were transfected into 293T cells by calcium phosphate precipitation. Supernatants from each transfectant were added to cultures of 1A9-M cells, and positive pools were identified by growth suppression of 1A9-M cells. Positive pools were divided into progressively smaller pools and rescreened until single clones were isolated. The inserts of the single clones were subcloned into pBluescript (Stratagene, La Jolla, CA), and nucleotide sequence was determined using an automated DNA sequencer (Applied Biosystems, Foster City, CA). Nucleotide data base searching was performed with BLAST from the GCG computer program (Genetics Computer Group, Madison, WI).
Flow cytometry.
Antibody incubations and washing steps were performed at 4°C in phosphate-buffered saline (PBS) containing 3% heat-inactivated FCS and 0.1% sodium azide. Cells were analyzed with a FACScan flow cytometer (Becton Dickinson, Mountain View, CA). Antibodies used in this study were as follows: fluorescein isothiocyanate (FITC)-conjugated antimouse CD32/CD16 (PharMingen, San Diego, CA) and phycoerythrin (PE)-conjugated antimouse F4/80 (Caltag, San Francisco, CA). Isotype-matched Igs were used for controls.
Cell cycle analysis.
After stimulation, cells (1 × 10⁶) were washed with PBS, resuspended in 100 μL of PBS, and fixed by the addition of 900 μL of cold ethanol. The fixed cells were incubated with 300 μL of staining buffer (1 mg/mL RNase, 20 μg/mL propidium iodide, and 0.01% NP-40 in PBS) at 37°C for 10 minutes. The DNA contents in the nucleus of the cells were analyzed with FACSort (Becton Dickinson) using Cell Quest software.
DNA fragmentation assay.
Fragmentation of DNA was assayed as previously described.17After stimulation with IL-6, 1A9-M cells (1 × 10⁷) were lysed in 0.4 mL lysis buffer containing 200 mmol/L Tris-HCl, 100 mmol/L EDTA, 1% sodium dodecyl sulfate (SDS), and 50 μg/mL proteinase K (Sigma) and incubated for 4 hours at 37°C. DNAs were extracted with phenol and then with chloroform/isoamylalcohol. The aqueous phase was collected and precipitated with NaCl and ethanol. DNA pellets were suspended in 0.4 mL TE buffer and treated with 50 μg/mL RNase for 5 hours and then with 200 μg/mL proteinase K for 5 hours. DNAs were extracted twice and precipitated as described above. DNA pellets were resuspended in TE buffer, separated by electrophoresis in 1% agarose gel (1 μg DNA per lane), stained with 0.5 μg/mL ethidium bromide, and visualized under UV light.
Luciferase assay.
A luciferase construct, 4× APRE-Luc, which contains a Stat3-binding sequence, was used as a reporter gene.21 24Luciferase assays were performed using the Dual-Luciferase Reporter System (Promega, Madison, WI), in which transfection efficiency was monitored by cotransfected pRL-CMV-Rluc, an expression vector for renilla luciferase. The cultured cells were electroporated with 30 μg of reporter gene together with 30 μg of pRL-CMV-Rluc. The transfected cells were serum-starved for 12 hours and then stimulated with 20 ng/mL IL-6 for 5 hours. The cells were lysed in lysis buffer supplied by the manufactuer, followed by measurement of the firefly and the renilla luciferase activities on luminometer LB96P (Berthold Japan, Tokyo, Japan). The relative firefly luciferase activities were calculated by normalizing transfection efficiency according to the renilla luciferase activities.
Northern blot analysis.
Total RNAs were isolated using TRIzol Reagent (GIBCO, Grand Island, NY), electrophoresed through a formaldehyde agarose gel, and transferred onto a nylon membrane (Amersham, Arlington Heights, IL). The cDNA fragments were labeled with [32P]dCTP using a random primed DNA labeling kit (Boehringer Mannheim, Indianapolis, IN) and hybridized to the membrane. Blots were then washed and autoradiographed. Fragments of the BCL2, BCL-XL, Bak, Bax, p53, and β-actin genes were used as materials for probes.25
Western blot analysis.
The isolation of cellular lysates, gel electrophoresis, and immunoblotting was performed according to the methods described previously, with minor modifications.7 Briefly, 1A9-M cells were lysed in lysis buffer, and insoluble material was removed by centrifugation. Whole cellular lysates (15 μg per each lane) were subjected to SDS-polyacrylamide gel electrophoresis. The proteins were electrophoretically transferred onto a polyvinylidene difluoride membrane (Immobilon; Millipore Corp, Bedford, MA). After blocking the residual binding sites on the filter, immunoblotting was performed with an appropriate antibody. Immunoreactive proteins were then visualized with the enhanced chemiluminescence detection system (DuPont NEN, Boston, MA). A mouse antihuman BCL2 antibody, a mouse antimouse BCL2 antibody, and a rabbit antimouse BCL-X antibody were purchased from Santa Cruz Biotechnology, Inc (Santa Cruz, CA).
RESULTS
Supernatant of BMS2.4 suppressed growth of certain hematopoietic cell lines.
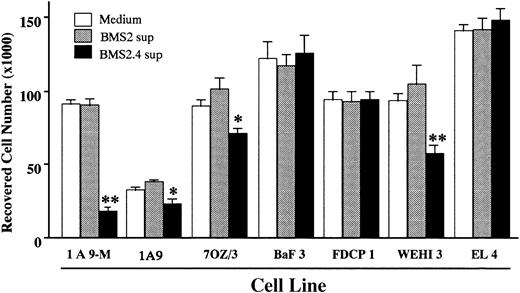
BMS2.4 is an unique subclone of the BMS2 stromal cell line. In contrast to the parent line that supports proliferation and differentiation of lymphoid and myeloid precursors, BMS2.4 inhibits the growth of some hematopoietic cell types.9 We evaluated whether these inhibitory effects were mediated by soluble factors or cell surface molecules. As shown in Fig 1, proliferation of several hematopoietic cell lines (1A9, 7OZ/3, 1A9-M, and WEHI3) was suppressed by BMS2.4 conditioned medium, whereas that of FDCP1, BaF3, and EL4 cell lines was not affected. Supernatants derived from the parent BMS2 line were not suppressive for any hematopoietic cell lines tested. The 1A9-M cells appeared to be particularly sensitive to inhibition by BMS2.4 and were used in subsequent attempts to identify inhibitory factors. The growth-inhibitory activity was not blocked by neutralizing antibodies to tumor necrosis factor-α, tumor growth factor-β, or interferon-β (data not shown).
Growth inhibitory effects of BMS2.4 supernatant on various hematopoietic cell lines. The indicated cell lines (1 × 10⁴ cells/well) were cultured with supernatant of BMS2 or BMS2.4 cells for 48 hours and number of remaining cells was determined by hemocytometer counts. The results are shown as the mean ± SD of triplicate cultures. Statistically significant differences from control values are indicated: *P < .05; **P < .01.
Growth inhibitory effects of BMS2.4 supernatant on various hematopoietic cell lines. The indicated cell lines (1 × 10⁴ cells/well) were cultured with supernatant of BMS2 or BMS2.4 cells for 48 hours and number of remaining cells was determined by hemocytometer counts. The results are shown as the mean ± SD of triplicate cultures. Statistically significant differences from control values are indicated: *P < .05; **P < .01.
Identification of IL-6 as one inhibitory cytokine secreted by BMS2.4 cells.
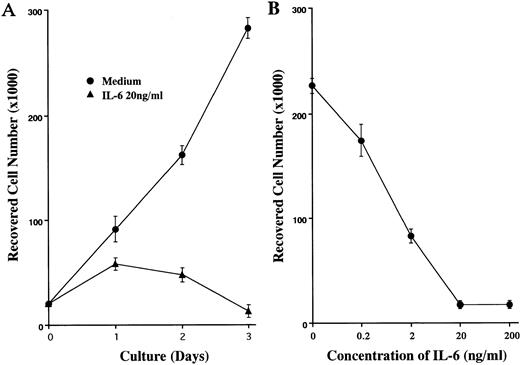
Expression cloning of growth inhibitory substances was performed as described in Materials and Methods. Approximately 1.2 × 10⁵ clones of the BMS2.4 expression library were screened on the basis of growth inhibition of 1A9-M cells, and 6 clones were isolated (Table 1). Supernatants of 293T cells that were transfected with plasmids prepared from these clones showed more than 90% suppression of proliferation of 1A9-M cells. Sequencing showed that all 6 clones contained mouse IL-6 cDNA inserts. Moreover, proliferation of 1A9-M cells was suppressed in a dose-dependent manner when recombinant human IL-6 was added to cultures (Fig 2). Addition of a neutralizing antibody to mouse IL-6 (Genzyme, Cambridge, MA) cancelled approximately 90% of the growth inhibitory effect of BMS2.4 supernatant on 1A9-M cells (data not shown). Thus, IL-6 represents one major substance produced by BMS2.4 cells that can arrest growth of 1A9-M cells.
A Summary for the Expression Cloning
| Clone . | % Growth Suppression of 1A9-M Cells . | Insert Length (bp) . | Sequence of Insert . |
|---|---|---|---|
| Clone 84 | 95.2 ± 2.12 | 1,050 | Mouse IL-6 |
| Clone 120 | 93.5 ± 1.69 | 2,100 | Mouse IL-6 |
| Clone 166 | 96.9 ± 3.91 | 1,100 | Mouse IL-6 |
| Clone 217 | 95.1 ± 2.24 | 1,050 | Mouse IL-6 |
| Clone 255 | 91.8 ± 4.75 | 1,000 | Mouse IL-6 |
| Clone 283 | 95.5 ± 6.23 | 1,000 | Mouse IL-6 |
An expression library was made from BMS2.4 cells. Approximately 1.2 × 10⁵ clones were screened on the basis of growth inhibition of 1A9-M cells as described in Materials and Methods, and 6 clones were isolated. Plasmids from each positive clone were transfected into 293T cells, and supernatants of the transfectants were collected after 3 days of incubation. 1A9-M cells were cultured with or without the supernatants for 3 days, and recovered viable cells were measured by hemocytometer. The nucleotide sequences of the inserts from the single clones were determined using an automated DNA sequencer.
IL-6–induced growth inhibition of 1A9-M cells. (A) 1A9-M cells were cultured with or without 20 ng/mL IL-6 for the indicated time periods. (B) 1A9-M cells were cultured with various concentrations of IL-6 for 3 days. The results of hemocytometer counts are shown as the mean ± SD of triplicate cultures.
IL-6–induced growth inhibition of 1A9-M cells. (A) 1A9-M cells were cultured with or without 20 ng/mL IL-6 for the indicated time periods. (B) 1A9-M cells were cultured with various concentrations of IL-6 for 3 days. The results of hemocytometer counts are shown as the mean ± SD of triplicate cultures.
IL-6 induced macrophage-differentiation and apoptosis of 1A9-M cells.
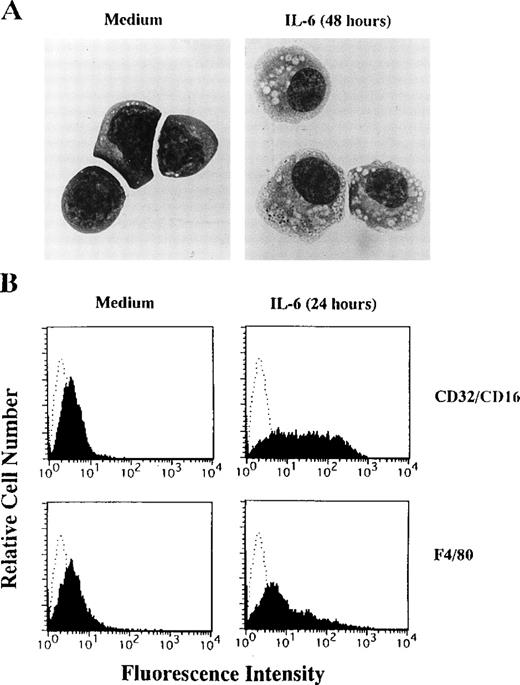
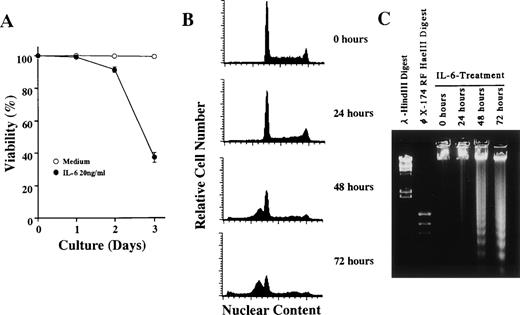
1A9-M cells typically have blastoid features with basophilic cytoplasm and large nuclei containing nucleoli (Fig3A, left panel) and are negative for CD45RA, Mac1 (CD18/11b), GR-1, and TER119 (data not shown). After treatment with IL-6, 1A9-M cells showed macrophage-like morphologies, characterized by ample vacuolated cytoplasm and irregularly shaped nuclei (Fig 3A, right pannel). They began to express Fc receptor (CD32/CD16) and a F4/80 antigen, a macrophage-specific antigen, after IL-6 treatment (Fig 3B). 1A9-M cells started to die within 48 hours of culture with IL-6 (Fig 4A). To clarify the mechanism of cell death, nuclear DNA contents of 1A9-M cells cultured with IL-6 were analyzed by flow cytometry. As shown in Fig 4B, the proportion of G0-G1 population increased within 24 hours (36.8% before stimulation; 46.4% 24 hours after stimulation), and the subdiploid peak appeared within 48 hours (0.2% before stimulation; 43.7% 48 hours after stimulation). Moreover, DNA obtained from 1A9-M cells cultured with IL-6 for more than 48 hours showed extensive degradation with oligonucleosomal fragments (Fig 4C). Therefore, IL-6 induces macrophage-differentiation and apoptosis of 1A9-M cells. Whereas growth of a related pre-B–cell line, 1A9, was sensitive to factors produced by BMS2.4 (Fig 1), they were not influenced in any obvious way by IL-6.
IL-6–induced macrophage-differentiation of 1A9-M cells. (A) 1A9-M cells were cultured with (right panel) or without (left panel) 20 ng/mL IL-6 for 48 hours. The cells were prepared by cytospin, stained by May-Grunwald-Giemsa, and photographed at 1,000× magnification. (B) 1A9-M cells were cultured with or without 20 ng/mL IL-6 for 24 hours. Surface expression of CD32/CD16 and a F4/80 antigen was evaluated by flow cytometry.
IL-6–induced macrophage-differentiation of 1A9-M cells. (A) 1A9-M cells were cultured with (right panel) or without (left panel) 20 ng/mL IL-6 for 48 hours. The cells were prepared by cytospin, stained by May-Grunwald-Giemsa, and photographed at 1,000× magnification. (B) 1A9-M cells were cultured with or without 20 ng/mL IL-6 for 24 hours. Surface expression of CD32/CD16 and a F4/80 antigen was evaluated by flow cytometry.
IL-6–induced apoptosis of 1A9-M cells. 1A9-M cells were cultured with 20 ng/mL of IL-6 for the indicated time periods and then subjected to (A) cell viability, (B) nuclear DNA content, and (C) DNA fragmentation analysis as described in Materials and Methods. Each figure shows one of three similar experiments.
IL-6–induced apoptosis of 1A9-M cells. 1A9-M cells were cultured with 20 ng/mL of IL-6 for the indicated time periods and then subjected to (A) cell viability, (B) nuclear DNA content, and (C) DNA fragmentation analysis as described in Materials and Methods. Each figure shows one of three similar experiments.
IL-6 modulated expression of apoptosis-related genes.
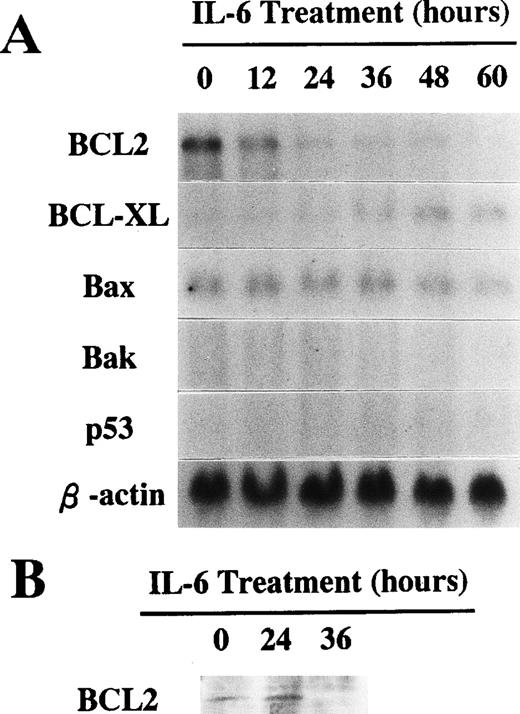
To investigate molecular mechanisms involved in 1A9-M cell responses to IL-6, we evaluated expression of some apoptosis-related genes by Northern blot analysis. As shown in Fig 5A, 1A9-M cells constitutively expressed BCL2 and Bax genes. Expression of the BCL2 gene was downregulated within 24 hours after stimulation with IL-6. In contrast, expression of the BCL-XL gene was induced by IL-6 treatment. Expression of Bax was not affected by IL-6 and neither the Bak nor the p53 gene was expressed by these cells at a level detectable by Northern blot. The BCL2 and BCL-XL proteins were also evaluated by Western blot analysis. As shown in Fig 5B, 1A9-M cells lost BCL2 protein within 36 hours of stimulation with IL-6. Although expression of BCL-XL mRNA was induced by IL-6 treatment, the protein was undetectable even when 1A9-M cells were treated with IL-6 (data not shown).
(A) Expression of apoptosis-related genes during culture with IL-6. 1A9-M cells were cultured with 20 ng/mL of IL-6 for the indicated time periods. Total RNAs were isolated and subjected to Northern blot analysis using the cDNAs of BCL2, BCL-XL, Bax, Bak, p53, and β-actin as probes. (B) Expression of BCL2 protein during culture with IL-6. 1A9-M cells were cultured with 20 ng/mL of IL-6 for the indicated periods. Whole cellular lysates were obtained and subjected to Western blot analysis using an antimouse BCL2 antibody.
(A) Expression of apoptosis-related genes during culture with IL-6. 1A9-M cells were cultured with 20 ng/mL of IL-6 for the indicated time periods. Total RNAs were isolated and subjected to Northern blot analysis using the cDNAs of BCL2, BCL-XL, Bax, Bak, p53, and β-actin as probes. (B) Expression of BCL2 protein during culture with IL-6. 1A9-M cells were cultured with 20 ng/mL of IL-6 for the indicated periods. Whole cellular lysates were obtained and subjected to Western blot analysis using an antimouse BCL2 antibody.
Constitutive expression of BCL2 suppressed IL-6–induced apoptosis but not macrophage-differentiation of 1A9-M cells.
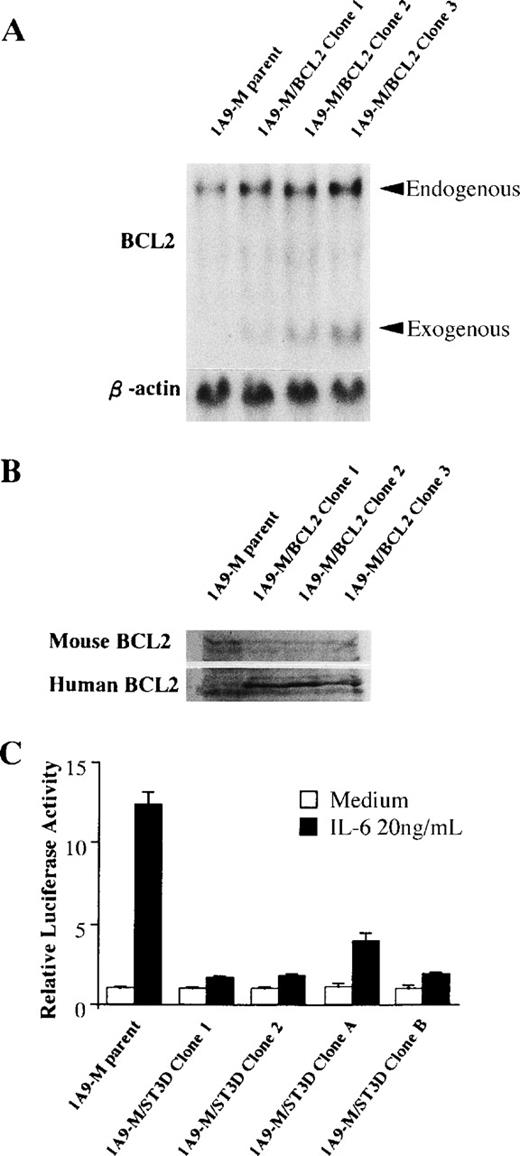
Because IL-6 downregulated gene expression of BCL2, an antiapoptotic gene, we evaluated the importance of this change for IL-6–induced responses. A human BCL2-expression plasmid, pSVBT, was stably transfected into 1A9-M cells, and 3 individual clones that expressed human BCL2 under the control of a SV40 promoter (1A9-M/BCL2) were obtained. The amount of gene and protein expression of endogenous and exogenous BCL2 of 1A9-M/BCL2 clones was confirmed by Northern and Western blot analysis (Fig 6A and B). The1A9-M/BCL2 clones were cultured in the presence of IL-6 for 48 hours, and neither loss of viability nor apoptotic changes were observed (Table 2). However, the 1A9-M/BCL2 clones did acquire the macrophage-like morphology, along with CD32/CD16 and F4/80 antigens after treatment with IL-6 (Table 3). These findings indicate that programmed cell death is not coupled to differentiation in the 1A9-M cell line and BCL2 is sufficient to block IL-6–induced apoptosis.
Expression of BCL2 gene in 1A9-M/BCL2 clones and effects of a dominant-negative form of Stat3 in 1A9-M/ST3D clones. (A) Total RNAs from parent 1A9-M or 1A9-M/BCL2 clones were isolated and subjected to Northern blot analysis using the cDNAs of BCL2 and β-actin as probes. (B) Whole cellular lysates were obtained from parent 1A9-M or 1A9-M/BCL2 clones and subjected to Western blot analysis using antimouse BCL2 or antihuman BCL2 antibody. (C) Parent 1A9-M cells and 1A9-M/ST3D (clone 1, 2, A, B) were electroporated with 30 μg of a reporter plasmid containing 4× APRE together with 30 μg of pRL-CMV-Rluc. The cells were serum-starved for 12 hours and then stimulated with 20 ng/mL IL-6 for 5 hours. The relative firefly luciferase activities were calculated by normalizing transfection efficiency according to the renilla luciferase activities. The results are shown as the mean ± SD of triplicated experiments. (□) Unstimulated; (▪) 20 ng/mL IL-6.
Expression of BCL2 gene in 1A9-M/BCL2 clones and effects of a dominant-negative form of Stat3 in 1A9-M/ST3D clones. (A) Total RNAs from parent 1A9-M or 1A9-M/BCL2 clones were isolated and subjected to Northern blot analysis using the cDNAs of BCL2 and β-actin as probes. (B) Whole cellular lysates were obtained from parent 1A9-M or 1A9-M/BCL2 clones and subjected to Western blot analysis using antimouse BCL2 or antihuman BCL2 antibody. (C) Parent 1A9-M cells and 1A9-M/ST3D (clone 1, 2, A, B) were electroporated with 30 μg of a reporter plasmid containing 4× APRE together with 30 μg of pRL-CMV-Rluc. The cells were serum-starved for 12 hours and then stimulated with 20 ng/mL IL-6 for 5 hours. The relative firefly luciferase activities were calculated by normalizing transfection efficiency according to the renilla luciferase activities. The results are shown as the mean ± SD of triplicated experiments. (□) Unstimulated; (▪) 20 ng/mL IL-6.
Inhibition of IL-6–Induced Apoptosis of 1A9-M Cells by a Dominant-Negative Form of Stat3 and by Constitutively Expressed BCL2
| Transfectant . | Increase of Subdiploid (%) . | Loss of Viability (%) . |
|---|---|---|
| Parent 1A9-M | 32.4 ± 1.52 | 33.0 ± 3.40 |
| 1A9-M/pCAGGS clone 1 | 30.7 ± 1.77 | 39.7 ± 5.35 |
| 1A9-M/pCAGGS clone 2 | 32.4 ± 1.71 | 41.3 ± 3.68 |
| 1A9-M/pCAGGS clone 3 | 29.9 ± 2.32 | 38.4 ± 3.69 |
| 1A9-M/ST3D clone 1 | 0.8 ± 0.29 | 3.7 ± 1.41 |
| 1A9-M/ST3D clone 2 | 0.7 ± 0.25 | 3.3 ± 0.94 |
| 1A9-M/ST3D clone A | 4.9 ± 1.22 | 7.7 ± 1.25 |
| 1A9-M/ST3D clone B | 33.5 ± 1.57 | 42.4 ± 2.87 |
| 1A9-M/BCL2 clone 1 | 0.2 ± 0.29 | 3.0 ± 1.41 |
| 1A9-M/BCL2 clone 2 | 1.3 ± 0.43 | 4.4 ± 1.25 |
| 1A9-M/BCL2 clone 3 | 3.3 ± 0.71 | 7.7 ± 2.05 |
1A9-M/pCAGGS (clone 1-3), 1A9-M/ST3D (clone 1, 2, A, B), 1A9-M/BCL2 (clone 1-3), and parent 1A9-M cells were cultured with or without 20 ng/mL IL-6 for 48 hours. Nuclear DNA content was analyzed with FACSort using Cell Quest software. Cell viability was determined by trypan blue dye exclusion. The increase of subdiploid or dead cell populations by IL-6 treatment is shown as the mean ± SD of triplicate cultures.
Inhibition of IL-6–Induced Macrophage Differentiation of 1A9-M Cells by a Dominant-Negative Form of Stat3, But Not by Constitutively Expressed BCL2
| Transfectant . | Increased Median Fluorescence . | Morphological Change Into Macrophages (%) . | |
|---|---|---|---|
| F4/80 . | CD32 . | ||
| Parent 1A9-M | 34.0 ± 1.87 | 248.1 ± 11.98 | 85.0 ± 3.68 |
| 1A9-M/pCAGGS clone 1 | 49.6 ± 5.51 | 304.1 ± 14.30 | 84.5 ± 5.64 |
| 1A9-M/pCAGGS clone 2 | 34.7 ± 3.85 | 242.3 ± 4.53 | 84.7 ± 3.74 |
| 1A9-M/pCAGGS clone 3 | 31.9 ± 1.70 | 220.2 ± 10.99 | 83.0 ± 3.40 |
| 1A9-M/ST3D clone 1 | 0.3 ± 0.33 | 5.6 ± 1.70 | 1.8 ± 0.82 |
| 1A9-M/ST3D clone 2 | 0.3 ± 0.21 | 7.3 ± 0.98 | 3.0 ± 1.25 |
| 1A9-M/ST3D clone A | 8.6 ± 1.03 | 75.1 ± 7.35 | 48.8 ± 5.24 |
| 1A9-M/ST3D clone B | 0.5 ± 0.45 | 8.2 ± 1.07 | 4.7 ± 2.82 |
| 1A9-M/BCL2 clone 1 | 36.9 ± 2.67 | 225.1 ± 8.26 | 81.8 ± 4.78 |
| 1A9-M/BCL2 clone 2 | 36.6 ± 4.13 | 220.9 ± 17.90 | 84.5 ± 4.50 |
| 1A9-M/BCL2 clone 3 | 32.4 ± 2.09 | 260.4 ± 9.66 | 88.8 ± 3.74 |
1A9-M/pCAGGS (clone 1-3), 1A9-M/ST3D (clone 1, 2, A, B), 1A9-M/BCL2 (clone 1-3), and parent 1A9-M cells were cultured with or without 20 ng/mL IL-6 for 48 hours. Surface expression of CD32/CD16 and a F4/80 antigen was evaluated by flow cytometry. To determine morphological changes into macrophages, cultured cells were stained with May-Grunwald Giemsa. The increase of cells expressing F4/80 antigen or CD32 and morphologically macrophage-like cells by IL-6 treatment is shown as the mean ± SD of triplicate cultures.
Expression of a dominant-negative Stat3 blocked both IL-6–induced apoptosis and macrophage-differentiation of 1A9-M cells.
IL-6 activates the JAK-STAT signal transduction pathway.18Tyrosine phosphorylation of Stat3, but not Stat1 or Stat5, was observed when 1A9-M cells were stimulated with IL-6 (data not shown). To evaluate the importance of Stat3-mediated signals to IL-6–induced macrophage-differentiation and apoptosis, we stably transfected a pCAGGS-Neo-HA-Stat3D plasmid into 1A9-M cells. Twenty individual clones were obtained that expressed a dominant-negative form of Stat3 carrying mutations at positions important for DNA binding (1A9-M/ST3D). All 1A9-M/ST3D clones showed diminished levels of IL-6–activated transcription from the 4× APRE reporter plasmid that contains a potential Stat3-binding sequence (Fig 6C and data not shown). We then examined biological responses of the 1A9-M/ST3D clones to IL-6. Neither macrophage-differentiation nor apoptosis was induced by IL-6 when Stat3 functions were disrupted. Eighteen of 20 1A9-M/ST3D clones (clone 1-18) did not undergo apoptosis in response to IL-6 (Table 2 and data not shown). They also exhibit neither morphological changes nor acquisition of macrophage antigens in response to IL-6 (Table 3 and data not shown). Thus, Stat3 was likely to mediate signals for IL-6–induced macrophage-differentiation and apoptosis of 1A9-M cells.
Interestingly, the other two clones (1A9-M/ST3D clones A and B) showed unexpected responses to IL-6 (Tables 2 and 3). One clone (1A9-M/ST3D clone A) had slight macrophage differentiation, although its viability was retained. Approximately 30% of cells became apoptotic in another stable clone (1A9-M/ST3D clone B), without differentiation into macrophages.
Stat3 was not involved in downregulation of BCL2 gene expression by IL-6.
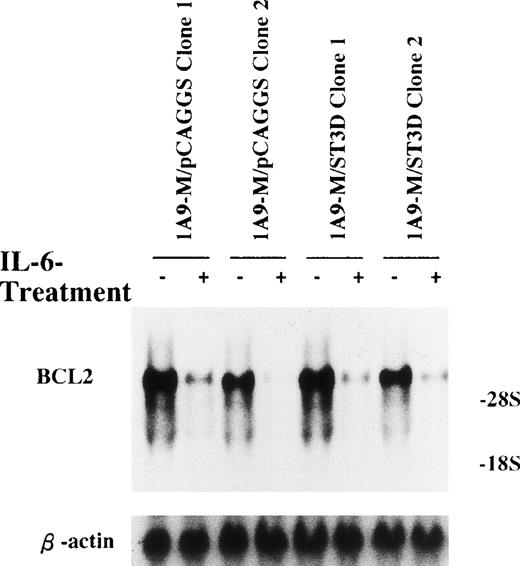
Experiments described above indicated that BCL2 might be a critical determinant for life/death decisions in 1A9-M cells that are exposed to IL-6. It seemed possible that the IL-6–induced downregulation of BCL2 gene expression might be dependent on Stat3. Therefore, we evaluated BCL2 transcripts in the 1A9-M/ST3D clones before and after stimulation with IL-6. As shown in Fig 7, IL-6 downregulated BCL2 gene expression within 24 hours in all of the 1A9-M/ST3D clones to an equivalent degree as in the control.
A dominant-negative form of Stat3 did not inhibit IL-6–induced repression of BCL2 mRNA expression. 1A9-M cells transfected with either a control vector (1A9-M/pCAGGS clone 1 and 2) or a pCAGGS-Neo-HA-Stat3D plasmid (1A9-M/ST3D clone 1 and 2) were cultured with or without 20 ng/mL IL-6 for 24 hours. Total RNAs were isolated and subjected to Northern blot analysis using cDNAs of BCL2 and β-actin as probes.
A dominant-negative form of Stat3 did not inhibit IL-6–induced repression of BCL2 mRNA expression. 1A9-M cells transfected with either a control vector (1A9-M/pCAGGS clone 1 and 2) or a pCAGGS-Neo-HA-Stat3D plasmid (1A9-M/ST3D clone 1 and 2) were cultured with or without 20 ng/mL IL-6 for 24 hours. Total RNAs were isolated and subjected to Northern blot analysis using cDNAs of BCL2 and β-actin as probes.
DISCUSSION
BMS2.4 stromal cells probably produce multiple factors that modulate the survival and growth of hematopoietic cells. Their identification may be helpful in understanding cytokines that limit blood cell production under steady state or conditions associated with unusual demands. We used the particularly sensitive 1A9-M, a pre-B–cell line, and expression cloning to determine that IL-6 is one of the active substances produced by BMS2.4. The 1A9-M cells underwent remarkable changes in morphology, expressed macrophage surface markers, and then underwent apoptosis in response to IL-6. We demonstrated that these dramatic responses are dependent on specific components of the JAK-STAT pathway and that independent signaling mechanisms account for downregulation of BCL2 expression.
Lymphocyte lines and normal IL-7–responding cells were unaffected by IL-6, but inhibited by BMS2.4 supernatant. Therefore, the BMS2.4 line must make other negative lymphopoietic regulators that can be investigated using a similar experimental strategy. The 1A9-M cell line was chosen for screening an expression library because of its sensitivity to BMS2.4 supernatant inhibition. However, it is also remarkable in its ability to undergo an apparent lineage switch before programmed cell death. There have been several previous examples of pre-B cells that have undergone a macrophage-like change. In some cases, the change was spontaneous (HATFL and 7OZ/3), in others it was induced by a proto-oncogene or ectopic expression of the c-fms macrophage colony-stimulating factor receptor.26-32 This may indicate that commitment between these two cell lineages involves relatively few transcription factors. Regardless, we are unaware of another cell line that undergoes this change before programmed cell death. Whereas two myeloid cell lines, M1 and Y6, were previously found to undergo macrophage-differentiation in response to IL-6, 1A9-M cells may provide a unique model for exploring IL-6–dependent mechanisms.
Stat family members were originally identified as transcription factors responsible for interferon-α– and interferon-γ–dependent gene expression.33 All Stat molecules have an SH2 domain, which recognizes phosphotyrosine in a specific peptide motif, and are generally involved in cytokine signal transduction.18,19For examples, Stat1 is known to be involved in innate immunity.34,35 Stat4 is activated by IL-12 and is involved in the development of natural killer and T-helper type 1 cells.36,37 Stat6 is involved in Ig E production and lymphocyte proliferation in response to IL-4.38,39 The JAK-STAT pathway also mediates signal transduction through the IL-6 receptor subunit, gp130. JAK1, JAK2, and Tyk2 constitutively associate with gp130 and respond to IL-6.40 These activated tyrosine kinases, in turn, phosphorylate and activate the Stat family proteins, especially Stat1 and Stat3 for IL-6.41,42 Recently, it was reported that gp130 mutants without any of YXXQ motifs required for Stat3 activation did not activate Stat3 or induce terminal differentiation of M1 cells.20 Moreover, it was shown that dominant-negative forms of Stat3 inhibited IL-6–induced macrophage-differentiation of M1 transformants.21 22Although these findings indicate that Stat3 may be important for IL-6–induced macrophage-differentiation, all of the experiments were performed using the M1 cell line. We now report similar observations with 1A9-M cells and can conclude that the phenomena may be general.
Apoptosis plays an important role in a wide variety of physiological processes, including removal of redundant cells during development, elimination of autoreactive lymphocytes, and eradication of old and differentiated cells in most adult tissues with self-renewal capacity.43-45 Apoptosis of monocytes and macrophages has emerged as a central regulatory event in hematopoiesis and inflammation, and inflammatory cytokines can promote or prevent their apoptosis.46 A number of genes, such as Bax, Bak, p53, BCL2, and BCL-XL, have been reported to control apoptosis of cells and to alter their gene expression during differentiation.47-49In 1A9-M cells, IL-6 induced both macrophage-differentiation and apoptosis. Expression of p53 and Bak genes was not detected in 1A9-M cells, and BCL-XL was induced by IL-6 treatment. In contrast, expression of BCL2 was downregulated by IL-6 treatment. Because BCL2 is an inhibitor of apoptosis, downregulation of BCL2 may be related to IL-6–induced apoptosis of 1A9-M cells. Indeed, downregulation of gene and protein expression of BCL2 may be important for apoptosis, because constitutively expressed BCL2 blocked IL-6–induced programmed cell death. The cAMP response-binding proteins, p53, and c-myb are known to regulate BCL2 gene expression positively or negatively in a variety of cells.50-52 In a pro-B–cell line, the tyrosine residue in the YXXQ motifs of gp130 that is essential for Stat3 activation is required for BCL2 induction and antiapoptotic effects.53However, in 1A9-M cells, Stat3 was not related to regulation of BCL2, because a dominant-negative form of Stat3 did not block IL-6–induced downregulation of BCL2 expression. On the other hand, a Stat3-dependent pathway is also required for IL-6–induced apoptosis of 1A9-M cells, because a dominant-negative form of Stat3 maintained their viability. We could speculate that there is induction of apoptosis-related genes other than p53, Bak, and Bax or reduction of some antiapoptotic genes beside BCL2 and BCL-XL. In M1 cells, Stat3 is involved in IL-6–induction of several genes, such as the junB, interferon regulatory factor-1, a CDK inhibitor p19INK4D, and Stat3 itself, and in repression of c-myb and c-myc that may regulate macrophage-differentiation and G1 growth arrest.21 54-56 It will be interesting to analyze molecular mechanisms through which the Stat3-dependent signalings induce apoptosis in 1A9-M cells.
We created stable 1A9-M transfectants using a dominant-negative form of Stat3 and found that they have three patterns of response to IL-6. Eighteen of 20 1A9-M/ST3D did not differentiate to macrophages or undergo apoptosis in response to IL-6. The 1A9-M/ST3D clone A differentiated to macrophages without apoptosis. In contrast, the 1A9-M/ST3D clone B died by apoptosis without macrophage-differentiation when stimulated. These three groups of cells differ from untransfected 1A9-M cells that differentiated to macrophages and died in response to IL-6. Because the mutated Stat3 interfered with DNA binding of endogenous Stat3 in all 1A9-M/ST3D clones, a second mutation due to prolonged selection might occur in the exceptional clones (clone A and B). These cells are suitable for substrates of subtraction techniques, and further analysis may show the molecular mechanisms through which IL-6 induces macrophage-differentiation and apoptosis.
Supported in part by grants from the Ministry of Education, Science and Culture, and the Japan Society for the Promotion of Science.
The publication costs of this article were defrayed in part by page charge payment. This article must therefore be hereby marked “advertisement” in accordance with 18 U.S.C. section 1734 solely to indicate this fact.
REFERENCES
Author notes
Address reprint requests to Kenji Oritani, MD, The Second Department of Internal Medicine, Osaka University Medical School, 2-2 Yamada-oka, Suita City, Osaka 565, Japan.

This feature is available to Subscribers Only
Sign In or Create an Account Close Modal