Thrombopoietin (TPO) regulates megakaryopoiesis and platelet production. In the adult, TPO is mainly produced by the liver and the kidneys. This study focuses on fetal and neonatal TPO mRNA expression. In 26 human fetuses and preterm neonates, samples from liver, kidney, spleen, lung, and bone marrow were extracted for total RNA. We measured platelet counts, TPO serum concentrations by enzyme-linked immunosorbent assay, and TPO mRNA contents by reverse transcription/competitive polymerase chain reaction. TPO mRNA concentrations per microgram total RNA were similar in liver, spleen, and bone marrow, slightly lower in kidney, and significantly lower in lung. When related to gram tissue, TPO mRNA levels were highest in the liver. Considering the total amount of TPO mRNA produced in liver, kidney, and spleen, the liver accounted for 95.3%. No correlations between TPO mRNA expression and serum TPO concentration, blood platelet count, or gestational age were observed. In conclusion, the liver is the primary site of TPO gene expression in human fetuses and neonates. The spleen may contribute to TPO production during fetal life. Like in the adult, TPO mRNA is expressed in fetal bone marrow.
THROMBOPOIETIN (TPO) plays a major role in the regulation of megakaryopoiesis and thrombopoiesis1by promoting the proliferation and maturation of megakaryocyte progenitors and megakaryocytes.2-4 In the adult human as well as in rat and mouse, the liver and to a lesser extent the kidney have been identified as the main TPO production sites.5-8TPO gene expression has also been detected in murine skeletal muscle, spleen, bone marrow, brain, and testis.9-11 In situ hybridization has shown that hepatocytes, renal proximal tubular cells, and bone marrow stromal cells express the TPO gene.12 13
Serum TPO concentrations are inversely related to the mass of megakaryocytes and circulating platelets, being increased in thrombocytopenia and decreased in thrombocytosis.14-17 In thrombocytopenic mice10 and humans,12 increased TPO gene expression in bone marrow has been shown that varies inversely with the peripheral blood platelet count. However, TPO production does not appear to be regulated transcriptionally in liver and kidney,5,10,11,18 the main TPO-expressing organs.5-8 The regulation of serum TPO levels is mediated by the TPO receptor found on platelets, megakaryocytes, and their progenitors.19 These cells bind, internalize, and degrade constitutively produced TPO according to a model of end-cell–mediated control.16, 18-21
The N-terminal domain of TPO displays high homology8,22 to erythropoietin (EPO), the primary regulator of red blood cell production.23 Like TPO, EPO is mainly produced by liver and kidney in the adult.23 Based on findings in animal experiments24,25 and from studies with human fetuses suffering from bilateral renal agenesis,26,27 fetal EPO production has been localized primarily in the liver. Therefore, it has been proposed that during gestation decreasing EPO expression in the liver and increasing production by the kidney lead to a switch in the EPO production site from the liver to the kidneys.25-27Recently, it has been shown28 that the liver is the primary site of EPO production not only in fetal but also in neonatal life. A significant increase of EPO mRNA expression in the kidneys after the 30th week of gestation may indicate the beginning of the switch in EPO production site.28 Because TPO mRNA has been detected in human fetal liver and kidney,6,8 29 it was of interest whether TPO gene expression also varies with respect to organ localization. Thus, we applied quantitative reverse transcription-polymerase chain reaction (RT-PCR) to determine tissue levels of TPO mRNA in human liver, kidney, spleen, lung, and bone marrow at different stages of gestation.
MATERIALS AND METHODS
Patients/Subjects
Tissue samples of 26 individuals were obtained at routine postmortem examinations after written parental consent. The gestational age ranged from 17 to 36 weeks, with a median of 26 weeks. Tissue specimens were taken from 12 fetuses after elective termination of pregnancy because of severe malformations or congenital disorders (gestational age, 17 to 32 weeks) and from 14 preterm neonates (24 to 36 weeks of gestation) with perinatal death. The diagnoses were as follows:
Spontaneous abortion or intrauterine death (n = 3), acute twin-twin transfusion syndrome (n = 1), malformations of the central nervous system (Dandy-Walker malformation: n = 1, Arnold-Chiari malformation: n = 2, complex malformation: n = 1), congenital renal malformations (renal cystic malformation: n = 3, renal agenesis: n = 1), multiple malformations (n = 5), severe congenital heart failure (n = 1), chromosomal abnormalities (trisomia 18: n = 1, trisomia 21: n = 3), neonatal complications in preterms who died during the first 4 days of life (n = 4).
Immediately after death, blood was collected from a peripheral vein, the umbilical vein, or the heart, and blood cell counts were performed if possible. From a clotted blood sample, serum was removed immediately and stored at −20°C until measurement of the TPO concentration. At routine postmortem examination, tissue biopsy specimens from liver, kidney, spleen, lung, and bone marrow were obtained and immediately snap-frozen in liquid nitrogen. The time interval from death to examination and sample retrieval ranged from 0.5 to 7 days (median, 3.0 days; mean, 3.3 ± 1.8 days). All deceased fetuses and newborns were stored at 4°C until postmortem examination. In all patients except for one, separate tissue specimens from the right and left liver lobe were taken.
Preparation of Total RNA
Tissue samples were weighed and homogenized in 10 mL 4 mol/L guanidinium thiocyanate solution with 0.1 mol/L β-mercaptoethanol per gram tissue using a Polytron homogenizer (Kinematica GmbH, Luzern, Switzerland) at setting 10 for 20 seconds. Homogenates were centrifuged at 4°C, and 700 μL of the supernatant was used to extract total RNA by the acidic phenol-chloroform method.30 RNA was dissolved in diethyl pyrocarbonate–treated water and its concentration was measured by absorbance at 260 nm. Aliquots of the RNA were run on a 1.1% agarose gel containing 2.2% formaldehyde to check the integrity of the RNA.
Reverse Transcription
Five micrograms of total RNA was reverse transcribed into first-strand cDNA using M-MLV SuperScript reverse transcriptase (GIBCO-BRL Life Technologies, Eggenstein, Germany) with 1 μg oligo-dT15primers in a total reaction volume of 25 μL. After initial denaturation of RNA and primers at 68°C for 10 minutes, 200 μmol/L of each dNTP, reaction buffer, and 100 U enzyme were added. The final buffer concentrations were 50 mmol/L Tris-HCl pH 8.3, 75 mmol/L KCl, 3 mmol/L MgCl2, 10 mmol/L dithiothreitol. The reaction was allowed to proceed for 45 minutes at 42°C followed by 45 minutes at 52°C, and was terminated by boiling of the samples for 10 minutes. Negative control reactions without RNA or without reverse transcriptase were performed to check for RNA carry-over and contamination with genomic DNA, respectively. cDNA stocks were kept at −20°C until further analysis.
PCR
Before quantitation by competitive PCR, we performed PCRs for glycerol aldehyde 3-phosphate dehydrogenase (GAPDH) to ensure integrity and comparable amounts of cDNA and PCRs for TPO to estimate the TPO cDNA concentration. PCR was performed in 1X reaction buffer (20 mmol/L Tris-HCl pH 8.4, 50 mmol/L KCl, 1.5 mmol/L MgCl2) with 200 μmol/L of each dNTP, 0.4 μmol/L of each 5′ and 3′ primer, 1 μL of cDNA template, and 0.75 U of Taq DNA polymerase (GIBCO-BRL Life Technologies) in a total reaction volume of 50 μL. Primer sequences are listed in Table 1. After an initial denaturation step of 3 minutes at 94°C, 30 (GAPDH) and 35 (TPO), respectively, cycles of PCR amplification with 1 minute at 94°C, 1 minute 30 seconds at 55°C, respectively, 58°C and 3 minutes at 72°C were performed, followed by a final elongation step of 7 minutes at 72°C. The PCR products were analyzed by agarose gel electrophoresis and ethidium bromide staining. Fragment lengths were determined by comparison with the 100-bp DNA ladder (GIBCO-BRL Life Technologies). The expected PCR product lengths were 256 bp for GAPDH and 404 bp for TPO.
PCR Primers Specific for GAPDH and TPO cDNA, to Generate the T7 RNA Polymerase Template (5′ T7-TPO and 3′ dT-TPO primers) and the TPO Competitor DNA (5′ TPO composite and 3′ TPO primers)
| . | Nucleotide Sequence . |
|---|---|
| 5′ GAPDH primer | 5′-ATC ATC CCT GCC TCT ACT GG-3′ |
| 3′ GAPDH primer | 5′-TGG GTG TCG CTG TTG AAG TC-3′ |
| 5′ TPO primer | 5′-CGT TTC CTG ATG CTT GTA GG-3′ |
| 3′ TPO primer | 5′-GAA GGA GAA TAT CCA GGC TG-3′ |
| 5′ T7-TPO primer | 5′-GGA TCC TAA TAC GAC TCA CTA TAG GGA GGC GTT TCC TGA TGC TTG TAG G-3′ |
| 3′ TPO-dT primer | 5′-TTT TTT TTT TTT TTT TTT TTG AAG GAG AAT ATC CAG GCT G -3′ |
| 5′ TPO composite primer | 5′-CGT TTC CTG ATG CTT GTA GG = C AAA CAG GAC TTC TGG ATT G-3′ |
In the sequence of the 5′ TPO composite primer, the position of the 86-bp deletion with respect to the TPO cDNA sequence8is indicated (=).
Construction of TPO Competitor DNA
As TPO competitor DNA, a TPO PCR product with an 86-bp deletion was used. It was constructed with a composite 5′-primer and the 3′-primer used in TPO PCR (Table 1). We prepared cDNA from acidic phenol-chloroform–extracted30 RNA from human hepatoma HepG2 cells31 by RT as described above. This cDNA was amplified with the TPO competitor primer pair under the same reaction conditions as in TPO PCR. The correct fragment length of 318 bp was confirmed by agarose gel electrophoresis and ethidium bromide staining. PCR mixtures that showed strong signals with the expected size were pooled and the competitor fragment was purified with the Wizard PCR Preps Purification System (Promega, Madison, WI) according to the manufacturer’s instructions. After elution with 10 mmol/L Tris-HCl pH 7.6, the concentration was determined by absorbance at 260 nm. The competitor stock solution was stored at −20°C.
Quantitation by Competitive PCR
The competitive PCR was performed with the same reaction parameters as the TPO PCR. In addition to 1 μL of cDNA, the competitive PCR reaction mixtures contained 1 μL of competitor DNA with known concentration. For each cDNA sample, we prepared a set of four to six reactions with different amounts of competitor. Its concentrations ranged from 150 fg/μL to 0.001 pg/μL in twofold dilutions in 10 mmol/L Tris-HCl pH 7.5, 1 mmol/L EDTA. The cDNA PCR product and the competitor PCR product were distinguished by size (404 bp v 318 bp). By agarose gel electrophoresis we identified the competitor concentration where sample cDNA and competitor gave equally strong ethidium fluorescence signals. From this equivalence concentration, we calculated TPO mRNA concentrations per microgram total RNA and per gram tissue, taking into account the RT efficiency which was determined as described below, the amount of cDNA in the PCR reaction, the amount of extracted RNA per gram tissue, and the combination of double-stranded competitor with single-stranded cDNA.32
Determination of RT Efficiency
A TPO riboprobe was constructed by in vitro transcription. As a template we used a TPO PCR product that additionally contained the T7 promoter at its 5′ end and an oligo-(dT)20 stretch at its 3′ end. It was constructed from HepG2 cDNA by PCR with the primers shown in Table 1 under the same conditions that were used in TPO PCR. The PCR product was purified with the Wizard PCR Preps Purification System (Promega) according to the manufacturer’s instructions. After elution with diethyl pyrocarbonate-treated water, the concentration was determined by reading the absorbance at 260 nm. One microgram of this template was incubated for 1 hour at 37°C with 2.5 U of T7 RNA polymerase (TaKaRa Biomedicals, Shiga, Japan) in 1X reaction buffer (40 mmol/L Tris-HCl pH 8.0, 8 mmol/L MgCl2, 2 mmol/L spermidine) supplemented with 5 mmol/L dithiothreitol and 0.4 mmol/L rNTPs in a reaction volume of 50 μL. After in vitro transcription, the template DNA was digested with 5 U RNase-free DNase I (TaKaRa) for 10 minutes at 37°C. The TPO riboprobe was purified by phenol-chloroform extraction and ethanol precipitation. The pellet was redissolved in diethyl pyrocarbonate–treated water and the RNA concentration was determined by absorbance at 260 nm.
We prepared total RNA from the murine hepatoma cell line HepaC1C7 (kindly provided by Dr Oliver Hankinson, Los Angeles, CA) by the acidic phenol-chloroform method.30 RT and PCR as described above showed no TPO signal due to the species specificity of the TPO primer sequences, so this RNA was used as a carrier RNA. We mixed the TPO riboprobe with the carrier RNA to give concentrations of 0, 25, 250, and 2,500 fg TPO cRNA per microgram total RNA and performed RT and competitive PCR as described above. Each RNA sample was reverse transcribed five times (in total) on two different days, and each cDNA sample was quantitated three times by competitive PCR. The results were used to calculate the efficiency of the RT and the variability of the competitive PCR.
Determination of Serum TPO Levels
Serum TPO levels were measured by sandwich enzyme-linked immunosorbent assay (ELISA) (Quantikine; R&D Systems, Wiesbaden, Germany) following the manufacturer’s instructions. Briefly, samples or recombinant human TPO standards were pipetted into microplate wells coated with a monoclonal anti-TPO antibody. After a washing step, a horseradish peroxidase–linked monoclonal antibody specific for TPO was added. The color reaction was developed with H2O2 and tetramethylbenzidine and stopped with sulfuric acid. Colorimetric detection was performed at 450 nm using the absorbance at 540 nm to correct for unspecific background (Dynatech MR 5000; Dynatech Laboratories, Denkendorf, Germany). TPO concentrations were calculated from the corrected optical densities and the standard curve.
Statistical Analysis
Statistical calculations regarding the TPO mRNA concentrations per microgram total RNA or per gram tissue were performed by paired Student’s t-test. Repeated measures analysis of variance followed by Tukey-Kramer multiple comparisons test was used to examine RT efficiency measurements and organ distribution data. Correlations were analyzed by linear regression and Pearson correlation analysis. In all cases, two-tailed P values below .05 were considered statistically significant.
RESULTS
RT/Competitive PCR
Construction of the standard for competitive PCR.
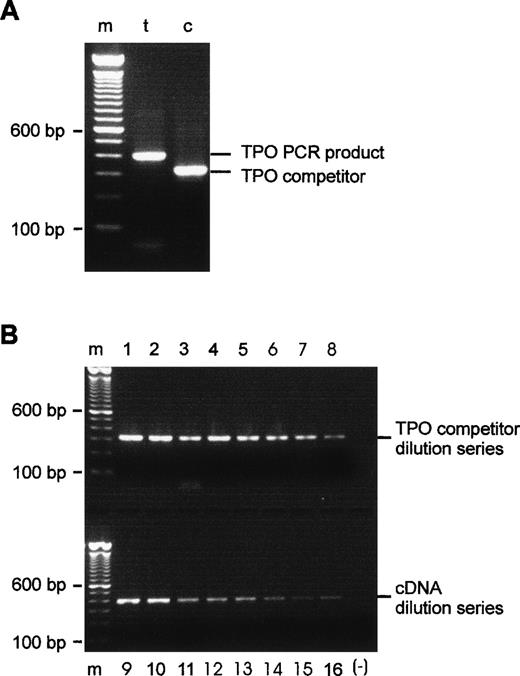
The PCR amplification of HepG2 cDNA with the competitor-specific 5′ composite primer and the TPO 3′ primer gave a single fragment of the expected size, 318 bp. After purification, reamplification with the TPO primer pair yielded the competitor fragment only. Figure 1A shows reamplified competitor in comparison with the TPO cDNA amplification product. PCR amplifications of TPO competitor and TPO cDNA twofold dilution series confirmed the apparent linearity of the assay, as can be seen in Fig1B.
Evaluation of the TPO competitor DNA. (A) PCR products after purification and reamplification. Lane t, 404-bp TPO product generated by 5′ and 3′ TPO primers; lane c, 318-bp competitor, produced by 5′ composite and 3′ TPO primers and reamplified with 5′ and 3′ TPO primers. (B) Amplification of TPO cDNA and TPO competitor cDNA over eight steps of twofold dilution appears to be linear by visual inspection. Lanes 1 through 8, TPO competitor dilution series; lanes 9 through 16, cDNA dilution series; m, 100-bp DNA ladder; (−), negative PCR control, all reagents except template.
Evaluation of the TPO competitor DNA. (A) PCR products after purification and reamplification. Lane t, 404-bp TPO product generated by 5′ and 3′ TPO primers; lane c, 318-bp competitor, produced by 5′ composite and 3′ TPO primers and reamplified with 5′ and 3′ TPO primers. (B) Amplification of TPO cDNA and TPO competitor cDNA over eight steps of twofold dilution appears to be linear by visual inspection. Lanes 1 through 8, TPO competitor dilution series; lanes 9 through 16, cDNA dilution series; m, 100-bp DNA ladder; (−), negative PCR control, all reagents except template.
Efficiency of RT.
A TPO RNA fragment was generated by in vitro transcription. This TPO riboprobe was added to RNA from a murine cell line and quantitated by RT and competitive PCR. Carrier RNA without the TPO riboprobe gave no RT-PCR signal for TPO. At the concentrations of 25, 250, and 2,500 fg TPO riboprobe per microgram total RNA, 40% ± 7% (mean ± SD) of the RNA were reverse transcribed into cDNA. Comparing the different TPO cRNA concentrations, no statistically significant differences in RT efficiency were detected (P = .17), nor did the difference between the separate RT experiments reach statistical significance (P = .92). In a former study,32 the efficiency of a similar RT protocol was assessed with an in vitro–transcribed full-length EPO mRNA and found to be 35% ± 2%. Therefore, in calculations of the TPO mRNA concentrations from the equivalence points of the competitive PCR, a correction factor of 40% efficiency of the RT was included.
Reproducibility of the RT-PCR.
The results of the repeated RT and competitive PCR for determining the RT efficiency were used to calculate the variability of the RT and competitive PCR as a whole. The comparison of RNA samples reverse transcribed and quantitated in parallel during the same experiment yielded an intra-assay variability of 16%. The inter-assay variability of 18% was derived from RNA samples reverse transcribed on different days and quantitated in separate experiments. Densitometric analysis of the gels did not enhance the accuracy or reproducibility of the competitive PCR.
Quantitation of TPO mRNA in Tissue Samples
RNA integrity.
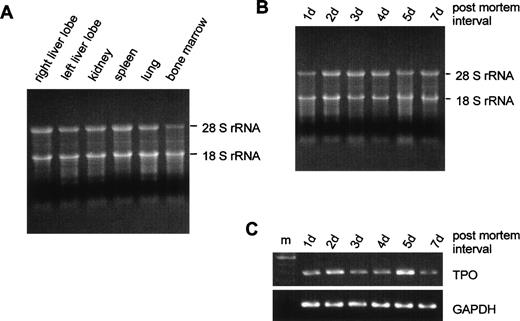
Total RNA was isolated from tissue samples obtained at routine postmortem examination at 0.5 to 7 days after death. The RNA quality appeared to be comparable in all organs that were analyzed for TPO gene expression (Fig 2A), although some degradation occurred at prolonged intervals between death and sampling (Fig 2B). PCR signals for GAPDH appeared equal from samples obtained at different times postmortem, and the PCR signals for TPO varied independently from the delay between death and biopsy (Fig 2C). Furthermore, no significant correlation was found between the amount of extracted RNA per gram tissue, the amount of TPO mRNA per microgram total RNA or per gram tissue, and the interval between death and examination (data not shown).
Influence of the interval between death and tissue sampling on RNA integrity. (A) Fifteen micrograms of RNA from different organs were run on a 1.1% agarose gel containing 2.2% formaldehyde. Tissue samples were obtained 3 days after death. (B) RNA from left liver lobes obtained at different time intervals after death (indicated above gel). (C) GAPDH and TPO RT-PCR signals corresponding to the RNA samples shown in (B); m, 100-bp DNA ladder.
Influence of the interval between death and tissue sampling on RNA integrity. (A) Fifteen micrograms of RNA from different organs were run on a 1.1% agarose gel containing 2.2% formaldehyde. Tissue samples were obtained 3 days after death. (B) RNA from left liver lobes obtained at different time intervals after death (indicated above gel). (C) GAPDH and TPO RT-PCR signals corresponding to the RNA samples shown in (B); m, 100-bp DNA ladder.
Expression in liver and kidneys.
TPO mRNA was detectable in liver and kidney samples from all patients. The quantitation yielded specific TPO mRNA concentrations between 0.04 and 8.25 attomoles (amol; 10−18 moles) TPO mRNA/μg RNA in the right liver lobe, between 0.02 and 2.94 amol TPO mRNA/μg RNA in the left liver lobe, and between 0.01 and 1.04 amol TPO mRNA/μg RNA in the kidney. Using the paired Student’s t-test, the differences were not significant (P = .44 left v right liver lobe; P = .59 left liver lobe v kidney; P= .25 right liver lobe v kidney).
Related to gram tissue, the right liver lobe contained 446 amol TPO mRNA/g tissue and the left liver lobe 505 amol/g tissue (median values) with no significant difference (P = .25). The tissue-specific expression in the kidney showed a median of 134 amol/g tissue, which is not significantly lower than in the liver lobes (P = .11v left and P = .08 v right liver lobe). Data on all organs are summarized in Table 2. Because the differences between the liver lobes were not statistically significant, for further statistical analyses we calculated the mean value of TPO mRNA and total RNA from both liver lobes.
TPO mRNA Expression in Right and Left Liver Lobe, Kidney, Spleen, Lung, and Bone Marrow of Human Fetuses and Preterm Neonates
| . | Pos. (%) . | Concentration of TPO mRNA (amol/μg RNA) . | Tissue-Specific TPO mRNA (amol/g tissue) . | ||
|---|---|---|---|---|---|
| Range . | Median . | Range . | Median . | ||
| Liver, right lobe | 100 | 0.04-8.25 | 0.210 | 50-17,799 | 446 |
| n = 26 | |||||
| Liver, left lobe | 100 | 0.02-2.94 | 0.227 | 33-5,337 | 505 |
| n = 25 | |||||
| Kidney | 100 | 0.01-1.04 | 0.124 | 5-1,817 | 134 |
| n = 21 | |||||
| Spleen | 88 | 0.04-1.04 | 0.217 | 21-1,454 | 252 |
| n = 25 | |||||
| Lung | 76 | 0.03-0.31 | 0.143 | 13-214 | 55 |
| n = 17 | |||||
| Bone marrow | 84 | 0.04-0.65 | 0.214 | ND | ND |
| n = 19 | |||||
TPO cDNA was quantified by competitive PCR, and mRNA concentrations were calculated considering the RT efficiency, the amount of reverse transcribed RNA, and the concentration of total RNA per gram tissue. Median and range include RT-PCR positive samples only.
Abbreviations: n, total number of tissue samples; Pos., fraction of positive samples in TPO RT-PCR; ND, not determined.
Expression in spleen, lung, and bone marrow.
TPO mRNA was detectable in 22 of 25 (88%) spleen samples, in 13 of 17 (76%) lung samples, and in 16 of 19 (84%) bone marrow samples. The median specific TPO mRNA concentrations in positive samples were 0.04 to 1.04 amol/μg RNA in spleen, 0.03 to 0.31 amol/μg RNA in lung, and 0.04 to 0.65 amol/μg in bone marrow. These concentrations are lower than those obtained for liver, but only the expression in lung compared with liver, kidney, spleen, or bone marrow was significantly lower (P = .05 lung v liver, kidney, or bone marrow,P = .01 v spleen). No other significant differences in TPO mRNA expression between the organs were found (P = .31 liver v spleen, P = .45 kidney v spleen,P = .10 bone marrow v spleen, P = .24 liverv bone marrow, P = .27 kidney v bone marrow).
The median tissue-specific TPO gene expression in spleen (252 amol/g tissue, only positive samples) was lower than in liver and higher than in kidney, but those differences were not significant (P = .11v liver, P = .34 v kidney). In the lung, the median TPO expression (55 amol/g tissue, only positive samples) was significantly lower than in the other organs (P = .002 lungv liver, P = .04 v kidney, P = .006v spleen). For bone marrow the tissue-specific TPO mRNA production could not be calculated because organ weights could not be determined.
Organ distribution.
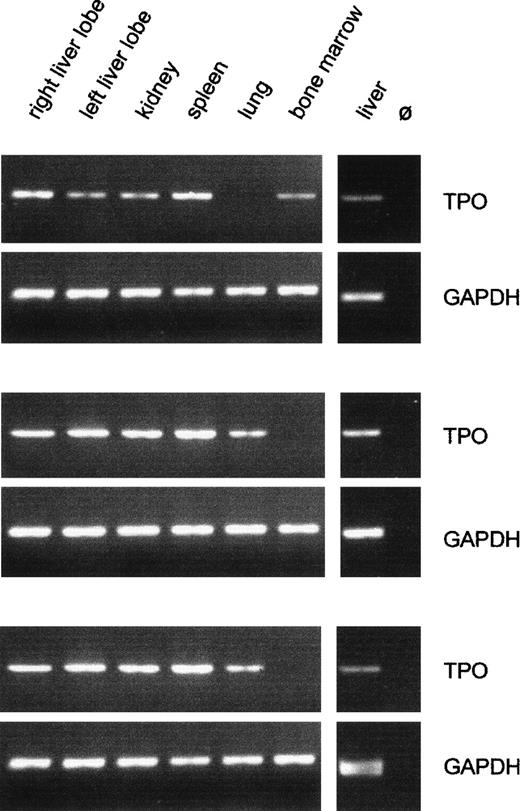
The TPO PCR showed large variations between different organs in the same patient as well as between the same organ in different patients. The latter observation reflects the wide range of TPO mRNA contents seen by competitive PCR. Figure 3 shows typical results of TPO- and GAPDH-PCR with cDNA samples from three patients.
Qualitative analysis of TPO gene expression in fetal organs. Typical RT-PCR results from three patients are shown. The GAPDH signal did not differ between organs and between individuals, confirming constant efficiency of RNA preparation and cDNA synthesis. The intensity of the TPO signal varied between different organs and between the same organ of different individuals. Only liver and kidney samples were always positive for TPO mRNA. m, 100-bp DNA ladder; Ø, negative RT control, liver RNA plus all reagents except reverse transcriptase.
Qualitative analysis of TPO gene expression in fetal organs. Typical RT-PCR results from three patients are shown. The GAPDH signal did not differ between organs and between individuals, confirming constant efficiency of RNA preparation and cDNA synthesis. The intensity of the TPO signal varied between different organs and between the same organ of different individuals. Only liver and kidney samples were always positive for TPO mRNA. m, 100-bp DNA ladder; Ø, negative RT control, liver RNA plus all reagents except reverse transcriptase.
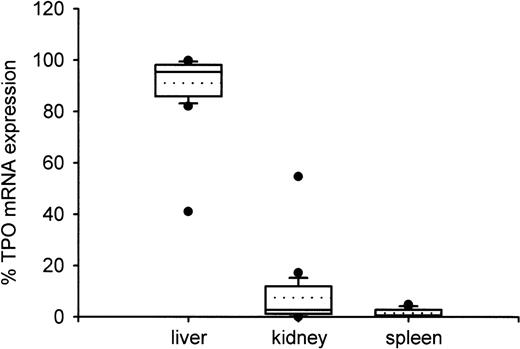
From the specific TPO gene expression data, we calculated relative amounts of TPO mRNA in liver, kidney, and spleen as percentages of the amount of TPO mRNA in these three organs taken together (Fig 4). With one exception, the liver accounted for more than 80% of TPO expression with a median of 95.3%. The relative TPO expression was higher in kidneys (median, 2.7%) than in spleen (median, 0.6%), but the difference did not reach statistical significance (P = .27).
Distribution of TPO gene expression between liver, kidney, and spleen. Boxes indicate the median (straight line) with 25th and 75th percentiles. In addition, error bars with 10th and 90th percentiles, outliers (circles), and mean value (dotted line) are shown. The fractional amount of TPO gene expression in liver was significantly higher than in kidney or in spleen (P < .001), while kidney and spleen did not differ significantly (P = .12). Only one patient showed TPO mRNA expression below 80% in the liver and above 20% in the kidneys.
Distribution of TPO gene expression between liver, kidney, and spleen. Boxes indicate the median (straight line) with 25th and 75th percentiles. In addition, error bars with 10th and 90th percentiles, outliers (circles), and mean value (dotted line) are shown. The fractional amount of TPO gene expression in liver was significantly higher than in kidney or in spleen (P < .001), while kidney and spleen did not differ significantly (P = .12). Only one patient showed TPO mRNA expression below 80% in the liver and above 20% in the kidneys.
In the patient with unusual TPO mRNA distribution, 41.1% of TPO mRNA was expressed in the liver, 54.7% in the kidney, and 4.1% in the spleen (Fig 4). This patient who suffered from a trisomia 21 had normal TPO mRNA expression per microgram RNA or per gram tissue in all organs, but showed a remarkably low liver weight compared to fetuses with the same or nearly the same gestational age (data not shown).
Platelet counts, serum TPO levels, and gestational age.
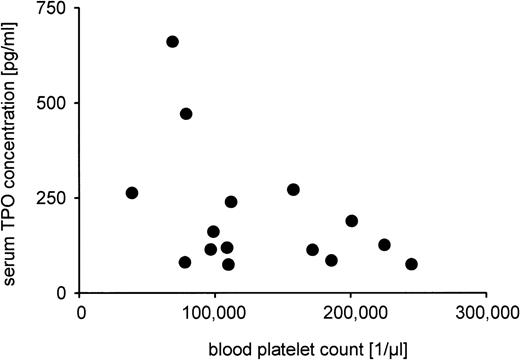
The platelet counts and serum TPO levels could not be measured in all patients due to the lack of blood samples. Median platelet count was 112,000/μL with a range from 39,000 to 245,000/μL (n = 17), and median serum TPO concentration was 131 pg/mL (n = 22), ranging from 52 to 661 pg/mL. No statistically significant correlation was found between gestational age, serum TPO level, or platelet count (data not shown). Also, the reciprocal relationship between serum TPO level and platelet count showed no significance (Fig5).
Analysis of the relationship between serum TPO concentration and blood platelet count. Serum TPO measurement by ELISA and blood platelet count were possible in 15 patients. Pearson correlation analysis yielded a correlation coefficient of r = .45 that was not statistically significant (P = .09).
Analysis of the relationship between serum TPO concentration and blood platelet count. Serum TPO measurement by ELISA and blood platelet count were possible in 15 patients. Pearson correlation analysis yielded a correlation coefficient of r = .45 that was not statistically significant (P = .09).
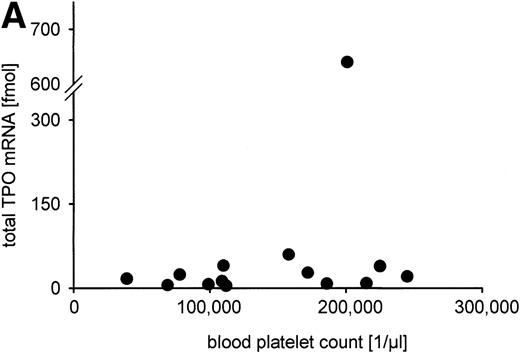
The total TPO mRNA expressed in liver, kidney, and spleen was calculated from organ weights and TPO mRNA per gram tissue. The sum of TPO mRNA expression (median, 20.7 fmol TPO mRNA per individual; range, 1.8 fmol to 640 fmol) was not correlated to serum TPO level or blood platelet count, as is shown in Fig 6A and B. Regarding the different organs, no significant correlations of TPO mRNA expression per microgram RNA or per gram tissue to serum TPO concentration or blood platelet count were detected (data not shown).
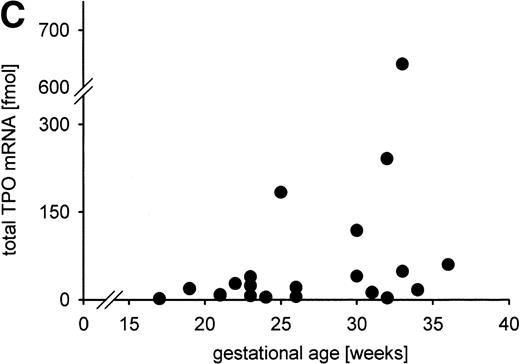
Constitutive TPO gene expression in the human fetus. No correlations were found between the total TPO mRNA amount expressed in liver, kidney, and spleen (in fmol per individual) and (A) blood platelet count (in cells per microliter); (B) serum TPO concentration (in pg/mL); (C) gestational age (in weeks). Total TPO mRNA was calculated from the TPO mRNA concentration per gram tissue and the organ weight as the sum of the TPO mRNA amount of liver, kidneys, and spleen. TPO mRNA produced in lung and bone marrow was not included because the organ weights could not be determined.
Constitutive TPO gene expression in the human fetus. No correlations were found between the total TPO mRNA amount expressed in liver, kidney, and spleen (in fmol per individual) and (A) blood platelet count (in cells per microliter); (B) serum TPO concentration (in pg/mL); (C) gestational age (in weeks). Total TPO mRNA was calculated from the TPO mRNA concentration per gram tissue and the organ weight as the sum of the TPO mRNA amount of liver, kidneys, and spleen. TPO mRNA produced in lung and bone marrow was not included because the organ weights could not be determined.
We observed a trend of increasing total TPO mRNA expression with gestational age (Fig 6C). However, no correlations of gestational age and TPO mRNA expression per microgram RNA or per gram tissue were detected (data not shown), nor did the distribution of TPO mRNA expression in liver, kidney, and spleen change with gestational age (data not shown).
DISCUSSION
In the present study, we identified the liver as the main TPO mRNA expressing organ in human fetuses and preterm neonates. Our finding extends data from previous studies with adult human or animal tissue in which Northern blot analysis, RNase protection assay, or in situ hybridization were applied to detect TPO mRNA expression.5-8,12,13 In three of these reports, strong TPO Northern blot signals in fetal liver were described.6,8 13We showed that the predominant role of the fetal liver is not due to stronger TPO gene expression because the TPO mRNA content relative to total cellular RNA was almost equal in liver, kidney, spleen, and bone marrow. However, the higher organ weight made the liver the dominant site of fetal TPO production, contributing over 90% to the total body TPO mRNA. Because we could not determine the weight of the bone marrow, one should be aware that this estimate may be slightly too high.
Extrahepatic expression of TPO has been reported previously for various organs.9-12 We detected TPO mRNA in human fetal liver, kidney, spleen, lung, and bone marrow. TPO mRNA levels per microgram RNA were moderately lower in kidney than in liver, spleen, and bone marrow. This could be due to the fact that the TPO-producing cells in the kidney are less abundant since only proximal tubular cells and, less consistently, distal tubular cells express TPO mRNA.12Interestingly, we found a wide variation of TPO mRNA concentration and even some spleen, lung, and bone marrow samples that were negative for TPO PCR. This might indicate that stimulating or repressing influences on TPO gene expression exist that have not been identified so far. In any case, they may reflect major individual differences in TPO gene expression. The heterogeneity of the diagnoses did not allow a meaningful analysis about whether the primary disease or the cause of death was connected with the amount of TPO mRNA in the tissues. Because of ethical reasons, tissue from healthy fetuses or neonates was not available for this study.
We have found no evidence that tissue autolysis or RNA degradation influenced the amount of TPO mRNA in our samples, although there was a delay of up to 7 days until postmortem examination and retrieval of the specimen. This is in agreement with previous reports of the successful isolation of mRNA from pancreatic tissue that is especially rich in RNases.33 Shorock et al33 sampled human tissue at routine postmortem examinations 48 hours after death, which was of sufficient quality to give in situ hybridization signals for insulin that were “comparable to [those] seen in surgical material.”33 Finger et al34 showed that mRNA is still intact for in vitro translation even though degradation of the 28 S rRNA may be detectable. Furthermore, a recent study on human fetal and neonatal EPO gene expression28 reported EPO mRNA levels that were apparently not influenced by degradation during the interval between death and examination.
In situ hybridization has shown very faint TPO mRNA signals in spleen from adult humans but strong signals in kidney.12 In contrast, we found almost equal amounts of TPO mRNA per microgram RNA and per gram tissue in fetal kidney and spleen. This indicates a difference between fetal and adult TPO gene expression, proposing that the spleen is involved in fetal TPO production. Splenic TPO production might be relevant to regulate fetal hematopoiesis in the spleen in a paracrine way.
We detected TPO mRNA in fetal lung, although the expression was lower than in fetal liver, kidney, spleen, and bone marrow. This suggests that only a small proportion of cells in the lung express the TPO gene. The identity of these cells and the biological relevance of TPO production in the lung with regard to total TPO synthesis remain to be studied. Based on calculations of the megakaryocyte distribution in the body, the lung has been proposed as the main site of platelet production.35 However, this concept has been doubted recently because immunohistochemical studies have failed to show entrapped megakaryocyte fragments or nuclei in the lung of mice during stimulated thrombopoiesis.36
Our result that in the fetus the bone marrow expresses as much TPO mRNA per microgram total RNA as the liver gives new importance to the question of how TPO gene expression in bone marrow is regulated.5,10-12 RT-PCR and in situ hybridization experiments showed that TPO mRNA expression in murine and human bone marrow was low in comparison with liver and increased in thrombocytopenic individuals.10,12 In contrast to these studies, we found equal TPO mRNA concentrations per microgram total RNA in fetal bone marrow and fetal liver. TPO mRNA expression in fetal bone marrow was apparently not correlated with blood platelet count. However, conclusions about the regulation of TPO production in the fetal bone marrow would be premature because we obtained no data on megakaryocyte counts, which seem to be important for TPO regulation.18 Moreover, we cannot exclude that unknown factors from the underlying diseases of our patients have influenced TPO gene regulation in the bone marrow. TPO mRNA expression in the bone marrow occurs only in the bone marrow stromal cells.12 The diseases of the fetuses and neonates might have affected the proportion of stromal cells in the marrow samples, leading to variable bone marrow TPO mRNA levels which would further mask a relationship between TPO mRNA expression and platelet counts.
We found no significant differences in TPO mRNA expression related to microgram total RNA or to gram tissue in liver, kidney, and spleen. This may in part be caused by the wide range of values obtained for each organ. However, we observed a trend of lower values in the kidney and possibly in the spleen as well. The cell types that express the TPO gene as identified by in situ hybridization12 make up different proportions of the organs. In the liver, hepatocytes are much more abundant than proximal tubular cells in the kidney and splenic/marrow cells in the spleen. Thus, lower TPO mRNA expression in the kidney may reflect the lower proportion of TPO-producing cells in this organ. The intermediary value of TPO mRNA in the spleen suggests that the fetal spleen contains more TPO-producing cells than the kidney but less than the liver, and that the fetal spleen may produce TPO to regulate fetal megakaryocytopoiesis/thrombopoiesis in a paracrine way. This possibility needs to be investigated by in situ hybridization for TPO gene expression in the fetal spleen. In studies with mice5-7, 9-11 and adult humans,6 8 the strongest signals of TPO mRNA per equal amounts of total RNA were found in the liver. The liver is the main TPO-producing organ in the fetus and neonate as well, as is reflected by its over 90% contribution to total body TPO mRNA.
Serum and plasma TPO levels have been reported for patients with abnormalities in blood platelet counts and for healthy adults.14-17 TPO levels in normal adults were not correlated with their platelet numbers, which indicates individual variations in the balance between TPO and platelets.15,17Our results propose that this holds true for human fetuses and preterm neonates as well, confirming a recent study in which no correlation between TPO levels and platelet counts of preterm and term babies was found.37 The range of the platelet counts we measured (39,000 to 245,000/μL) was narrower than the range reported by Murray et al37 (21,000 to 371,000/μL). Plasma TPO concentrations of preterm neonates determined by Murray et al37 ranged from 32 to 318 pg/mL, with a median of 132 pg/mL. These values are in line with our data (median, 131 pg/mL; range, 52 to 661 pg/mL), although we measured TPO concentrations in serum instead of plasma.
The lack of a correlation between TPO mRNA concentration per microgram total RNA or per gram tissue and platelet count suggests that the level of circulating TPO is regulated posttranscriptionally. We were not able to assess the number of megakaryocytic cells in the marrow or in the blood. This would be important to fully understand the regulation of TPO levels in the fetus, because it has been shown that megakaryocytes as well as platelets seem to influence the blood TPO concentration.16 18-21
The increase in total TPO mRNA with gestational age probably reflects the growth of the fetus with increasing organ weights, while TPO mRNA per gram tissue remains constant. The fractional contribution of TPO mRNA expression in liver, kidney, and spleen did not change during the investigated period of gestation. In adults, the liver has been identified as the main TPO-producing organ,5-8 although the fractional amounts of TPO gene expression in different organs have not been estimated. Our findings show that in contrast to EPO production,24,25 28 the liver is the main TPO production site both in the fetus and in the adult.
ACKNOWLEDGMENT
We thank P. Freitag for excellent technical assistance, B. Nürnberg for secretarial help, and G. Fletschinger for preparation of figures.
Supported by the Deutsche Forschungsgemeinschaft (DFG) (Sonderforschungsbereich [SFB] 367).
The publication costs of this article were defrayed in part by page charge payment. This article must therefore be hereby marked “advertisement” in accordance with 18 U.S.C. section 1734 solely to indicate this fact.
REFERENCES
Author notes
Address reprint requests to Eva-Maria Wolber, Institute of Physiology, Medical University of Luebeck, Ratzeburger Allee 160, 23538 Luebeck, Germany.


This feature is available to Subscribers Only
Sign In or Create an Account Close Modal