Abstract
Patients with the human genetic disorder ataxia-telangiectasia (A-T) are characterized by immunodeficiency and a predisposition to develop lymphoid malignancies. The gene mutated in A-T patients, ATM, codes for a high molecular weight protein that is implicated in DNA damage recognition and cell cycle control. The ATM protein does not change in amount or cellular distribution throughout the cell cycle or in response to DNA damaging agents. Because peripheral blood mononuclear cells (PBMCs) are largely in a state of quiescence and can be readily stimulated to enter a proliferative phase and because A-T cells exhibit growth abnormalities and senescence, indicative of a general intracellular defect in signalling, we chose PBMCs to examine the relationship of ATM to the proliferative status of the cell. We show here that ATM protein is present at low levels in freshly isolated PBMCs and increases approximately 6-fold to 10-fold in response to a mitogenic stimulus, reaching a maximum after 3 to 4 days. A similar, but delayed response, was evident in the presence of serum only. This increase in ATM protein was accompanied by an increase in ATM kinase activity. While expression of ATM protein increased during proliferation, ATM mRNA expression was unchanged in stimulated and unstimulated cells and there was no evidence for increased ATM protein stability in the phytohemagglutinin (PHA)-treated cells. In keeping with the reduced levels of ATM in quiescent cells, the extent of radiation-induction of the p53 pathway was significantly lower than in mitogen-stimulated cells. Basal levels of p21 were elevated in quiescent cells, and the response to radiation was negligible or reduced compared with proliferating cells over a 2-hour period. Overall, the data suggest that the increase in ATM protein in proliferating cells is due to posttranscriptional regulation and points to a role for ATM in more general signalling.
ATAXIA-TELANGIECTASIA (A-T) is a primary immunodeficiency disease characterized by defects in both humoral- and cell-mediated immunity.1,2 Reduction in T-cell helper activity in A-T patients does not appear to be sufficient to account for the complete absence of IgA, which is observed in some cases, suggesting that there exists either an intrinsic defect in the maturation of IgA and IgE producing cells or a more general defect in genetic recombination. Absence of, or abnormal development of the thymus, is also a consistent feature of A-T.1 The thymic abnormalities do not appear to be due to atrophy, but rather to a defect in development.2 The CD4+/CD8+ T-cell ratio in A-T patients is reversed compared with normals due to a decrease in the total numbers of CD4+ cells.3 Disturbances in recombination are also observed in T cells as elevated recombination of T-cell receptor genes4 and increased rates of spontaneous intrachromosomal recombination with exogenously added DNA.5However, signal and coding joint formation are both normal in V(D)J recombination.6
One of the major hallmarks of A-T is predisposition to malignancy.7 As many as one third of A-T patients develop cancer with the majority of these being of the lymphoid type.8 Most of the leukemias are T cell in origin; acute lymphocytic leukemia in younger patients and T-cell prolymphocytic leukemia (T-PLL) in older patients.9 In contrast to the leukemias, the lymphomas, which represent up to 50% of malignancies, are of both T-cell and B-cell origin.10 A smaller proportion (15% to 20%) of tumors in A-T patients are nonlymphoid.9,11 Nonrandom chromosomal translocations and inversions are frequently observed in A-T lymphocytes, and some of these are associated with the activation and expression of genes such as TCL1 and MTCP1, which are implicated in the pathogenesis of T-PLL.12
The cloning of the gene mutated in A-T patients,ATM,13 has provided greater insight into the nature of the defect and the elevated prevalence of lymphoid tumors in A-T. Loss of heterozygosity studies and mutation analysis of the ATMgene have shown the presence of biallelic mutations, which lead to premature truncations or alterations in the ATM gene product in non–A-T patients with T-PLL, a leukemia seen frequently in A-T.14-18 These observations suggest that ATM is a tumor suppressor gene, the inactivation of which is important in the development of T-PLL.
It seems unlikely that immunodeficiency is responsible for the pattern of tumors that develop in A-T, but it is conspicuous that these tumours arise primarily in T and B cells. To understand whether ATM has a special role in lymphoid cells, we initially compared the amount of ATM protein in quiescent and mitogen-stimulated peripheral blood mononuclear cells (PBMCs). In response to phytohemagglutinin (PHA) or serum, the level of ATM protein increased markedly in PBMCs, but mRNA levels were comparable in the 2 populations. The extent of the radiation-induced p53 response was reduced in quiescent cells, in keeping with reduced or absent ATM. This is the first description of alteration in ATM protein in response to a mitogenic stimulus.
MATERIALS AND METHODS
Preparation and culture of PBMCs.
PBMCs were isolated from heparinized blood samples from healthy volunteers by Ficoll gradient centrifugation (Pharmacia Biotech, Piscataway, NJ). After 3 washes with phosphate-buffered saline (PBS), an aliquot was stored at −80°C as freshly isolated PBMCs. The rest of the PBMCs were resuspended at a density of 2 × 10⁶ cells/mL in RPMI 1640 medium supplemented with 10% fetal calf serum (FCS), 15 mmol/L HEPES, 2 mmol/L L-glutamine, 100 μg/mL penicillin, and 100 μg/mL streptomycin and incubated under an atmosphere of 5% CO2 at 37°C. For preparation of PHA-stimulated lymphoblasts, PHA (PHA-P; Sigma, St Louis, MO) was added at a concentration of 10 μg/mL and stimulation was monitored by 3H-thymidine uptake for 4 hours in 0.2 mL of culture. For immunoblotting, cells were harvested by centrifugation and after 3 washes with PBS, the cell pellets were stored at −80°C until use. An Epstein-Barr virus (EBV)-transformed A-T cell line, L3, was kindly provided by Dr Yosef Shiloh (Department of Human Genetics, Sackler School of Medicine, Tel Aviv, Israel).
Immunoblotting.
Cells were harvested and lysed in a lysis buffer (50 mmol/L Tris-HC1 pH 7.6, 150 mmol/L NaCl, 0.2% Triton X-100, 0.3% NP40, proteinase inhibitors added [0.1 mmol/L phenylmethylsulfonyl fluoride, leupeptin 5 mg/mL, aprotinin 1 mg/mL]). Total protein concentration of cell extracts was determined by the Bradford microassay. Protein extracts were solubilized in 0.2 vol of 5x concentrated sample buffer (0.25 mol/L Tris-HC1, pH 6.8, 0.4 mol/L dithiothreitol [DTT], 5% sodium dodecyl sulfate (SDS), 0.5% bromophenol blue and 10% glycerol) and separated on a 4.5% SDS-polyacrylamide gel for ATM and a 12% gel for p53, p21, and β-actin. After electrophoresis, proteins were transferred to Hybond C or Hybond ECL (Amersham, Arlington Heights, IL). The filters were blotted in 5% skim milk overnight, probed with antibodies, and visualized using the ECL method (Amersham). Densitometric scanning was used to quantify protein.
Quantitative reverse transcriptase-polymerase chain reaction (RT-PCR).
Quantitative PCR was performed to determine the level of ATM mRNA expression in quiescent and PHA-stimulated PBMCs as described previously.19 Nucleotides 5122-5665 were amplified for normal ATM yielding a fragment of 544-bp. Competitor DNA was a purified 402-bp fragment with exon 38 skipping amplified from ATJGifu 1 (GAT1).20 An equivalent point is reached when target ATM cDNA (544 bp) is amplified to the same extent as competitor DNA allowing for quantification of mRNA. A total of 5 μg of RNA was reverse transcribed in a total volume of 20 μL with 30 pmol of an ATM-specific antisense primer (5′-6059CCATACAAACTATCTGGCTCC-3′) by Superscript II reverse transcriptase (GIBCO-BRL, Gaithersburg, MD,). The efficiency of cDNA synthesis was approximately the same in all cases. Amplification was performed with an amount of cDNA corresponding to 0.1 μg of RNA containing 1 μL of a series of 2-fold dilutions of the competitor DNA from 1/2 × 10 attomoles to 1/256 × 10 attomoles. Cycle conditions were 35 cycles of 94°C for 1 minute, 54°C for 1 minute, and 72°C for 2 minutes.
Determination of protein half-life using cycloheximide.
Cells were resuspended at a density of 2 × 10⁶cells/mL in RPMI 1640 medium supplemented with 10% FCS, 15 mmol/L HEPES, 2 mmol/L L-glutamine, 100 μg/mL penicillin, 100 μg/mL streptomycin, and 25 μmol/L cycloheximide and incubated under an atmosphere of 5% CO 2 at 37°C for 0, 4, 8, 16, and 32 hours. In the case of PHA-stimulated lymphoblasts, after 3 days PHA stimulation, the experiment was started and PHA was also included in the above cycloheximide-containing medium.
ATM kinase assays.
PBMCs were isolated, the cells were counted and divided into 2 flasks (5 × 10⁷/mL) with RPMI and 10% serum and PHA was added to 1 flask. Both flasks were incubated at 37°C for 72 hours and the cells lysed by sonication in TGN buffer.21 After centrifugation, 700 μg of extract was precleared with protein A and protein G sepharose beads, ATM was immunoprecipitated with Ab-3 antibody (Oncogene Research, Cambridge, MA) with protein A/B sepharose beads. Immunoprecipitates were washed twice with TGN buffer, once with 100 mmol/L Tris-HCl, pH 7.5, plus 0.5 mol/L LiC1 and twice with kinase buffer (10 mmol/L HEPES, pH 7.5, 50 mmol/L glycerophosphate, 50 mmol/L NaCl, 10 mmol/L MgCl2, 10 mmol/L MnCl2, 5 μmol/L adenosine triphosphate (ATP), and 1 mmol/L DTT). Kinase reactions were performed by resuspending washed beads in 25 μL of kinase buffer containing 1 μg of GSTp53 (1-40) and 0.5 μCi [γ32p] ATP, and incubated at 30°C for 30 minutes. Proteins were analyzed by sodium dodecyl sulfate-polyacrylamide gel electrophoresis (SDS-PAGE), dried, and assayed by fluorography. Protein loading was determined by running a parallel sample of immunoprecipitated lysate and blotting with anti-ATM antibody, ATM5BA).
Immunofluorescence analysis.
Cells were attached to slides by centrifugation at 250xg for 5 minutes, fixed with 4% formaldehyde in PBS for 30 minutes, and permeabilized with PBS containing 0.3% Triton X-100 for 5 minutes. After treatment with 0.1 mol/L glycine in PBS for 1 hour, preparations were incubated with ATM-4BA antibody raised in a rabbit (1:100) in PBS containing 2% FCS at 4°C overnight. After 3 washes with PBS containing 0.05% Tween-20 for 5 minutes, the preparations were incubated with fluorescein-linked F(ab′)2 fragment donkey antirabbit IgG (Jackson Immunoresearch, West Grove, PA) at 1:50 dilution in PBS containing 2% FCS for 3 hours. After 3 washes with PBS containing 0.05% Tween-20, the cover glass was mounted with 10 μg/mL 4′, 6′-diamidino-2-phenylindole (DAPI) (Sigma) in antifade solution. The cells were visualized by fluorescence microscopy (×250).
Enrichment for monocytes in resting PBMCs.
Heparinized blood (10 mL) was centrifuged on a Ficoll-Hypaque density gradient and the PBMCs were collected and washed twice with RPMI 1640 medium. The cell pellet was resuspended in 10 mL of medium (≈ 106 cells/mL), and cells were allowed to adhere to a plastic petri dish for 1 hour at 37°C in a metabolic incubator. Cells not adhering to the dish (mostly lymphocytes) were aspirated gently and the fluid phase was completely removed. The dish was then placed at 4°C for 30 minutes to detach the resting adherent cells (mostly monocytes) and then flushed with medium +10% FCS, prewarmed to 37°C.22
Fluorescence-activated cell sorting (FACS) labelling.
Mouse antihuman monoclonal antibodies (Becton Dickinson, Sydney, Australia) against CD16 fluorescein isothiocyanate (FITC) (Leu 11a, clone NKP15), CD33 PE (Leu M9, clone P67.6) and CD3 Per-CP (Leu 4/clone SK7) were used to phenotype human cell subsets (Becton Dickinson, Sourcebook). Cells were then permeabilized and fixed (Pharmigen Cytofix Kit, Cytoperm Plus, Becton Dickinson) and incubated either with preimmune (control) serum or the ATM-specific antibody, ATM-4BA. Cells were kept at 4°C during the entire procedure. Both control and ATM-4BA–treated cells were washed and then indirectly labelled with the donkey antirabbit Ig FITC (Silenus, Melbourne, Australia), washed again, and then subjected to FACS analysis.
RESULTS
Effect of PHA and serum on ATM protein level in PBMCs.
Exposure of PBMCs to mitogen leads to a dramatic increase in the number of proliferating cells. To determine whether ATM levels changed in response to a mitogenic signal, we performed immunoblotting with quiescent freshly isolated PBMCs and cells exposed to PHA or serum. When 30 μg of protein was loaded and Western blotting performed with ATM-3BA, an antibody specific for ATM, no protein was detected in extracts from 2 of 3 freshly isolated PBMC samples and only a low level was present in the third sample (Fig 1). However, after stimulation with PHA(P) for 3 days, there was a dramatic increase in ATM protein in all 3 samples (Fig 1). ATM protein also increased in the presence of serum(S), but this was considerably less marked than with PHA. Data using extracts from control (C3ABR) and A-T lymphoblastoid cells (L3) are included. L3 had no ATM protein as expected.23
Immunoblotting of ATM in extracts from lymphocytes of three individuals (1-3). F, extracts from freshly isolated lymphocytes; S, extracts from lymphocytes incubated in the presence of 10% FCS for 3 days; and P, extracts from PHA-stimulated lymphocytes (3 days). A total of 30 μg of protein extract was added to each lane of a 4.5% SDS-PAGE gel and immunoblotting performed with ATM-3BA. Protein loading was monitored by Ponceau S staining. Extracts were also included for an A-T lymphoblastoid cell line (L3) (25 μg) and 4, 10, and 25 μg loading for a control lymphoblastoid cell line (C3ABR).
Immunoblotting of ATM in extracts from lymphocytes of three individuals (1-3). F, extracts from freshly isolated lymphocytes; S, extracts from lymphocytes incubated in the presence of 10% FCS for 3 days; and P, extracts from PHA-stimulated lymphocytes (3 days). A total of 30 μg of protein extract was added to each lane of a 4.5% SDS-PAGE gel and immunoblotting performed with ATM-3BA. Protein loading was monitored by Ponceau S staining. Extracts were also included for an A-T lymphoblastoid cell line (L3) (25 μg) and 4, 10, and 25 μg loading for a control lymphoblastoid cell line (C3ABR).
Time course of induction of ATM.
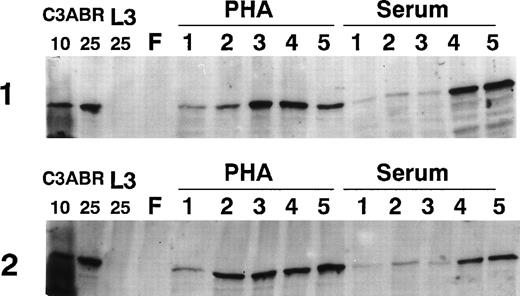
Because ATM increased markedly in PHA-stimulated PBMCs by 3 days, we examined the time course of induction by immunoblotting over 5 days. The results in Fig 2 provide data for 2 individuals. ATM protein was only detectable at low levels 1 day after PHA addition, but increased markedly over a period of 2 to 5 days. PBMC samples from other individuals showed that ATM levels were maximal at 3 to 4 days posttreatment (results not shown). When cells were exposed to serum, there was a delay in the appearance of ATM compared with PHA-treated cultures, but ATM increased by days 4 and 5 (Fig 2). This delay was also evident in other samples (results not shown). For comparison of the amount of ATM protein, we loaded 4, 10, and 25 μg of protein extract from EBV-transformed lymphoblastoid (proliferating) cells (C3ABR). The peak values obtained with PHA and serum are of the same order as the 25-μg loading for the lymphoblastoid cell extract (Figs 1 and 2).
Effect of incubation time on the amount of ATM in PBMCs. Lymphocytes were freshly prepared (F) and incubated for 1 to 5 days in the presence of serum or PHA. A total of 30 μg of extract was used for all lymphocyte samples and 10 and 25 μg of extract were used for C3ABR, a proliferating EBV-transformed cell line. Immunoblotting was performed using ATM-3BA antibody and protein loading was determined with Ponceau S staining.
Effect of incubation time on the amount of ATM in PBMCs. Lymphocytes were freshly prepared (F) and incubated for 1 to 5 days in the presence of serum or PHA. A total of 30 μg of extract was used for all lymphocyte samples and 10 and 25 μg of extract were used for C3ABR, a proliferating EBV-transformed cell line. Immunoblotting was performed using ATM-3BA antibody and protein loading was determined with Ponceau S staining.
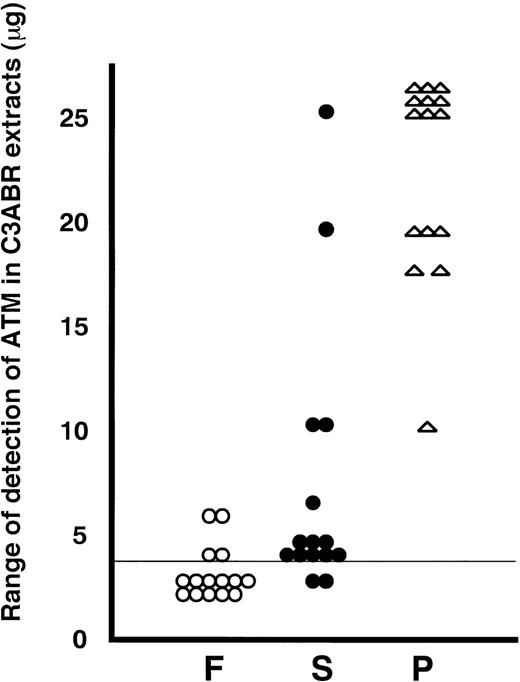
A summary of all of the data from 15 individuals is presented in Fig 3. To put the data into perspective, we have plotted the individual values on a scale derived from the detection of ATM in known amounts of protein from the proliferating lymphoblastoid cell line, C3ABR. Eleven of 15 extracts from freshly isolated PBMCs were below the limit of detection (4 μg of C3ABR protein) under the exposure conditions for ECL used when 30 μg of total protein was loaded. ATM in the other 4 PBMC samples was detected in the 4 to 6 μg range on this scale (Fig 3). Of 15 PHA-stimulated samples, 9 showed 25 μg or greater ATM equivalents and the other 6 had 10 to 20 μg equivalents at 3 days after addition of PHA (Fig 3). As was evident from earlier experiments, the increase in ATM after addition of serum only was less and more variable, ranging from below the limit of detection to 25-μg equivalents.
Summary of immunoblotting data for extracts from 15 different individuals. F, freshly isolated (○); S, serum-stimulated (•) and P, PHA-stimulated (★) for 3 days. ATM protein in lymphocytes was standardized to the amount of protein in C3ABR lymphoblastoid cells. A vertical line at 4 μg means the detection limit in this experiment.
Summary of immunoblotting data for extracts from 15 different individuals. F, freshly isolated (○); S, serum-stimulated (•) and P, PHA-stimulated (★) for 3 days. ATM protein in lymphocytes was standardized to the amount of protein in C3ABR lymphoblastoid cells. A vertical line at 4 μg means the detection limit in this experiment.
Effect on ATM kinase activity.
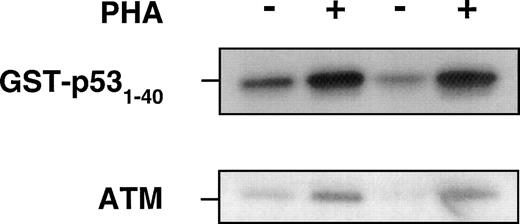
Previous data show that ATM interacts with p5324 and after exposure of cells to ionizing radiation, ATM phosphorylates p53 on serine 15 presumably to stabilize and activate p53.21,24 25In these investigations, ATM kinase activity increased 2-fold to 4-fold above the basal level of activity in response to radiation. Because we showed a significant increase in ATM protein in response to PHA, we determined whether this increase might be accompanied by an increase in ATM kinase activity. When extracts from untreated (serum only) and PHA-stimulated PBMCs were immunoprecipitated with anti-ATM antibody, followed by incubation with GST-p53 (1-40) and γ-32P ATP substrate, there was a substantial increase in ATM kinase activity, in keeping with the ATM protein response to PHA (Fig 4). This is reflected in the amount of ATM protein as determined by immunoblotting in the same experiment.
Use of ATM immunoprecipitates to determine the effect of PHA on protein kinase activity, using GST-p53 (1-40) as a substrate for ATM kinase. PHA-treated or untreated PBMCs were collected after 72 hours of incubation at 37°C before preparation of lysates. The same amount of total protein was immunoprecipitated with anti-ATM antibody (Ab-3, Oncogene Research). The beads were washed with lysis buffer twice, once with 0.1 mol/L Tris-HCI, pH 7.5 containing 0.5 mol/L LiCl, and finally twice with kinase buffer. Reactions were performed in 25 μL containing 1 μg of GST-p53 (amino acids 1-40), 5 μCi of ATP-γ32-P in kinase buffer for 30 minutes at 30°C and analyzed for incorporation on SDS-PAGE. − and + refer to without and with PHA in PBMCs from two individuals. Immunoblotting with ATM-5BA antibody was used to detect ATM in the immunoprecipitates.
Use of ATM immunoprecipitates to determine the effect of PHA on protein kinase activity, using GST-p53 (1-40) as a substrate for ATM kinase. PHA-treated or untreated PBMCs were collected after 72 hours of incubation at 37°C before preparation of lysates. The same amount of total protein was immunoprecipitated with anti-ATM antibody (Ab-3, Oncogene Research). The beads were washed with lysis buffer twice, once with 0.1 mol/L Tris-HCI, pH 7.5 containing 0.5 mol/L LiCl, and finally twice with kinase buffer. Reactions were performed in 25 μL containing 1 μg of GST-p53 (amino acids 1-40), 5 μCi of ATP-γ32-P in kinase buffer for 30 minutes at 30°C and analyzed for incorporation on SDS-PAGE. − and + refer to without and with PHA in PBMCs from two individuals. Immunoblotting with ATM-5BA antibody was used to detect ATM in the immunoprecipitates.
Distribution and expression of ATM in PBMCs.
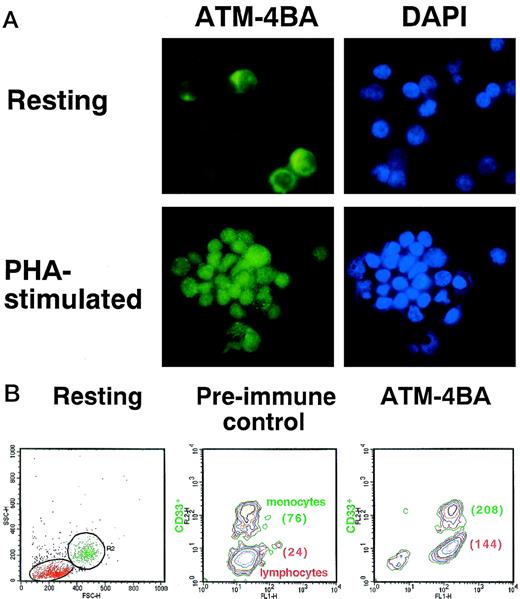
The lower levels of ATM protein in freshly isolated PBMCs could reflect lower levels in all cell types in the population or reduced numbers of cells expressing protein. Immunofluorescence analysis showed that the intensity of ATM staining in freshly prepared PBMCs was markedly less than that in PHA-stimulated cells (Fig 5A). Nuclear staining by DAPI is comparable in the 2 cell types. There was some indication that a subpopulation of unstimulated PBMCs had more intense labelling (Fig 5A). Because these cells were larger in size than lymphocytes and because their proportion was approximately the normal percentage of monocytes in PBMCs, we compared ATM by FACS analysis in an adherent population of cells enriched by monocytes, but also containing lymphocytes. Labelling resting cells with anti-CD33 antibody allowed us to compare the amount of ATM protein in monocytes with that in lymphocytes (Fig 5B). After labelling with ATM-4BA, the mean fluorescence intensity (MFI) of the lymphocytes (24) increased approximately 6-fold (144) and the monocytes (76) approximately 3-fold (208), but they expressed the same amount of ATM protein, as monocytes in preimmune sera have a higher autofluorescence than lymphocytes (76 compared with 24), indicating that there are similar levels of ATM protein in both cell types (Fig 5B). The higher intrinsic autofluorescence seen in monocytes by FACS analysis, when compared with lymphocytes, could explain the apparent difference observed between these cells when immunofluorescence was used (Fig 5A).
Determination of the amount of ATM in resting and PHA-stimulated PBMCs. (A) Immunofluorescence labelling of the 2 cell types with ATM-4BA antibody. DAPI was used to stain nuclei. (B) Plastic-adherent cells (resting) isolated from human PBMC were enriched for monocytes (R2, CD33+) and contained some T lymphocytes (R1, CD33-) as shown by FACS analysis. Cells were labelled either with ATM-4BA or with preimmune rabbit sera as a control. The MFI for each population is shown in brackets.
Determination of the amount of ATM in resting and PHA-stimulated PBMCs. (A) Immunofluorescence labelling of the 2 cell types with ATM-4BA antibody. DAPI was used to stain nuclei. (B) Plastic-adherent cells (resting) isolated from human PBMC were enriched for monocytes (R2, CD33+) and contained some T lymphocytes (R1, CD33-) as shown by FACS analysis. Cells were labelled either with ATM-4BA or with preimmune rabbit sera as a control. The MFI for each population is shown in brackets.
ATM mRNA expression and protein stabilization.
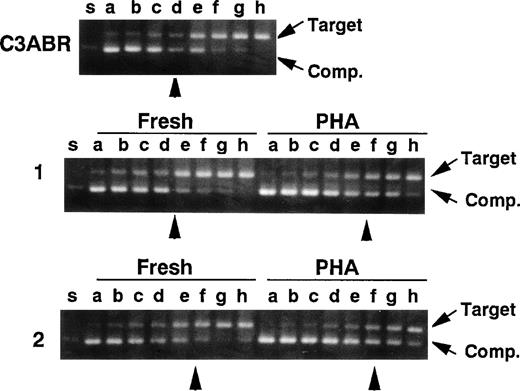
Because the amount of ATM protein was very low in quiescent PBMCs, we predicted that this might also be reflected in ATM mRNA levels. Accordingly, we used quantitative PCR to compare ATM mRNA in quiescent and PHA-stimulated lymphocytes as described previously.19 In the experiments, a cDNA fragment (402 bp) corresponding to an A-T mutant (5319G to A) lacking exon 38 was used as a competitor for normal ATM cDNA amplification (nucleotides 5122-5665, 544 bp) in a series of 2-fold dilutions. In 2 samples of unstimulated PBMCs, an equivalent point was reached at 10/24 and 10/32 attomoles/0.1 μg of RNA and the point was 10/48 and 10/64 for PHA-stimulated cells (Fig 6), demonstrating that mRNA levels in quiescent and PHA-stimulated cells were not appreciably different and could not account for the increased ATM protein in stimulated cells. ATM mRNA levels were of the same order (10/16 attomole/0.1 μg of RNA) in proliferating lymphoblastoid cells (C3ABR) (Fig 6).
Quantitative RT-PCR for the ATM transcript. A control EBV-transformed lymphoblast cell line (C3ABR) and 2 sets of freshly isolated PBMCs and PHA-stimulated PBMCs from healthy controls (1 and 2) were examined. Each template contained the same amounts of cDNA corresponding to 0.1 μg of total RNA and 1 of 2-fold dilutions of a competitor DNA from 1/2 × 10 to 1/256 × 10 attomole (lanes a through h). Equivalent points where target cDNA and competitor DNA were almost equivalent are indicated by arrow heads. The positions of target cDNA and competitor DNA (Comp.) are also indicated by arrows.
Quantitative RT-PCR for the ATM transcript. A control EBV-transformed lymphoblast cell line (C3ABR) and 2 sets of freshly isolated PBMCs and PHA-stimulated PBMCs from healthy controls (1 and 2) were examined. Each template contained the same amounts of cDNA corresponding to 0.1 μg of total RNA and 1 of 2-fold dilutions of a competitor DNA from 1/2 × 10 to 1/256 × 10 attomole (lanes a through h). Equivalent points where target cDNA and competitor DNA were almost equivalent are indicated by arrow heads. The positions of target cDNA and competitor DNA (Comp.) are also indicated by arrows.
Another explanation for the higher levels of ATM in PHA-treated cells could be increased stabilization of ATM protein. To investigate this, we used cycloheximide to inhibit de novo synthesis of ATM and thus measure the stability of existing protein. In proliferating lymphoblastoid cells (C3ABR), the t 1/2 for ATM was approximately 16 hours as determined by densitometric analysis of the data in Fig 7. The t1/2 value for PHA-stimulated PBMCs was between 16 and 32 hours. While it was more difficult to measure t1/2 for ATM in resting cells (140 μg loaded compared with 30 μg for PHA and C3ABR), it is evident that an initial low level of ATM persists over 32 hours suggesting that ATM turnover is not more rapid in these cells compared with PHA-stimulated cells. Thus, although there is a marked increase in ATM protein when PBMCs are stimulated to proliferate, the level of mRNA remains approximately the same in quiescent and dividing cells, and the t1/2 of the protein does not change.
Stability of ATM protein in PBMCs and lymphoblastoid cells. Cells were incubated in cycloheximide (25 μg/mL) for the times indicated before preparation of extracts for separation on SDS-PAGE and immunoblotting with ATM-3BA antibody. A total of 30 μg of protein was loaded for PHA-stimulated cells and for lymphoblastoid cells C3ABR, while 140 μg of protein was used for unstimulated PBMCs. Controls were included as in Fig 1. Exposure times differed among C3ABR, PHA-stimulated cells, and freshly isolated PBMCs.
Stability of ATM protein in PBMCs and lymphoblastoid cells. Cells were incubated in cycloheximide (25 μg/mL) for the times indicated before preparation of extracts for separation on SDS-PAGE and immunoblotting with ATM-3BA antibody. A total of 30 μg of protein was loaded for PHA-stimulated cells and for lymphoblastoid cells C3ABR, while 140 μg of protein was used for unstimulated PBMCs. Controls were included as in Fig 1. Exposure times differed among C3ABR, PHA-stimulated cells, and freshly isolated PBMCs.
Comparison of p53/p21-WAF1 response in stimulated and unstimulated PBMCs.
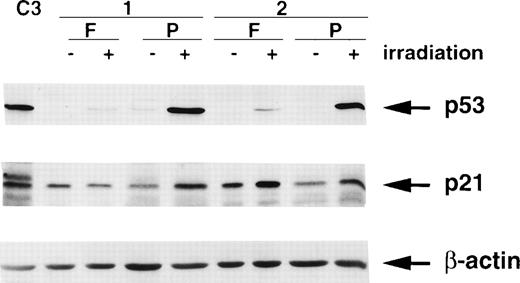
It is well-established that the ionizing radiation signalling pathway operating through p53 and p21/WAF1 is defective in A-T cells.21,26-29 Furthermore, reducing the level of ATM with antisense cDNA constructs in control cells abrogates this response.30 Because ATM is approximately 6-fold to 10-fold lower in freshly isolated PBMCs, it would be expected that the p53 and p21/WAF1 responses to radiation would be reduced in these cells. The results in Fig 8 show that this is the case for p53. In response to radiation exposure, the extent of stabilization of p53 was considerably greater in extracts from PHA-stimulated cells than in those from unstimulated cells. There was a high basal level of p21 in both samples of unstimulated PBMCs (Fig 8), which is in agreement with levels in other quiescent or differentiated cells.31 32 Radiation exposure failed to increase further the level of p21 in 1 patient’s (1) cells, which is in agreement with the very weak p53 response. There was a small increase in a second patient (2), which was somewhat exaggerated by protein loading. Stimulation with PHA increased the p21 response to radiation exposure in both patients lymphocytes (Fig 8).
Effect of ionizing radiation (6 Gy) on p53 and p21/WAF1 levels in freshly isolated (F) and PHA-stimulated (P) lymphocytes from 2 individuals. Cells were irradiated followed by incubation at 37°C in 5% CO2 for 2 hours before preparation of extracts. C3 represents extracts from unirradiated C3ABR cells. A total of 20 μg of protein was loaded in each lane of a 12% SDS-PAGE gel. β-actin was used as a loading control.
Effect of ionizing radiation (6 Gy) on p53 and p21/WAF1 levels in freshly isolated (F) and PHA-stimulated (P) lymphocytes from 2 individuals. Cells were irradiated followed by incubation at 37°C in 5% CO2 for 2 hours before preparation of extracts. C3 represents extracts from unirradiated C3ABR cells. A total of 20 μg of protein was loaded in each lane of a 12% SDS-PAGE gel. β-actin was used as a loading control.
DISCUSSION
The product of the ATM gene plays a pivotal role in sensing damage in DNA and as a consequence in modulating cell cycle checkpoints.33 The predominant presence of ATM in the nucleus in proliferating cells supports this role.24,34-37However, it is also clear that ATM is present outside the nucleus and is associated with vesicular structures.36 These vesicles have now been identified as clathrin-coated endosomes38 and peroxisomes (Watters et al, unpublished). Furthermore, there is some evidence that distribution of ATM is influenced by the differentiation state of the cell.39 40
Neither the subcellular distribution of ATM nor the total amount of cellular ATM protein is influenced by exposure to ionizing radiation or radiomimetic compounds, agents to which ATM responds.24,34,37 In addition, ATM protein levels are relatively constant throughout the cell cycle in human fibroblasts.34 The novel aspect of the present study is the demonstration that the amount of ATM changes dramatically in quiescent lymphocytes in response to a mitogenic signal. In nondividing PBMCs, only a small amount of ATM protein was present compared with that in PHA-stimulated cells as determined by immunoblotting, FACS analysis, and immunofluorescence. The increased levels of ATM protein in proliferating lymphocytes were not due to a more stable ATM protein or to an increase in ATM mRNA in response to PHA. Failure to observe parallel changes at the level of mRNA suggests that regulation is at the posttranscriptional/translational rather than transcriptional level. Indeed, extensive structural diversity at the 5′ and 3′ untranslated regions of ATM mRNA might lead to synthesis of specific transcripts, which could account for control at this level,41 ensuring a prompt response to physiological stimuli such as response to antigen or mitogen in the present context. The results obtained here suggest that ATM is upregulated in proliferating lymphocytes and plays a more general role than signalling DNA damage. Evidence for a broader role for ATM in intracellular signalling is derived from observations that show a greater demand for growth factors in A-T fibroblast survival42,43 and the poor growth capacity of embryonic fibroblasts from Atm −/− mice.44Defective signalling through the T-cell and B-cell receptors, as evidenced by a reduced or absent mobilization of Ca2+ and defective activation of phosphatidylinositol 3 (PI3)-kinase and phospholipase Cγ1 (PLCγ1) in A-T lymphoid cells, has also been reported,29,45 as well as a defect in the transmission of mitogen-mediated signalling due to a failure of exocytosis in PHA-stimulated lymphocytes.46 Thus, upregulation of ATM in lymphocytes induced to proliferate, and a likely requirement for ATM in these cells, could account for the failure of A-T cells to initiate an appropriate response to specific stimuli during ontogeny of B and T cells. Indeed, there is evidence for a defective PHA response in some A-T patients.1,47 More recently, accelerated cell death has been observed in PBMCs from an A-T patient and large amounts of serum or added cytokines only partially protected these cells against cell death.48 These results agree with the likely explanation for the immunodeficiency in A-T, ie, developmental defects in both T and B cells.49
The immunofluorescence data suggest that ATM is predominantly present in the nucleus in the PHA-stimulated cells and also in quiescent cells by the pattern of immunofluorescence staining in a cell type where the nucleus occupies most of the intracellular space. This is supported by immunoblotting with freshly isolated lymphocytes where ATM was largely present in the nucleus, but there was some evidence of microsomal labelling.34 The detection of ATM in freshly isolated PBMCs in that study does not conflict with our results. They used 2 × 10⁸ PBMCs to fractionate for analysis of nuclear and microsomal ATM and used 10% of the resultant nuclear fraction for immunoblotting, at which levels a signal would be evident by immunoblotting. Taken together, these results show that ATM is still primarily a nuclear protein in quiescent PBMCs. There is also evidence that a related member of the PI3-kinase family DNA-dependent protein kinase, catalytic subunit (DNA-PKcs) is present at very low levels in nuclei from resting PBMCs.50 On stimulation of PBMCs with PHA, the activity of DNA-PK increased markedly by 48 hours. However, unlike the ATM protein, which increases in cells in amount and activity after PHA stimulation, the changes in DNA-PK were due to subcellular translocation. In resting lymphocytes, full DNA-PK activity, compared with that in stimulated cells, was detected in whole cell extracts as opposed to that in nuclear extracts. Immunoblotting also showed comparable amounts of DNA-PKcs protein in whole cell extracts from resting and stimulated PBMCs. Thus, in proliferating lymphocytes, the amount and activity of ATM increases, whereas the activity increase for DNA-PK is due to translocation to the nucleus.50
The reduced extent of the p53 response in quiescent cells compared with PHA-stimulated cells postirradiation is compatible with reduced or absent ATM. As observed elsewhere, we could not detect p53 in unstimulated PBMCs, but after exposure to PHA, there was an increase in p53, which correlates with cellular DNA replication.51Several reports have demonstrated a deficient p53 response in A-T cells after exposure to ionizing radiation.27,28,52Coimmunoprecipitation data show that ATM and p53 interact directly,24 and it has been demonstrated recently that p53 is a substrate for ATM in this pathway.21,25,26 Stimulation of PBMCs with PHA led to an increase in basal levels of p53 and a more marked response to radiation exposure, reflecting the increase in ATM in these cells. As is already established, ATM plays a key role in cell survival postirradiation, suggesting that its absence or lower level in quiescent lymphocytes might contribute to the increased radiosensitivity of these cells compared with proliferating lymphocytes.53,54 In addition, there is evidence that DNA repair capacity increases in PHA-stimulated lymphocytes.47 55-57 These data may provide additional insight into the reported differences in radiosensitivity between resting and stimulated lymphocytes.
We have demonstrated here that ATM increases markedly as PBMCs enter a proliferative stage. Thus, it might be expected that ATM will increase in lymphoid cells as they respond to antigenic or other proliferative signals during ontogeny. Equally important, in the absence of ATM, failure to integrate and transmit these signalling events could result in T-cell and B-cell developmental abnormalities characteristic of A-T patients. Furthermore, lymphoid cells induced to proliferate in A-T patients would retain the reduced capacity for DNA repair observed in quiescent cells,47 share the radiosensitivity of quiescent cells, and thus might be expected to be more vulnerable to cellular damage leading to genome instability and cancer predisposition.
Supported in part by a Grant in Aid for Science Research, Ministry of Education, Science, Sports and Culture of Japan, the Ministry of Health and Welfare’s Primary Immunodeficiency Research Grant for Specific Diseases, Japan, a Grant from “Science Promotion Foundation of Gifu University School of Medicine”, the Australian National Health and Medical Research Council, and the A-T Children’s Foundation, Boca Raton, FL.
The publication costs of this article were defrayed in part by page charge payment. This article must therefore be hereby marked “advertisement” in accordance with 18 U.S.C. section 1734 solely to indicate this fact.
REFERENCES
Author notes
Address reprint requests to Toshiyuki Fukao, MD, PhD, Department of Pediatrics, Gifu University School of Medicine, 40 Tsukasa-machi, Gifu, Gifu 500-8076, Japan; email: toshi-gif@umin.u-tokyo.ac.jp.



This feature is available to Subscribers Only
Sign In or Create an Account Close Modal