Serum samples drawn at diagnosis from 174 myeloma patients were analyzed for the presence of the heparin sulfate proteoglycan, syndecan-1. Syndecan-1 was elevated in 79% of patients (median, 643 units/mL) compared with 40 healthy controls (median, 128 units/mL),P < .0001. Serum syndecan-1 correlated with the following: serum creatinine, secretion of urine M-component over the course of 24 hours, soluble interleukin-6 (IL-6) receptor, C-terminal telopeptide of type I collagen, β2-microglobulin, percentage of plasma cells in the bone marrow, disease stage, and serum M-component concentration. In order to evaluate syndecan-1 as a prognostic marker in multiple myeloma, it was entered into a multivariate Cox regression model. Data from 138 patients were available for this analysis. As a continuous variable, syndecan-1 was an independent prognostic parameter in addition to serum β2-microglobulin and World Health Organization performance status. When syndecan-1 was dichotomized by the best cutoff (66th percentile, 1170 units/mL), the survival difference between the groups was highly significant: “high” syndecan-1 group had a median survival of 20 months, and the “low” syndecan-1 group had a median of 44 months (P < .0001). We conclude that syndecan-1 is a new independent prognostic parameter in multiple myeloma, and its role in prognostic classification systems should be further investigated.
Multiple myeloma is a B-cell malignancy characterized by the accumulation of clonal malignant plasma cells. It is associated with the production of monoclonal immunoglobulins, bone destruction, anemia, hypercalcemia, and renal dysfunction.
Syndecan is a member of a family of integral membrane heparin sulfate proteoglycans.1 It is known to participate in cell-matrix adhesion processes by binding cells to collagens,2-4fibronectin,5 and thrombospondin.6 Syndecan can also serve as a low-affinity receptor for heparin-binding growth factors.7
Within the bone marrow, syndecan-1 is detected solely on cells of the B lymphocyte lineage, and its expression changes at specific stages of differentiation. In mice it is present on the surface of pre-B cells, lost in mature B cells, and re-expressed in plasma cells.8In the bone marrow of myeloma patients, syndecan-1 is reported to be expressed on myeloma cells only9; it is also expressed on malignant plasma cells in peripheral blood.10Syndecan-1 is rapidly lost by apoptotic myeloma cells.11Since syndecan-1 is expressed on the surface of viable malignant plasma cells, specific antibodies to syndecan-1 are used for identification and purification of myeloma cells from clinical samples.9 12
Previous studies have shown that syndecan-1 is shed from the surface of myeloma cells in culture13 and into human serum.14 Measured by a semiquantitative method, syndecan-1 levels in serum of 7/20 myeloma patients were elevated compared with normal controls. High levels were associated with a high percent of bone marrow plasmocytosis and β2-microglobulin levels.14
In this study, we analyzed serum levels of shed syndecan-1 in a large well-characterized population of myeloma patients in order to determine its relation to prognosis and other variables at the time of diagnosis.
Patients and methods
Study population
A total of 592 patients were entered in the Nordic Myeloma Study Group (NMSG) randomized trial from June 1990 until November 1992. In this study, patients were randomized to receive melphalan and prednisone with or without the addition of low-dose α-interferon. The diagnostic and eligibility criteria and results were previously described by NMSG.15 The following parameters were registered for all patients at the time of diagnosis: age; sex; Durie-Salmon16 stage; the World Health Organization (WHO) performance status15; a grading of bone morbidity in 3 stages, as judged by X-ray abnormality (no changes, limited changes, advanced changes); percentage of plasma cells in the bone marrow; immunoglobulin (Ig) class; serum M-component protein concentration; albumin; calcium; creatinine; total alkaline phosphatase; β2-microglobulin; and secretion of urine M-component over the course of 24 hours.
After completion of the study, approximately 400 sera drawn at diagnosis were analyzed for interleukin-6 (IL-6), IL-6 receptor, C-reactive protein (CRP), osteocalcin, C-terminal telopeptide of type I collagen (ICTP), and hepatocyte growth factor (HGF). A manuscript on prognostic factors in the original larger patient material has been published separately30. The present study was performed after the closing of this study, and therefore data on syndecan-1 will only be reported in this paper.
At the time of the present study, remaining serum samples from the time of diagnosis of 174 patients were available for analysis of syndecan-1 levels. These patients constitute the study population. Their mean age was 66.1 ± 8.8 years (mean ± SD, range 35-82). There were 102 males and 72 females. The distribution of myeloma characteristics with respect to monoclonal component (M-protein) type was: IgG, 64%; IgA, 15%; IgD in 2 patients, 1.1%; and light chain disease, 20%. According to the staging of Durie and Salmon,16 10% of patients were in stage I, 41% in stage II, and 49% in stage III disease. In regard to any of the studied parameters, no significant differences between the present study population and the original patient material were found. The survival of the 174 patients did not differ significantly from the total study population. The median follow-up period of surviving patients was 38 months.
Criteria for having achieved response included clear clinical improvement, reduction in urinary or serum M-component, absence of hypercalcemia, absence of anemia, stable serum creatinine, and no progression of osteolytic lesions.17 Control samples were obtained from 40 healthy age-matched and sex-matched individuals.
Syndecan-1 enzyme-linked immunosorbent assay
Human syndecan-1 enzyme-linked immunosorbent assay (ELISA) (Diaclone Research, Besançon, France) was performed according to the manufacturer's instructions. Briefly, 100 μL of samples and standards and 50 μL of diluted biotinylated antibody were added into precoated wells and incubated for 1 hour at room temperature. After 3 washes, 100 μL horseradish-peroxidase-streptavidin conjugate was added, and the plate was incubated for 30 minutes at room temperature. After washing, 100 μL of substrate was added, and the color was allowed to develop for 10-15 minutes. The reaction was stopped with H2SO4, and the absorbance was read at 450 nm. The entire procedure was performed in approximately 2 hours. All samples were analyzed in duplicate. The standard curve was linear, from 30 to 1000 units/mL, and serum samples above this range were diluted. The interassay and intra-assay coefficient of variation was < 14%.
Statistical analyses
All statistical analyses were done with the SPSSX/PC computer program (SPSS, Chicago, IL). Results were considered statistically significant when P < 0.05. Skewed variables (Kurtosis > 8) were transformed by the natural logarithm (ln) before entering the multiple linear regression analysis and the Cox regression model. Comparisons between groups were performed with the Student ttest and the Mann-Whitney U test. Correlation between 2 parameters was estimated by the Spearman rank correlation analysis. For investigation of linear correlations, multiple regression analysis was applied. Response to treatment was analyzed using multiple logistic regression techniques. The method of Kaplan and Meier was used to compute the survival curves and to estimate the median survival18 and the log-rank test for significance. Survival was modeled with the Cox regression analysis.19 In all multivariate models, variables were entered by forward selection, where entry required a maximum adjusted value of P = .05.
The NMSG study found no significant survival difference between the 2 arms of treatment.15 Thus it was possible to pool data from the treatment arms to evaluate the prognostic significance for the studied parameter.
Results
Serum analyses
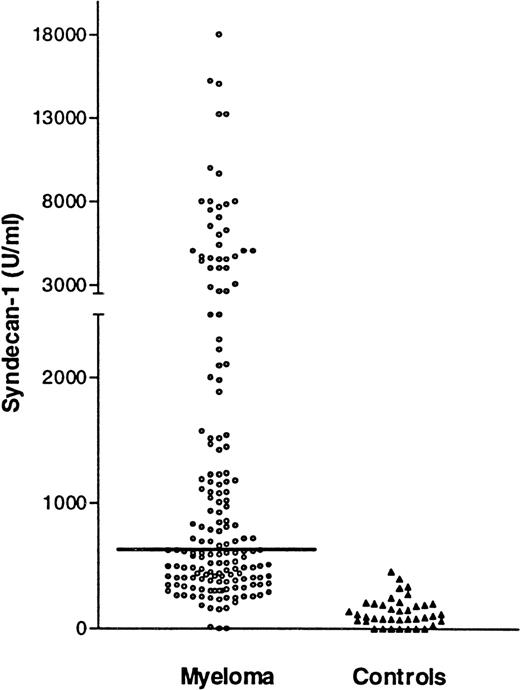
The serum syndecan-1 values in patients at the time of diagnosis and in controls are shown in Figure 1. The distribution of syndecan-1 concentrations was skewed (kurtosis = 15). The median syndecan-1 concentration (25th to 75th percentile) was 643 units/mL (401-2022) in the myeloma and 128 units/mL (76-208) in the control sera. This difference was statistically significant (P < .0001). The maximal syndecan-1 level measured in a patient was 20 000 units/mL, ie, over 100 times higher than the median level of normal controls. In 137 patients (79%), the syndecan-1 levels were above the mean level +2SD of syndecan-1 in the control group (> 370 units/mL), which is considered above the normal range by conventional criteria.
Syndecan-1 in serum by ELISA.
Serum syndecan-1 levels at diagnosis in 174 patients with multiple myeloma. Horizontal line denotes median value of 643 units/mL and 40 healthy age- and sex-matched controls (median,128 units/mL). The difference between the groups is highly significant (P < .0001).
Syndecan-1 in serum by ELISA.
Serum syndecan-1 levels at diagnosis in 174 patients with multiple myeloma. Horizontal line denotes median value of 643 units/mL and 40 healthy age- and sex-matched controls (median,128 units/mL). The difference between the groups is highly significant (P < .0001).
Correlation to other parameters
A significant correlation coefficient (r) was obtained with respect to serum creatinine, secretion of urinary M-component over 24 hours, IL-6 receptor, ICTP, β2-microglobulin, percentage of plasma cells in the bone marrow, disease stage, and serum M-component concentration (Table 1). By forward selection of these variables, a multiple linear regression yielded creatinine and the percentage of plasma cells in the marrow as the best predictors of syndecan-1 (with an adjusted r2 of 0.18). There was no significant correlation between syndecan-1 and pretreatment age, type of serum M-component, radiographic staging of bone destruction, IL-6, CRP, calcium, HGF, albumin, alkaline phosphatase, or osteocalcin (data not shown).
Correlations between serum syndecan-1 and other variables at diagnosis
| . | Serum Creatinine . | Urine M-Component . | IL-6 Receptor . | ICTP . | β2-Microglobulin . | % Marrow Plasma Cells . | Stage . | Serum M-Component . |
|---|---|---|---|---|---|---|---|---|
| N | 174 | 164 | 173 | 157 | 174 | 173 | 174 | 173 |
| r* | 0.41 | 0.29 | 0.28 | 0.25 | 0.25 | 0.21 | 0.20 | 0.17 |
| P value | <.0001 | <.0001 | <.0001 | .002 | .001 | .005 | .008 | .02 |
Only statistically significant correlations are included. There was no significant correlation between syndecan-1 and pretreatment age, type of serum M-component, radiographic staging of bone destruction, IL-6, CRP, calcium, HGF, alkaline phosphatase, albumin, or osteocalcin.
r indicates correlation coefficient for syndecan-1 and the designated variable.
Relation to treatment response
When syndecan-1 was evaluated in a univariate logistic regression model, it was a significant predictor of response to treatment (P = .01). However, in a multivariate model, it did not retain significance.
Survival analyses
When syndecan-1 (transformed by the natural logarithm) was entered in a univariate Cox regression analysis, it was a significant predictor of mortality (P = .0006). Syndecan-1 was therefore entered into a multivariate Cox regression analysis involving the other factors in this patient material that held significant (P < .05) prognostic information in a univariate Cox regression analysis: serum calcium; soluble IL-6 receptor; β2-microglobulin; WHO performance status (0-2 versus 3-4); and ln [IL-6], ln [CRP], ln [creatinine], and ln [ICTP] (data not shown). Patients with missing variables were excluded from the analysis. Complete data from 138 patients were available.
Table 2 demonstrates the result of the multivariate Cox regression. Only 3 factors retained prognostic significance: ln [syndecan-1] (P = .002); β2-microglobulin (P = .004); and WHO performance, 0-1 versus 2-3 (P = .01). Thus, when syndecan-1 was included in the model, corrected serum calcium, IL-6, soluble IL-6 receptor, CRP, creatinine, and ICTP added no further prognostic information. Without syndecan-1, the final model included β2-microglobulin, corrected serum calcium, and WHO performance status. The difference between the models with and without syndecan-1 was 4,2 χ2(P < .05).
Variables with independent prognostic importance for survival according to a multivariate Cox regression analysis, with and without syndecan-1 in the model
| Variable . | βCoefficient . | SE . | Significance (P-value) . | χ2 of the Model . |
|---|---|---|---|---|
| Model With Syndecan-1 | ||||
| ln (Syndecan-1) | 0.30 | 0.10 | .002 | |
| β2-Microglobulin | 0.05 | 0.02 | .004 | 40.2 |
| WHO status (0-2 vs 3-4) | 0.66 | 0.26 | .01 | |
| Model Without Syndecan-1 | ||||
| β2-Microglobulin | 0.06 | 0.02 | .0005 | |
| WHO status (0-2 vs 3-4) | 0.61 | 0.26 | .02 | 36.0 |
| s-Calcium | 0.62 | 0.26 | .01 |
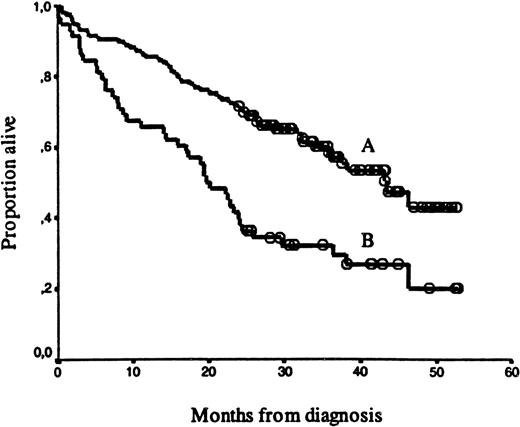
Syndecan-1 was further evaluated as a dichotomous variable with respect to survival. An evaluation of survival, using different cutoff levels, is summarized in Table 3. The best separation of the curves was with the cutoff point at the 66th percentile of the syndecan-1 values (≥ 1170 units/mL). There was a highly significant survival difference (P = .0001) between the “high” syndecan-1 group (≥ 1170 units/mL, n = 58) and “low” syndecan-1 group (< 1170 units/mL, n = 116). Median survival was 20 and 43 months, respectively, as shown in Figure2. The follow-up period of surviving patients did not differ significantly between the high and low syndecan-1 groups.
Survival and pretreatment values with different cutoff values
| Syndecan-1 Cutoff Value . | 33rd Percentile . | Median . | 66th Percentile . |
|---|---|---|---|
| Median survival above cutoff (months) | 28 | 24 | 20 |
| Median survival below cutoff (months) | 38.3 | 43 | 43 |
| χ2 value, P value | 1.45,P = .23 | 5.98, P = .01 | 16,P = .0001 |
| Syndecan-1 Cutoff Value . | 33rd Percentile . | Median . | 66th Percentile . |
|---|---|---|---|
| Median survival above cutoff (months) | 28 | 24 | 20 |
| Median survival below cutoff (months) | 38.3 | 43 | 43 |
| χ2 value, P value | 1.45,P = .23 | 5.98, P = .01 | 16,P = .0001 |
n = 174.
Kaplan-Meier survival curves for 174 myeloma patients.
The curves are separated by: (A) “high” syndecan-1 levels (≥ 1170 units/mL, n = 58, median survival 20 months) versus (B) “low” syndecan-1 levels (< 1170 units/mL, n = 116, median survival 43 months). Open circles represent censored patients. The survival difference was highly significant (P = .0001).
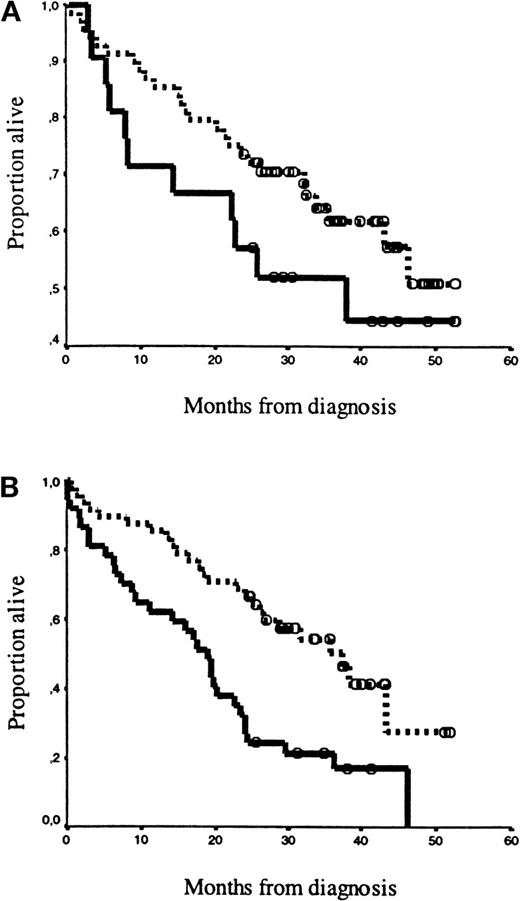
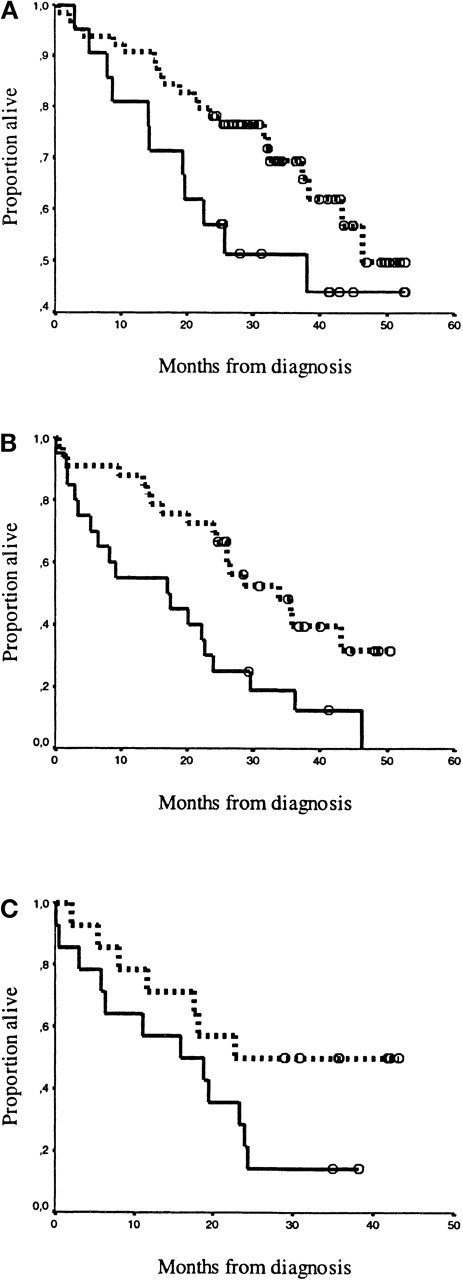
Syndecan-1 high/low grouping (> / < 1170 units/mL) was applied to stratify 2 established classification systems: Durie-Salmon stage16 (Figure 3) and CRP and β2-microglobulin20 (Figure4). There was no survival difference between patients in Durie-Salmon stage I and II, thus these data were pooled. Syndecan-1 separated patients by both classsification systems, in all risk categories. The separation was highly significant in the medium-risk and high-risk patient groups.
Kaplan-Meier survival curves for patients classified by the staging system of Durie and Salmon.
The solid line represents high syndecan-1 levels (≥ 1170 units/mL), and the dotted line represents low syndecan-1 levels (< 1170 units/mL). Open circles represent censored patients. (A) Patients in Durie-Salmon16 stages I and II were separated by high syndecan-1 levels (n = 21) and low syndecan levels (n = 68),P = .20). (B) Patients in Durie-Salmon stage III were separated by high syndecan-1 levels (n = 37) and low syndecan-1 levels (n = 48), P = .0006.
Kaplan-Meier survival curves for patients classified by the staging system of Bataille et al.20The drawn line represents high syndecan-1 levels (≥ 1170 units/mL), and the dotted line represents low syndecan-1 levels (< 1170 units/mL). Open circles (ο) represent censored patients. Panels A, B, and C depict the high and low levels of syndecan-1 for patients classified by Bataille: (A) Stadium 1: CRP < 6 mg/L and β2-microglobulin < 6 mg/L; high levels (n = 64) were separated from low levels (n = 21), P = 0.10. (B) Stadium 2: CRP ≥ 6 mg/L or β2-microglobulin ≥ 6 mg/L; high levels (n = 33) were separated from low levels (n = 20),P = 0.003. (C) Stadium 3: CRP ≥ 6 mg/L and β2-microglobulin ≥ 6 mg/L; high levels (n = 14) were separated from low levels (n = 14), P = 0.05.
Kaplan-Meier survival curves for patients classified by the staging system of Bataille et al.20The drawn line represents high syndecan-1 levels (≥ 1170 units/mL), and the dotted line represents low syndecan-1 levels (< 1170 units/mL). Open circles (ο) represent censored patients. Panels A, B, and C depict the high and low levels of syndecan-1 for patients classified by Bataille: (A) Stadium 1: CRP < 6 mg/L and β2-microglobulin < 6 mg/L; high levels (n = 64) were separated from low levels (n = 21), P = 0.10. (B) Stadium 2: CRP ≥ 6 mg/L or β2-microglobulin ≥ 6 mg/L; high levels (n = 33) were separated from low levels (n = 20),P = 0.003. (C) Stadium 3: CRP ≥ 6 mg/L and β2-microglobulin ≥ 6 mg/L; high levels (n = 14) were separated from low levels (n = 14), P = 0.05.
Discussion
The main finding is that in a well-defined population of untreated myeloma patients, the serum syndecan-1 level is a new and powerful prognostic marker. A good prognostic system in multiple myeloma should ideally form the basis for selecting the best treatment, and it should include only variables with independent prognostic information. In order to be useful in clinical practice, these should be available at diagnosis and be measured with simple reproducible techniques. A number of prognostic factors reflecting various aspects of the disease have been identified in myeloma,21 relating to either the intrinsic malignancy of the tumor, host-tumor interactions, renal function, or tumor mass.22 Of these, serum β2--microglobulin concentration is regarded as one of the most powerful prognostic factors.22-24 In our study, we show that syndecan-1 provides substantial prognostic value in a Cox regression model with proven prognostic markers, including β2 -microglobulin.
An important question is whether syndecan-1 can identify patients at high risk who have a favorable prognosis by other classification systems. Our results, as illustrated in Figures 3 and 4, suggest that this is indeed the case, especially in the medium-risk and high-risk patient groups. Notably, for medium-risk patients, as classified by the Bataille20 system, with a concomitant high syndecan-1 level, the median survival time was 17 months. This was shorter than the 19-month median survival of the Bataille high-risk group as a whole. However, our cutoff point for syndecan-1 was derived from the present set of data. Thus, additional studies must be performed to determine if these results are reproducible in other populations of myeloma patients, with respect to age and treatment regimes.
The NMSG study was a multicenter trial, with limitations in the variables available for evaluation of prognosis. Thus our analysis could not include data on some known powerful prognostic factors25-27 in these patients: plasma cell labeling index, the percentage of circulating plasma cells, or karyotype abnormalities. Further studies should be designed to determine if syndecan-1 retains independent prognostic information when these parameters are available.
Syndecan-1 correlated significantly with a number of variables in our study (Table 1). These results are in accordance with previous suggestions14 that soluble syndecan-1 reflects tumor mass (as assayed by the percentage of plasma cells in the marrow, urine and serum M-component levels,28 and soluble IL-6 receptor29). Also, it may reflect renal failure as determined by increased levels of serum creatinine. However, the multiple linear regression model suggests that approximately 20% of the variability in syndecan-1 levels can be attributed to variations in the percentage of plasma cells in the marrow and serum creatinine. The fact that syndecan-1 contains prognostic information which is superior to these variables could indicate that syndecan-1 not only reflects tumor load and renal failure but also other biological aspects of the disease.
Syndecan-1 has been found to increase osteoblast development and inhibit osteoclast formation in murine bone marrow cell cultures, suggesting that syndecan-1 may counteract bone destruction.13 However, syndecan-1 expression does not differ among patients with or without lytic bone lesions.10Our study does not support a clear connection between syndecan-1 and the degree of bone affection (as determined by serum calcium levels, alkaline phosphatase, and osteocalcin). In fact, we found a significant positive association between syndecan-1 and serum ICTP, which is a marker of collagen degradation.
In culture, shed syndecan-1 has been shown to induce apoptosis of myeloma cell lines through an unknown mechanism.13Also, the development of myeloma cell tumors is retarded in severe-combined-immunodeficiency mice injected with syndecan-1 positive as compared with syndecan-1 negative ARH-77 cells.13 These results suggest a beneficial effect of syndecan-1 to the patient. Our study does not attempt to address the biology of shed syndecan-1 in multiple myeloma. However, it clearly shows that a high level of shed syndecan-1 in serum is associated with an unfavorable prognosis for the patient.
We conclude that serum syndecan-1 is a new independent prognostic parameter in multiple myeloma. Through a rapid and simple ELISA procedure, it seems to provide additional prognostic information in some commonly used classification systems. We suggest that syndecan-1 levels should be further explored in the prognostic classification of myeloma to determine its clinical usefulness.
Acknowledgments
We are grateful to Berit Størdahl and Marie Rygh for excellent technical assistance and to Professor Lars Vatten for his comments on the statistical calculations. We are also grateful to members of the Nordic Myeloma Study Group directory board: I. M. S. Dahl, P. Gimsing, E. Hippe, M. Hjorth, E. Holmberg, E. Löfvenberg, S. Magnusson, J. L. Nielsen, I. Palva, S. Rödjer, I. Talstad, I. Turesson, J. Westin, and F. Wisløff.
Supported by grants from the Norwegian Cancer Society; Rakel and Otto Kr. Bruuns legat; and The Cancer Fund (Trondheim, Norway).
Reprints:Carina Seidel, Norwegian Cancer Society, Institute of Cancer Research and Molecular Biology, Norwegian University of Science and Technology, Medisinsk Teknisk Senter, N-7489 Trondheim, Norway.
The publication costs of this article were defrayed in part by page charge payment. Therefore, and solely to indicate this fact, this article is hereby marked “advertisement” in accordance with 18 U.S.C. section 1734.


