Expression of CD13/N-aminopeptidase may reflect cell activation and growth. We examined its role regarding cell growth in cultures of cord blood CD34+ cells with stem cell factor/Flt-3 ligand/granulocyte-macrophage colony-stimulating factor/tumor necrosis factor-. Indeed, 82% ± 6% of cells from culture day 5 were CD13hi, 25% ± 8% of which were still Lin−. About 50% of CD13hiLin− cells, which comprise progenitors of dendritic cells (DC), monocytes/macrophages and granulocytes, and 30% of CD13loLin− cells were CD34+. Sorted CD34+CD13hiLin− cells, cultured further for 7 days with the same cytokines, expanded 31-fold and CD34-CD13hiLin− cells 7-fold, but CD34+CD13loLin− and CD34−CD13loLin− cells did not grow. Thus, cell growth correlated with CD13 expression, all the more so that cells were CD34+. Actinonin, the most potent N-aminopeptidase inhibitor, was used to engage CD13 on sorted CD13hiLin− cells and on culture day-7 bulk cells. In both cases, this resulted in reversible cell growth arrest, with 30% to 60% fewer cells in the G2/S-M phase than in controls. Interestingly, similar effects were noted with CD13 monoclonal antibody TÜK1, which does not inhibit N-aminopeptidase activity, but not with N-aminopeptidase-blocking antibodies WM15 and F23. All cycling cells appeared susceptible to actinonin, which induced cell apoptosis at the same time as Bcl-2 was downregulated and caspase-3 activity increased, but finally percentages and yields of DC and macrophage precursors were affected more than those of granulocytic cells. Thus, through engagement of N-aminopeptidase enzymatic site but possibly also of an independent determinant, CD13 plays a role in the growth of DC/macrophage progenitors and precursors.
Cord blood CD34+ hematopoietic progenitor cells (HPC) cultured with granulocyte/macrophage colony-stimulating factor (GM-CSF), stem cell factor (SCF), Flt-3 ligand (FL), and tumor necrosis factor (TNF)-α differentiate into dendritic cells (DC) and monocytes/macrophages, and also into granulocytes.1-6 The intermediate stages between the CD34+ HPC and DC are not yet fully characterized, though it has been shown that DC obtained in these cultures are heterogeneous and derive either from CD1a+CD14− unipotent DC/Langerhans cell (LC) precursors or from bipotent CD1a−CD14+ macrophage/DC precursors some of which pass through a CD1a+CD14+stage.4,6,7-10 We have identified a population of CD13hiLin− cells that appears during the first days of culture of initially CD34+CD13lo HPC and comprises either distinct or common progenitors of macrophages and DC inasmuch as both cell types differentiate from this population.4 11
CD13, a membrane-bound cell surface glycoprotein, was originally recognized as a marker for subsets of normal and malignant myeloid cells, but later found on different other cells.12 It is identical to aminopeptidase N (APN; EC 3.4.11.2),13 a Zn-dependent metalloprotease, which cleaves N-terminal neutral amino acids from proteins. This ectoenzyme can cleave bioactive proteins on the cell surface, including cytokines, to either activate or inactivate them, and it is even involved in down-regulation of signal peptides.12 Little is known about the mechanisms regulating CD13 lineage-restricted expression and about its function on cells of hematopoietic origin, apart that it is considered as a cell activation marker the expression of which is associated with high capacity to proliferate. Moreover, CD13 is involved in cell-surface antigen processing through trimming of HLA class II- or class I-bound peptides on antigen-presenting cells, and it is highly expressed on the most potent of these, the DC,14-16 at all stages of their differentiation/maturation be they of myeloid or lymphoid origin.4 17-19
Here, we investigated whether CD13/APN expression level on hematopoietic cells, particularly DC/macrophage progenitors and precursors, correlated with their capacity to expand in culture and, by using known specific inhibitors of APN or monoclonal antibodies (mAb) to engage CD13, we examined its possible role during the growth of these cells in cultures from human cord blood CD34+ HPC.
Materials and methods
Cells
Cord blood CD34+ HPC were obtained from normal cord blood (Laboratoire Senders, Hopital Saint Vincent de Paul; Service de Gynécologie-Obstétrique, Hôpital Saint Antoine, Paris, France) and collected according to institutional guidelines. After Ficoll-Paque (Pharmacia, Uppsala, Sweden) centrifugation, mononuclear cells were enriched in light-density cells by centrifugation over Percoll (d = 1.070, Pharmacia). CD34+HPC were purified with CD34 mAb 561-coated M-450 Dynabeads (Dynal, Oslo, Norway), as described,4 yielding 87% ± 13% viable CD34+ cells (n = 24). The latter cells (1 to 2 × 10⁴/mL) were cultured in 6-well plates (Costar, Cambridge, MA) at 37°C in humidified 5% CO2, in RPMI 1640, 10% fetal calf serum (FCS; Dutscher, Brumath, France), 1% L-glutamine, 1% antibiotics (GIBCO BRL, Paisley, UK), with the following recombinant human growth factors, as reported6: GM-CSF, 5 ng/mL (gift of Schering Plough, Kenilworth, NJ); TNF-α, 10 U/mL (Genzyme, Cambridge, MA); SCF, 50 ng/mL (R & D Systems, Minneapolis, MN); FL, 50 ng/mL (gift of Immunex, Seattle, WA). From day 5, medium and cytokines were renewed every 2 days.
Cells of the lymphoid CEM line and monocytic U937 line, which were CD13− and CD13+ (data not shown), respectively, were also used in some experiments to assay peptidase inhibitors.
Flow cytometry analysis
Cells were incubated for 30 minutes at 4°C in phosphate-buffered saline (PBS), 2% FCS, with 1:100 final fluorescein isothiocyante (FITC)-, phycoerythrin (PE)-, phycoerythrin-cyanin 5 (PCya5)- and/or allophycocyanin (APC)-conjugated mAb: CD34 (581), CD1a (BL6), CD13 (SD1J1), CD95 (UB2), CD116 (SC06) (Immunotech, Marseille, France); CD1a (OKT6; Ortho, Raritan, NJ); CD13 (Leu-M7), CD14 (Leu-M3), CD15 (Leu-M1), BrdU (Becton Dickinson, San Jose, CA; or PharMingen, San Diego, CA); CD13 (WM15) and Fas-L (NOK1) (PharMingen); Bcl-2 (124) and p53 (D0-7) (Dako, Golstrup, Denmark), and Bcl-x (SantaCruz, Santa Cruz, CA). Other CD13 mAb were TÜK1 (Caltag, San Francisco, CA) and F23 (gift from E. Stokert; Ludwig Institute for Cancer Research, New York, NY). After washing, cells were analyzed with a FacsCalibur or a FACScan (Becton Dickinson). Percentage of dead cells was determined by propidium iodide (PI) staining (2.5 μg/mL; Sigma, Saint Louis, MO) and FACS analysis.
Assay of cellular CD13/APN activity
CD13/APN activity was analyzed by spectrophotometry to assess increased 405 nm absorbance due to release of free para-nitroaniline (pNA) from the cleavage of Leu-pNA derivatives in solution. Assays were performed in duplicates in 96-well plates (Costar), using 5 × 10⁴ cells/100 μL/well in PBS to which 1 mmol/L Leu-pNA and 10-3 to 10-6 mol/L peptidase inhibitors arphamenine B, actinonin or bestatin (Sigma), or 0.1 to 50 μg/mL CD13 mAb WM15, TÜK1 or F23, or isotype control mAb were added for up to 6 hours at 37°C.
Determination of cell growth, cell cycle, and apoptosis
On different days of culture, sorted or bulk cells (5 × 10⁵/mL) were cultured overnight under the standard conditions in the presence or absence of peptidase inhibitors or mAb. To assess proliferation, 5 × 10⁴ cells were seeded into 96-well plates (Costar) and cultured under the same conditions but with 37 MBq/well [3H]thymidine ([3H]dThd; Amersham, Amersham, UK). Results are expressed as mean cpm of duplicates.
To determine DNA content in cells at the end of the overnight incubation period, cells were washed in PBS and 75% (v/v) cold ethanol was added dropwise to cell pellets. Fixed cells were incubated at 20°C for ≥ 2 hours and stored at 4°C in ethanol until used. Just before staining, cells were washed with PBS and incubated for 5 minutes on ice with cold PBS, 0.25% Triton-X100 (Sigma), after which they were resuspended in 300 μL PI (10 μg/mL) and incubated on ice for at least 10 minutes before FACS analysis. Also, to evaluate cell cycle, bromodeoxyuridin (BrdU) incorporation was assessed as reported21: BrdU (30 μg/mL) was added to cultures for 2 hours; cells were washed, stained as usual for surface markers, and fixed in 0.5% paraformaldehyde (100 μL/sample) at 4°C; after 4 hours, 25 μL PBS and 5% Tween 20 (Sigma) were added and cells were allowed to permeabilize overnight at 4°C; they were then washed in PBS and resuspended in 20 μL PBS, 10 μg/mL DNAse I (Boehringer, Mannheim, Germany), 4 μL anti-BrdU-FITC or anti-BrdU-PE mAb; after 1 hour, 250 μL PBS were added, and samples were FACS analyzed.
To assess apoptosis, cells were washed in PBS, cytospun onto glass slides, dried, and fixed for 10 minutes in PBS, 1% formaldehyde, and 0.2% glutaraldehyde; they were then incubated for 10 minutes with 0.5 μg/mL Hoechst 33 342 (Sigma), dried at 37°C, washed 3 times in PBS, mounted in glycerol, and examined under UV fluorescence microscopy. External translocation of inner membrane phosphatidylserine (PS) was determined with the Annexin V Apoptosis kit (PharMingen) according to the manufacturer's instructions, followed by FACS analysis.
Caspase-3 activity was determined by the Caspase-3 Cellular Activity Assay kit (BIOMOL Research, Plymouth Meeting, PA) according to the manufacturer's instructions. Briefly, cells were resuspended in ice-cold lysis buffer and centrifuged, and cytosolic extracts (kept in ice or stored at −70°C until use) were then incubated for up to 10 hours at 37°C in microtiter plates with caspase-3 substrate Ac-DEVD-pNa and with or without caspase-3 inhibitor Ac-DEVD-CHO, before absorbance at 405 nm was determined.
Statistics
Results are presented as means ± SD of data from different individual cultures. Statistical analysis used the paired (Excel 5, Microsoft, Redmond, WA), or 1 sample Student's t test (GB-STAT, Dynamic Mycrosystems, Silver Spring, MD) when indicated.
Results
Cellular CD34 and CD13 expression and cell growth
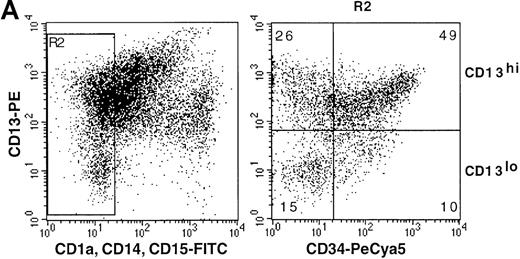
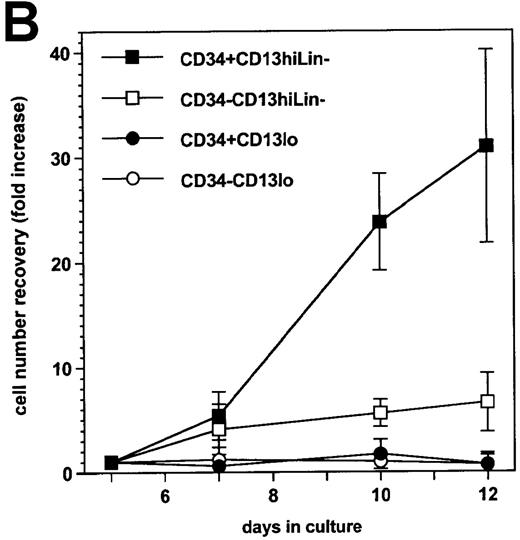
On the basis of CD13 expression, 2 cell populations could be distinguished after 5-day culture of the CD34+ HPC with SCF/FL/GM-CSF/TNF-α: 82% ± 6% of cells were CD13hi, the rest being CD13lo (n = 7). Most CD13hi cells already expressed DC, macrophage, or granulocytic lineage markers CD1a, CD14, or CD15,4,20respectively, whereas 25% ± 8% had no lineage markers and are referred to as CD13hiLin− cells (ie, ∼20% of total cells were CD13hiLin−). All CD13lo cells were Lin− .20 Under our culture conditions, 53% ± 16% CD13hiLin− and 30% ± 14% CD13lo cells were still CD34+ (∼11% and 6% of total cells, respectively) at that time (Figure1A). After sorting according to CD34 and CD13 expression and further culture for 1 week with the same cytokines, CD34+CD13hiLin− cells expanded by 31- ± 9-fold and CD34−CD13hiLin− cells expanded 7- ± 3-fold, whereas CD34+CD13loLin− cells and CD34−CD13loLin− cells did not grow (Figure 1B).
Cellular CD34 and CD13 expression and cell growth.
(A) Flow cytometry 2-color cytograms of culture day 5 cells: After labeling with FITC-CD1a, FITC-CD14, FITC-CD15, PE-CD13, and PCya5-CD34 mAb (left panel), Lin− cells were gated (R2) by excluding FITC-labeled cells; CD13 and CD34 expression of Lin− cells was then evaluated (right panel, with cell percentages indicated); fluorescence intensity is indicated along the 2 axes; data are from 1 experiment of 7. (B) Growth of day-5 sorted cells: after labeling as described in A, cells were sorted according to CD34 and CD13 expression after excluding FITC-labeled cells, and the sorted CD34+CD13lo, CD34−CD13lo, CD34+CD13hi, and CD34−CD13hi cells were cultured further for 7 days; cell recovery is presented as fold increase cell numbers over the number of initially seeded sorted cells; results are expressed as means ± SD (n = 6; with only 2 points examined on day 10).
At that time, the progeny of CD34+CD13hiLin− cells comprised 7% ± 3% CD1a+CD14− and 11% ± 8% CD1a+CD14+ DC, 38% ± 24% CD1a−CD14+monocytes/macrophages, and 28% ± 2% CD15+granulocytes (n = 3), the corresponding figures being 22% ± 8%, 21% ± 5%, 14% ± 3%, and 23% ± 9%, respectively, for cells that derived from day 5 CD34−CD13hiLin− cells. Not enough cells were usually recovered from cultures of the 2 CD13lo Lin− cell populations to allow for phenotyping (data not shown).
Thus, subsequent growth of culture day 5 cells in this system correlated with expression of CD13, all the more so that they were CD34+. Because CD13 may represent a proliferation marker of HPC22 as well as of tumor cells or activated T lymphocytes,23 we hypothesized that CD13 by itself could influence the potential of progenitors and precursors of DC and monocytes/macrophages to proliferate and differentiate in culture.
APN activity of cultured cells and its inhibition
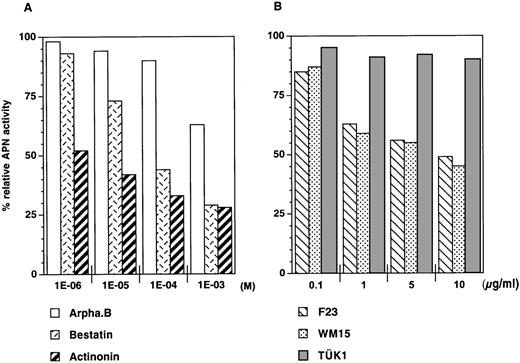
To test this hypothesis, we used molecules known to engage CD13 and/or affect APN activity. Peptidase inhibitors bestatin24and actinonin, the latter known as the most potent and specific inhibitor of CD13/APN activity,25 were chosen to this end; arphamenine B, a specific inhibitor of aminopeptidase B,25served as the control. In a first series of experiments, the compound was added for up to 6 hours to culture day 7 bulk cells—93% ± 4% (n = 7) of which were CD13hiexpressing or not lineage markers CD1a, CD14, or CD15— and APN activity was then determined. Incubation with actinonin had the strongest effect, reducing APN activity to about 23% ± 6% (n = 4) that of cells incubated without inhibitor at 10-3mol/L and to 57% ± 6% at 10-6 mol/L (Figure2A). Although apparently incomplete, this inhibiting activity level actually corresponds to that which is usually noted under similar conditions when using APN.25-29Bestatin was ≥ 10-fold less effective, and arphamenine B had a noticeable effect only at the highest 10-3 mol/L concentration used (Figure 2A). Therefore, only actinonin and control arphamenine B, both at 10-4 mol/L, were used in subsequent experiments.
Assay of membrane APN activity of cultured cells.
(A) Determination of APN activity of cells incubated for 6 hours with peptidase inhibitors arphamenine B (Arpha.B), bestatin, or actinonin. (B) Determination of APN activity of cells incubated for 6 hours with CD13 mAb F23, WM15, or TÜK1. Data, from 1 experiment out of 4 (A) or 3 (B), are presented as percentages of the APN activity (405 nm absorbance) of peptidase inhibitor- or mAb-treated cells relative to control cells incubated without inhibitor or mAb.
CD13 mAb F23 and WM15, both known to neutralize APN activity,24,30,31 and TÜK1 were also assayed: indeed, F23 and WM15 mAb inhibited APN activity, if only by 39% ± 8% (n = 4) and 45% ± 8% (n = 3), respectively, at 10 μg/mL or higher concentrations,32whereas TÜK1 had no effect (Figure 2B; and data not shown).29
Inhibition of cell growth by actinonin
Inasmuch as we found that cell growth correlated with CD13 expression on Lin− cells and that actinonin potently inhibited CD13/APN activity on cultured cells, we next examined its effect on the proliferative capacity of sorted culture day 5 CD13hiLin− and CD13lo cells. Indeed, DNA synthesis in cells of the 2 populations was reduced in the presence of actinonin, but not of arphamenine B, albeit to a much greater extent as regards CD13hiLin− cells (Figure3A). The same was noted when examining day 5 and day 7 bulk cells, > 90% of which were CD13hi as already indicated4: [3H]dThd uptake by these cells was also strongly reduced by actinonin (Figure 3B). When cells were transiently treated for 1 to 5 hours with actinonin and washed and recultured overnight without, instead of with the inhibitor, DNA synthesis was then comparable to that in control cultures (data not shown), indicating that this effect of actinonin was reversible and was not the mere result of nonspecific toxicity.33
Effect of the inhibition of APN activity on cultured cell growth.
(A) Sorted CD13hi and CD13lo cells were incubated overnight in the presence of 3[H]dThd, with or without 10−4 mol/L arphamenine B (Arpha.B) or actinonin; data are from 1 experiment of 2. (B) Bulk culture day 5 or day 7 cells were treated in the same manner as in A; data are presented as mean [3H]dThd incorporation ± SD (n = 6); statistical significance of differences: P < .001 for actinonin vs control and vs arphamenine B. (C) Culture day 7 cells were incubated overnight with CD13 mAb F23, WM15 or TÜK1, or with isotype control mAb IgG2a for F23 and IgG1 for WM15 and TÜK1 (all at 50 μg/mL) in the presence of [3H]dThd; data are from 1 experiment of 2.
To provide evidence that actinonin inhibited cell proliferation by specifically interacting with CD13/APN, we used CD13+ U937 and CD13−CEM cells. First, spectrophotometry analysis of APN activity of these cells showed 30% lower absorbance with CEM than with U937 cells (data not shown); arphamenine B had little (at the highest 10−3 mol/L concentration used) or no effect on this activity, whereas actinonin was 30-fold more efficient for U937 than for CEM cells (50% inhibiting concentration: 1 × 10⁻⁵ mol/L versus 3 × 10⁻³ mol/L; Figure4A), confirming its specificity for the CD13+ cells. Accordingly, only actinonin reduced in a dose-dependent manner 3H]dThd uptake by U937 but not by CEM cells, whereas arphamenine B affected neither cell type (Figure4B).
Inhibition of APN activity on CEM and U937 cells.
(A) Assay of APN activity of CEM or U937 cells incubated for 6 hours with different concentrations of arphamenine B (CEM(arpha), U937(arpha)) or actinonin (CEM(act), U937(act)); mean percentages ± SD (n = 2) of the APN activity of treated cells relative to control cells without inhibitor. (B) CEM or U937 cells were cultured overnight in the presence of [3H]dThd, with or without arphamenine B or actinonin at the indicated concentrations; each bar corresponds to the mean (+ SD) of 3 to 8 independent determinations; the significance of differences between percentages of incorporated cpm and 100% control values was assessed by the 1 sample t test: ***P < .001.
Finally, we examined the effect of incubating culture day 7 cells with CD13 mAb. Surprisingly, only TÜK1 inhibited3H]dThd incorporation by about 30% at 50 μg/mL, but neither WM15 nor F23 had any effect in this respect (Figure 3C) though both inhibited CD13/APN activity.
Actinonin affects the cell cycle and induces apoptosis of cultured cells
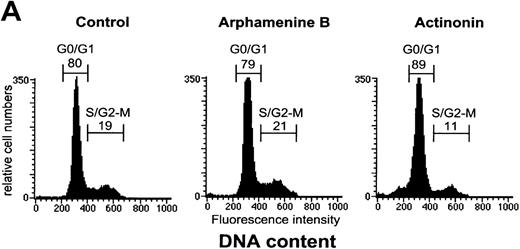
Because actinonin inhibited cell growth to such extent, we examined whether it affected the cell cycle. As shown previously,21only a minority of viable cells were found to be in the S/G2-M phase after 7 days of culture. The proportion of these cells decreased from 19% ± 6% in control cultures (19% ± 7% in arphamenine B-treated cultures) to 11% ± 5% (44% ± 14% reduction relative to controls; P = .001; n = 7) when culture day 7 cells were incubated overnight with actinonin,24 and the percentage of G0/G1 cells increased in parallel (from 81% ± 6% to 88% ± 5%), whereas no change occurred with arphamenine B (Figure 5A). In addition, actinonin increased cell mortality since the proportion of PI+ cells reached 25% ± 12% of actinonin-treated cells relative to 6% ± 3% or 5% ± 2% when cells were incubated either in the control condition or with arphamenine B (P = .005; n = 8). This indicates that at least part of the actinonin effect was to arrest cells in the G0/G1 phase and block passage to the S/G2-M phase, which might then lead to cell death.
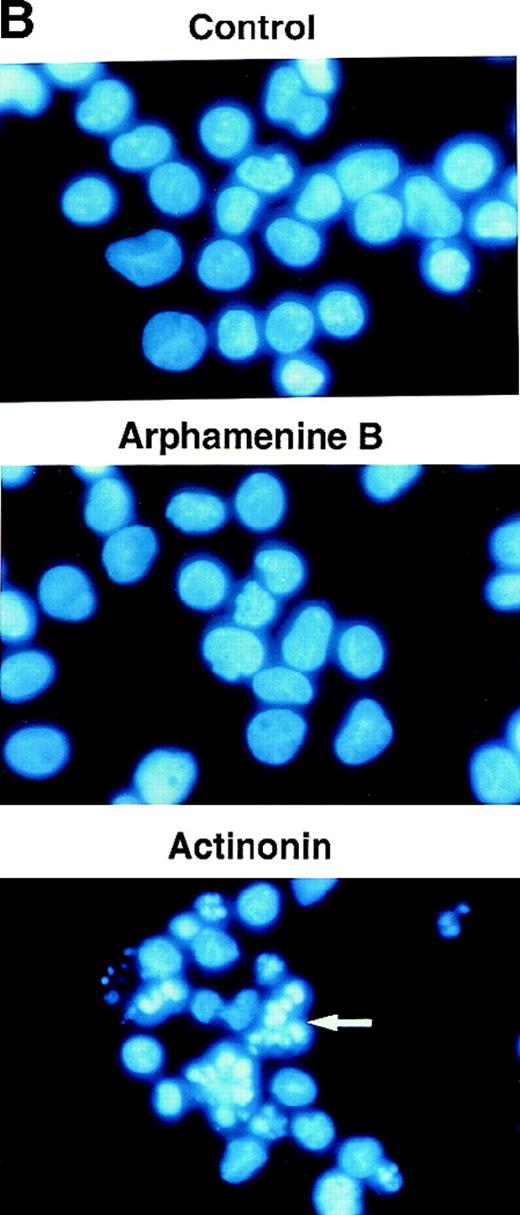
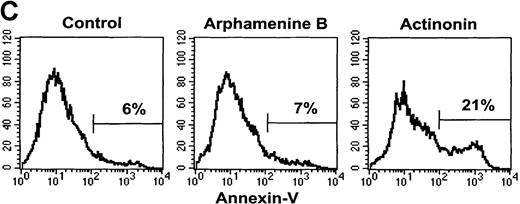
Effect of the inhibition of APN activity on the cell cycle and the induction of apoptosis.
Culture day 7 cells were incubated overnight with or without 10−4 mol/L arphamenine B or actinonin before being examined. (A) DNA content was determined by flow cytometry after ethanol fixation, permeabilization and PI staining: percentages of cells in the G0/G1 or S/G2-M phase, assessed relative to viable cell numbers, are indicated; data are from 1 representative experiment out of 7. (B) Nuclear morphology was visualized by ultraviolet light microscopy after Hoechst 33 342 staining; the arrow shows a typical apoptotic cell; data are from 1 experiment of 3. (C) Surface expression of inner membrane PS was evaluated by flow cytometry after Annexin-V staining: the percentage of cells with increased PS expression is indicated; data are from 1 experiment of 4.
This led us to examine the mechanism of cell death. Ultraviolet light microscopy after Hoechst 33 342 staining showed nuclear fragmentation typical of apoptosis among actinonin-treated but not control cells (Figure 5B). There was also an increased proportion of cells with subdiploid fragmented DNA noted when analyzing the cell cycle, as exemplified by the subG1 population (see Figure 5A) that increased to 18% ± 9% of all cells versus 2% ± 2% in arphamenine B-treated and 2 ± 1% in control cultures (P = .002, n = 8). Actinonin-induced apoptosis was further confirmed by the increased surface expression of inner-membrane PS after Annexin-V staining (Figure 5C), indicating loss of membrane asymmetry that is an early feature of apoptosis.
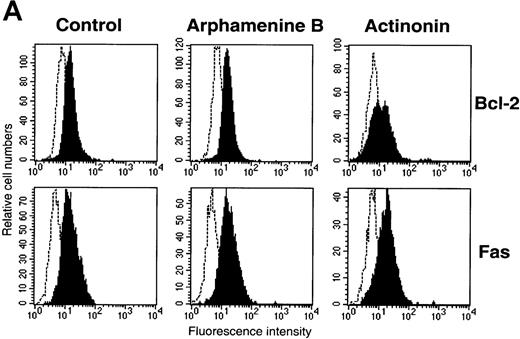
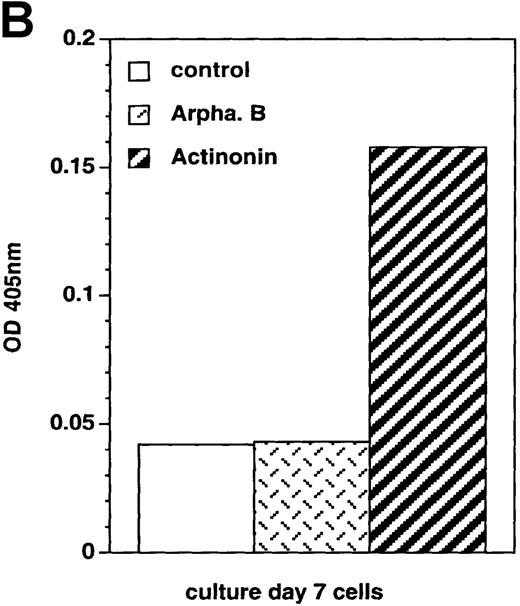
We also investigated cell expression of molecules known to be involved in apoptosis34 such as Bcl-2 and CD95 (Fas), which were both expressed by culture day 7 cells incubated under the control condition, suggesting that Bcl-2 anti-apoptotic mechanisms were then operative. In the presence of actinonin, Bcl-2 expression decreased and that of CD95 was unchanged (Figure 6A), whereas FasL, Bcl-xL, and p53 were not detected in actinonin-treated or in control cells (data not shown). Also, using an assay that assesses cleavage of a chromogenic substrate in the presence of cell lysates, caspase-3 activity was detected in actinonin-treated cells, whereas it was at the same low level in arphamenine B-treated and in control cells (Figure 6B).
Cell expression of molecules known to be involved in apoptosis.
Culture day 7 cells were incubated as indicated in the legend of Figure5. (A) Flow cytometry analysis of Bcl-2 and Fas (CD95) expression; open histograms: labeling with the irrelevant mAb; shaded histograms: staining by the relevant mAb; data are from 1 experiment of 7 (Bcl-2) or 2 (Fas). (B) Assay of caspase-3 activity in cells: cell lysates were incubated for 10 hours with Ac-DEVD-pNa, the cleavage of which was assessed at 405 nm; data are from 1 experiment of 3.
Actinonin preferentially affects DC and macrophage precursors
Altogether, overnight treatment of culture day 7 cells with actinonin led to decreased cell yields at the end of this period: for example, starting from 5 × 10⁵ cells seeded initially, 7 ± 1.6 × 10⁵ cells were recovered under the control condition and 7.7 ± 1.6 × 10⁵ after arphamenine B treatment, but only 3.9 ± 0.9 × 10⁵ cells were obtained with actinonin (P = .001 and P = .002 vs controls and arphamenine B, respectively; n = 5). This decrease in cell numbers under the influence of actinonin prompted us to examine whether it affected distinct or all cell populations in cultures. Indeed, on culture day 7, most cells are CD13hi4 and represent mainly a mixture of CD1a+CD14−DC precursors and differentiated DC, CD1a+CD14+ and CD1a−CD14+ bipotent macrophage/DC precursors and more differentiated cells of the macrophage lineage, and CD15+ granulocytic cells.8,10 21
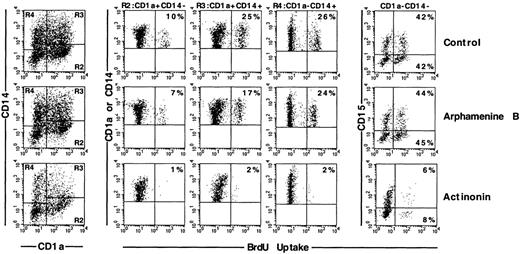
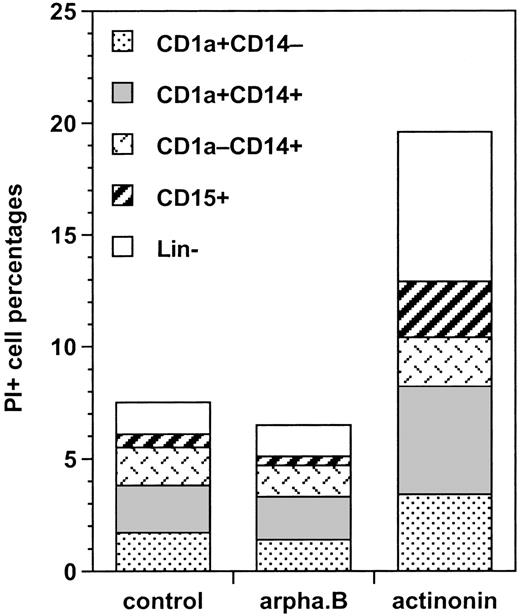
We first analyzed the proportion of cycling BrdU+ cells among these different types of cells. Under the control condition, there were about 50% more cycling CD1a+CD14+than CD1a+CD14−DC precursors (24% ± 9% versus 16% ± 9%; P = .014; n = 6); CD1a−CD14+BrdU+bipotent cell percentages (19% ± 7%) were not significantly different from either, whereas 58% ± 6% of CD15+granulocytic cells were BrdU+ (P = .010 to .044 vs the other cell types; n = 3). Arphamenine B did not affect these percentages, but actinonin reduced by 75% to 90% percentages of cycling cells, whatever their phenotype, but not those of BrdU- cells (Figure 7). This was associated with increase of PI+ cells over the control condition in all populations, but with the CD1a−CD14+ cells, the cells that were still CD13hiLin− and CD1a+CD14+ cells displaying the highest rates (Figure 8).
Effect of the inhibition of APN activity on the cell cycle of the different populations of cultured cells.
Culture day 7 cells were incubated as indicated in the legend of Figure5, and labeled with BrdU, and with CD1a, CD14, and CD15 mAb; cells were gated according to CD1a and/or CD14 and CD15 expression. Results are shown as flow cytometry 2-color cytograms of BrdU incorporation into the indicated gated cells. Markers are indicated along the fluorescence intensity horizontal and vertical axes. Percentages of BrdU+ cells in each gated population are indicated in the right corners of the cytograms. Data are from 1 experiment of 6.
Effect of the inhibition of APN activity on the mortality of the different populations of cultured cells.
Culture day 7 cells were incubated as indicated in the legend of Figure5, labeled with CD1a, CD14, and CD15 mAb, and analyzed by FACS after PI staining. Results are shown as the percentages of differently labeled cells among IP+ cells under the different conditions (means of 2 experiments).
Nevertheless, analysis of the cells recovered at the end of the overnight incubation showed that, relative to controls or arphamenine B-treated cells, CD1a+ DC percentages in actinonin-treated cultures were significantly reduced by about 30%, mostly due to the 40% reduction in the proportion of CD1a+CD14+precursor cells, whereas percentages of the CD1a−CD14+ cells of the macrophage lineage—including bipotent DC precursors—were not modified, and CD15+ cell percentages increased by about 60% (Table1). Because of the reduction in overall cell numbers, this resulted in reduced yields of cells of the DC and macrophage lineages, from 3.9 ± 1.3 × 10⁵ to 1.9 ± 0.7 × 10⁵ (P = .01; n = 4) and from 2.0 ± 0.3 × 10⁵ to 0.7 + 0.2 × 10⁵ (P = .006), respectively, whereas granulocytic cell numbers were not significantly affected (1.0 ± 0.3 × 10⁵ vs 0.8 ± 0.3 × 10⁵; P = .08).
Percentages of CD1a+, CD14+, and CD15+ cells among culture day 7 cells after overnight incubation with or without 10−4 Mol arphamenine B or actinonin
| Conditions . | Cell Percentages . | ||||
|---|---|---|---|---|---|
| CD1a+CD14− . | CD1a+CD14+ . | ΣCD1a+ . | CD1a−CD14+ . | CD15+ . | |
| Control | 19 ± 6 | 32 ± 9 | 51 ± 9 | 24 ± 9 | 14 ± 4 |
| Arphamenine B | 19 ± 6 | 34 ± 9 | 53 ± 10 | 23 ± 9 | 13 ± 4 |
| Actinonin | 20 ± 5 | 20 ± 8 | 40 ± 10 | 20 ± 10 | 21 ± 7 |
| P (actinonin vs control) | 0.787 | <0.0001 | 0.0001 | 0.120 | 0.0002 |
| P (actinonin vs arphamenine B) | 0.669 | <0.0001 | <0.0001 | 0.159 | 0.0001 |
Results are mean ± SD of 11 experiments. Statistical analysis was performed using the paired Student's t test; significant levels are indicated in italics.
Discussion
We previously isolated a major CD13hi cell population that appeared in ≤ 5 days in cultures of cord blood CD34+HPC with SCF/GM-CSF/TNF-α.4,20 This population comprised cells already expressing CD1a, CD14, and CD15 lineage markers as well as CD13hiLin− precursors thereof: CD15+granulocytes appeared and plateaued earlier than CD1a+ DC and CD14+ monocytes/macrophages, confirming early branching off from the latter lineages.21,35 These findings allowed us to delineate a differentiation pathway from CD34+ HPC to CD13hiLin− progenitors of either or both DC and monocytes/macrophages,4,20 and it is now known that there are in fact 2 intermediate precursors of DC differentiating from CD13hiLin− cells: CD1a+CD14−precursors of DC/LC and CD1a−CD14+ bipotent precursors of DC and macrophages7-10 (and data not shown). In our initial report, only a minority of CD13hiLin- cells were CD34+,4,20 whereas here, presumably because of the additional use of FL, which not only potentiates the growth of, but also acts as survival factor for HPC,36 initially CD34+CD13lo HPC differentiated into CD13hiLin− cells half of which were still CD34+ on culture day 5. Even when they were CD34−, CD13hiLin− cells had a greater capacity than CD34+ or CD34−CD13lo cells to proliferate and differentiate into DC and monocytes/macrophages under the culture condition used here. Moreover, when their clonogenicity was examined in a semisolid assay with the same cytokines as in liquid culture, CD34+CD13hiLin− cells yielded the highest number of colonies, most of which were mixed CFU-M/DC or pure CFU-DC; CD34-CD13hiLin− cells yielded less colonies of the same types. The capacity to generate colonies from CD34+CD13loLin− cells was lower and limited to CFU-G, whereas CD34−CD13loLin− cells had almost no clonogenic capacity (M. Guigon, personal communication). Expansion and engagement of CD13hiLin− progenitors toward DC rather than macrophages or granulocytes should then be enhanced by the cytokine combination used here. At any rate, in liquid as in semisolid culture, growth and differentiation of cells of the DC and monocyte/macrophage lineages correlated foremost with CD13 expression level.
CD13 is expressed on stem cells and during most development stages of myeloid cells and therefore it is generally considered as a myelomonocytic marker.37 It is highly expressed on DC precursors as well as on differentiated DC.4,17-19 However, CD13 expression has also been found to correlate with growth and activation of different cell types: (i) it is indeed preferentially expressed on proliferating CFU-GM progenitors,22,38 on malignant acute myeloblastic cells but also on lymphoblastic leukemia cells,39,40 (ii) its expression is associated with proliferation of activated T lymphocytes,41,42 and (iii) inhibition of CD13 expression or of APN activity reduces proliferation of different cell types.24,33 41-43 This led us to hypothesize that CD13/APN could play a direct role in the development of DC and/or macrophages from their progenitors.
Natural substrates of CD13 include vasoactive peptides, neuropeptides such as leu- and metenkephalin, and the chemokine IL-8.37Leu-enkephalin was first used to evaluate whether CD13 engagement influenced the growth of CD13hi cells, but its effect was limited and only detectable at the highest 10−3 mol/L concentration used (data not shown). Of note, bradykinin or substance P is known to inhibit APN activity in the same concentration range.37 Therefore, we next used pseudopeptide inhibitors of APN activity and CD13 mAb to this end. The naturally occurring derivative of L-prolinol considered as the most selective inhibitor of APN,25,44 actinonin, strongly reduced APN activity on cultured cells while APN-blocking CD13 mAb F23 and WM15 were less potent. These findings may indicate that actinonin could also inhibit APN-like activities mediated by membrane ectopeptidases other than CD13/APN,25,26,29 but the ability of CD13 mAb to inhibit APN activity has also been reported to vary depending on the cells used, which may be due to the occurrence of multiple CD13 species on the same or different types of cell.27-29 For example, five CD13 species with different glycosylation patterns have been reported on U937 cells, and this may impinge on the epitopes recognized by different mAb.45
We next found that actinonin inhibited growth of CD13hiLin− or CD13hiLin+ cells, which was associated with an increase of cycling cells in the G0/G1 phase and with an increased proportion of apoptotic cells. This is compatible with arrest of cells in the G0/G1 phase and subsequent death, or with actinonin inducing death selectively beyond G0/G1. Bcl-2, which protects cells from apoptosis, is normally upregulated during DC differentiation/maturation and, with CD95, it participates to the regulation of apoptosis during distinct phases of DC development.18 Here, CD95 expression was unchanged on actinonin-treated cells, whereas that of Bcl-2 decreased concomitantly with the increase of caspase-3 activity, an enzyme that could then cleave Bcl-2 and inactivate its antiapoptotic function.46This suggests that this may be 1 of the pathways leading to apoptosis through engagement of CD13. All cycling cells in the cultures were susceptible to actinonin, but finally the percentages and yields of DC and macrophage precursors appeared to be affected to a greater extent than cells of the granulocytic lineage. This observation is in line with data indicating that CD13 expression level remains high on differenciating DC and macrophages whereas it decreases as granulocytes differentiate11 (other data not shown: J. Langner, Martin-Luther-Universität Halle/Saale, Germany, personal communication). Thus, it is possible that CD13/APN participates in regulating expansion and survival of DC and monocyte/macrophage progenitors and precursors through cleavage of molecules controlling hematopoiesis.
However, no physiologic substrate of CD13/APN has yet been implicated in such a process and, of the cytokines tested so far, only IL-8 has been shown to be degraded by APN.31,37 It may be relevant here that CD13 reportedly plays a role in tumor cell migration47,48 through its function as an adhesion molecule,37 inasmuch as DC precursors and differentiated DC are highly motile and migrate in response to chemotactic signals.49 Although there is no indication that IL-8 is involved in expansion of DC precursors, one may not rule out that CD13/APN could be involved in this process in vivo during migration of DC precursors from the bone marrow in response to this or other chemokines.31,49,50 Nevertheless, we examined whether GM-CSF—a critical myeloid growth factor, which also preserves viability of immature as well as mature DC51-53—could be a target of APN. This enzyme splits off the penultimate N-terminal amino acid of proteins, with the exception of Pro.31 However, GM-CSF has a penultimate N-terminal Pro and cannot thus be directly cleaved by APN,54 though APN might well collaborate with other aminopeptidases (CD10, CD26, BP-1) in this regard.54 Using an ELISA (Immunotech), we found increased GM-CSF levels in actinonin-treated relative to control culture day 7 cell supernatants (data not shown). This may merely reflect decreased comsumption by cells blocked in the G0/G1 phase or undergoing apoptosis, but one may not rule out that actinonin could act by preventing uptake and/or consumption of GM-CSF by the cells, perhaps through a mechanism involving its inhibiting capacity of CD13/APN proteolytic activity. Finally, exposure to bestatin has been reported to modulate GM-CSF receptor surface expression on cells of the TF-1 and U937 lines55 but, here, this expression on actinonin-treated cells was comparable to that on control cells (data not shown).
Thus, CD13/APN may well play a role in the growth of progenitors and pure DC and bipotent DC/macrophage precursors through engagement of its enzymatic site and processing of biologically active molecules. However, when we used CD13 mAb instead of actinonin to confirm the CD13 specificity of its effect, only the nonblocking mAb, and not the APN-blocking mAb, inhibited cell growth. The same type of findings was reported by other investigators in experimental models with different cell systems.24,56 This suggests that actinonin-induced cell growth inhibition may be associated with either or both inhibition of APN activity and/or binding of CD13 to a cell membrane ligand that may then act as a signal-transducing molecule, as reported for dipeptidyl peptidase IV (CD26).57 58
Acknowledgments
We gratefully acknowledge the help of the following colleagues and companies: Pr. J. Milliez and his staff of the service de Gynécologie-Obstétrique, Hôpital Saint-Antoine (Paris, France) for the gift of cord blood samples; Drs E. Thomas and E. Maraskovski (Immunex, Seattle, WA) for the gift of recombinant Flt-3 ligand; Schering Plough (Kenilworth, NJ) for the gift of recombinant GM-CSF; and Dr E. Stokert (Ludwig Institute for Cancer Research, New York, NY) for the gift of mAb F23. We also thank M. Yagello for his invaluable contribution to cell sorting, Dr P. Auberger (CJF INSERM 96-05, Nice, France) for his advice and fruitful discussions, and Pr. Jürgen Langner and his colleagues (Martin-Luther-Universität, Halle/Saale, Germany) for their helpful interest in our work.
Supported by the Agence Nationale de Recherche sur le SIDA, the Association de Recherche contre le Cancer, the Comité de Paris de la Ligue Nationale contre le Cancer, and the Association pour la Recherche sur les Déficits Immunitaires Viro-Induits (Paris, France).
Reprints:Jean Claude Gluckman, Laboratoire d'Immunologie, CERVI, Hôpital de la Pitié-Salpêtrière, 83 Bld de l'Hôpital, 75651 Paris Cedex 13, France.
The publication costs of this article were defrayed in part by page charge payment. Therefore, and solely to indicate this fact, this article is hereby marked “advertisement” in accordance with 18 U.S.C. section 1734.

![Fig. 3. Effect of the inhibition of APN activity on cultured cell growth. / (A) Sorted CD13hi and CD13lo cells were incubated overnight in the presence of 3[H]dThd, with or without 10−4 mol/L arphamenine B (Arpha.B) or actinonin; data are from 1 experiment of 2. (B) Bulk culture day 5 or day 7 cells were treated in the same manner as in A; data are presented as mean [3H]dThd incorporation ± SD (n = 6); statistical significance of differences: P < .001 for actinonin vs control and vs arphamenine B. (C) Culture day 7 cells were incubated overnight with CD13 mAb F23, WM15 or TÜK1, or with isotype control mAb IgG2a for F23 and IgG1 for WM15 and TÜK1 (all at 50 μg/mL) in the presence of [3H]dThd; data are from 1 experiment of 2.](https://ash.silverchair-cdn.com/ash/content_public/journal/blood/95/2/10.1182_blood.v95.2.453/6/m_bloo00223003x.jpeg?Expires=1767699271&Signature=HhBB1P15KNqBhA6fUN~R9l9WgyrtnJAUtFtkY7~3yYoeKQc5e0XmwjlricgYJ2hM4avjUKy4M3jwnrC1e7eKnWliXdfLZHWMaZ4-j-9FCfQnEwatMeOBggE4xmMJc6WE2WRF6SIHXbl8sNddH16x2jRG0cls2OB1wJi9JoOX1kFIooubwcKxFUdhXYuoMfiOL5shgXHCN8deqsCH50xpw6mtP-7iMrqv5Yxpcox98w-QJJftQVklBtbD9CDiJUebgd2cFLpdip3m20HSh4gMbjXLP3devqUh7TxZy5PIpmzuGMpLq6xTauduOLlCw6kIRLmBRHDoo1bbO6in0QeeDA__&Key-Pair-Id=APKAIE5G5CRDK6RD3PGA)
![Fig. 4. Inhibition of APN activity on CEM and U937 cells. / (A) Assay of APN activity of CEM or U937 cells incubated for 6 hours with different concentrations of arphamenine B (CEM(arpha), U937(arpha)) or actinonin (CEM(act), U937(act)); mean percentages ± SD (n = 2) of the APN activity of treated cells relative to control cells without inhibitor. (B) CEM or U937 cells were cultured overnight in the presence of [3H]dThd, with or without arphamenine B or actinonin at the indicated concentrations; each bar corresponds to the mean (+ SD) of 3 to 8 independent determinations; the significance of differences between percentages of incorporated cpm and 100% control values was assessed by the 1 sample t test: ***P < .001.](https://ash.silverchair-cdn.com/ash/content_public/journal/blood/95/2/10.1182_blood.v95.2.453/6/m_bloo00223004x.jpeg?Expires=1767699271&Signature=lPPRBNFwKJ836ZPIczNzIhTkNO5yuTa2P7rtn0A77Eh7m1xLmi0rf4GdR2t-r13IeuUVmuVSwzjBseaeZ4msjqePG7JXeO9NG5HvBo2ZMk-ejsmXqD-8-B-RBX3enUvydQ0M~8Dcd2ZWtVYoS9MhIeqgMfQSt0d630kWR2nkpB-woEg5DdhXSok8khalLsE8OuzmARP6R9z2oY1i7b8u6VRZHR5nKs1IktTtTWwCwT57X~r32x4QAjaowt2osWY5fsC89HqnpAAcNMsQpyBahqpRzt~vyM-k15c1F34N2YINkOoqCGJ0Jd4ytQyCJBFYsTYXDjju-fdGaffTcTd~mg__&Key-Pair-Id=APKAIE5G5CRDK6RD3PGA)
This feature is available to Subscribers Only
Sign In or Create an Account Close Modal