Plasma-derived antithrombin III (ATIII) prevents the lethal effects of Escherichia coli infusion in baboons, but the mechanisms behind this effect are not clear. In the present study, we evaluated the effects of recombinant human ATIII (rhATIII) on the clinical course and the inflammatory cytokine and coagulation responses in baboons challenged with lethal dose of E coli. Animals in the treatment group (n = 5) received high doses of rhATIII starting 1 hour before an E colichallenge. Those in the control group were administered saline. Survival was significantly improved in the treatment group (P = .002). Both groups had similar hemodynamic responses to E coli challenge but different coagulation and inflammatory responses. The rhATIII group had an accelerated increase of thrombin-ATIII complexes and significantly less fibrinogen consumption compared to controls. In addition, the rhATIII group had much less severe thrombotic pathology on autopsy and virtually no fibrinolytic response to E coli challenge. Furthermore, the rhATIII group had a significantly attenuated inflammatory response as evidenced by marked reduction of the release of various cytokines. We conclude that the early administration of high doses of rhATIII improves the outcome in baboons lethally challenged with E coli, probably due to the combined anticoagulation and anti-inflammatory effects of this therapy.
Antithrombin III (ATIII) plays a central role in regulating hemostasis. When bound to glycosaminoglycans, it is an important inhibitor of several serine proteases, including factors Xa, IXa, XIa, and thrombin,1 that are involved in blood coagulation. Because of this central inhibitory role in the hemostatic system, ATIII is believed to play an important role in the clinical syndrome of diffuse intravascular coagulation (DIC), which may occur in patients with sepsis. Consistent herewith are observations that plasma levels of ATIII are decreased in patients with DIC, and this is most likely due to increased consumption and decreased synthesis.2
In baboons challenged with a lethal dose of Escherichia coli, infusion of plasma-derived human ATIII has been shown to promote survival and protect against DIC.3 It was hypothesized that this protection was due to inhibition of thrombin and the thrombin-mediated coagulation response. A later study showed that active site blocked Xa (DEGR Xa) could not prevent shock, organ damage, and mortality in this model despite an efficient blockade of the coagulation response.4 Hence, the protective effect of ATIII infusion on lethality after LD100E coli in the baboon model cannot solely result from its effect on fibrin formation, but it may be due to other effects such as modulation of the inflammatory reaction.
Infusion of LD100E coli in the baboon model has been shown to induce tumor necrosis factor-α (TNF-α), interleukin-6 (IL-6), IL-8, and other cytokines that appear to regulate inflammatory as well as hemostatic responses to E colichallenge.5
In the present study of a lethal E coli baboon model, we investigated the effects of recombinant human ATIII, which was produced in the milk of transgenic goats, on markers of inflammation, coagulation, and fibrinolysis.
Materials and methods
Test article
Recombinant human ATIII (rhATIII) was produced in the milk of transgenic goats, purified to >99%, and provided as a sterile lyophilized preparation. When reconstituted in water for injection, the 350 units/mL solution contained: sodium chloride, 0.138 mol/L; sodium citrate, 0.01 mol/L; and glycine, 0.133 mol/L, pH 7.4 (Genzyme Transgenic, Framingham, MA). The specific activity of the preparations used was 7 units/mg. Structurally, the rhATIII used in these experiments was identical to plasma-derived human ATIII except for differences in glycosylation. Plasma-derived ATIII has disialylated, biantennary complex carbohydrate structures at all 4 N-linked glycosylation sites, with very little fucosylation. In contrast, rhATIII contains oligomannose structures at 1 of the sites (Asn 155) and less highly sialylated, more highly fucosylated complex carbohydrate structures at the other 3 sites. rhATIII also contains 2 sugars not present in pATIII (N-acetyl-galactosamine instead of galactose and N-glycolyl-neuraminic acid instead of N-acetyl-neuraminic acid).6
Experimental design
Experiments were performed on 10 juvenile baboons (Papio Anubis/Cynocephalus), 1 at a time. They were fasted overnight and given water ad libitum. The E coli (type B) preparation was performed as described.7 Each animal was sedated with ketamine hydrochloride (14 mg/kg, intramuscularly) on the morning of the study and anesthetized with sodium pentobarbital (2 mg/kg) via a percutaneous catheter positioned in the cephalic vein. The femoral artery and both femoral veins were cannulated aseptically and used for measuring aortic pressure, obtaining blood samples, infusing organisms and rhATIII, and administrating fluids and anesthetics, as reported elsewhere.7 All baboons were challenged with a 2-hour infusion of a lethal dose of E coli (about 4 × 10¹⁰ organisms/kg) at t = 0 hour. Gentamycin was given as a 60-minute infusion (9 mg/kg, intravenously) 2 hours after the start of the experiment, followed by 30-minute infusions (4.5 mg/kg) at 6 and 9 hours. Gentamycin (4.5 mg/kg) was further given intramuscularly at 12 hours and twice daily for 3 days.
The treatment group, consisting of 5 animals, received the following 3 administrations of rhATIII (approximate doses): (1) a 30-minute infusion of 470 units/kg starting at t = -1 hour (1 hour before E coli challenge), (2) a bolus of 230 units/kg administered at t = 0 hours, and (3) a 30-minute infusion of 460 units/kg starting at t = 3 hours.
The control group of animals, which consisted of a pool of controls, was treated during a 6-month period preceding the rhATIII studies described above. They received a continuous 9-hour infusion of saline.8 All animals were maintained under anesthesia and monitored for 10 hours. They were observed continuously for an additional 36 hours and daily for a maximum of 7 days. Blood samples were collected at given time points for hematology, clinical chemistry, and ATIII determinations. Furthermore, additional samples were collected on final concentrations of 10 mmol/L ethylene diamine tetra-acetic acid (EDTA) and 0.1 mg/mL soy bean trypsin inhibitor before t = 0 and at 1, 2, 3, 4, 6, 8, and 10 hours after the start of the E coli infusion. The samples, which were used to determine cytokines, neutrophil degradation products, and coagulation and fibrinolytic parameters, were stored frozen until all samples were available for assay.
Baboons surviving for 7 days were considered permanent survivors and were subsequently killed with sodium pentobarbital. Necropsy was performed on all animals. All animal studies were approved by the Institutional Review Board for Animal Studies.
Assays
Plasma levels of ATIII activity were measured by assessing ATIII-mediated thrombin inhibition in the presence of heparin. The protocol is a 2-stage colorimetric end point assay in a microplate format, and residual thrombin activity is measured using the amidolytic substrate S2238.9 Plasma concentrations of TNF, IL-6, IL-8, and IL-10 were measured by ELISA as previously described10-12 and expressed as ng/mL or, in the case of IL-10, pg/mL.
Levels of tissue-type plasminogen activator (tPA), plasminogen activator inhibitor type 1 (PAI-1), and thrombin-ATIII (TAT) complexes were determined by ELISA as described previously.13-15Values were expressed as ng/mL. Plasmin-α2-antiplasmin (PAP) complexes were measured by radioimmunoassay as described.15PAP complex levels were expressed as a percentage of the level present in normal baboon plasma (NBP), in which a maximum amount of complexes was generated by incubation with an equal volume of urokinase (UK, 50 μg/mL) in the presence of 0.2 mol/L methylamine (final concentration).15 This standard is further referred to as NBP-MA-UK.
Statistical analysis
Results are expressed as mean ± SEM (standard error of the mean). Comparisons between groups during the course of the observation period were performed using the analysis of variance program (ANOVA) or, in case of abnormally distributed parameters, the Mann-Whitney U test. Statistical significance in survival was analyzed by log rank test. A 2-sided value of P < .05 was considered to indicate a significant difference.
Results
Establishment of sepsis
Table 1 shows the weight, sex, actualE coli dose administered, the number of organisms circulating at 2 hours, and the survival times of the animals in the control and treatment groups. Although the dose of E coli administered was significantly lower in the treatment group (6.2 ± 0.5 × 10¹⁰ CFU/kg) than in the control group (8.7 ± 0.45 × 10¹⁰ CFU/kg),P < .05, the amounts infused were all within the LD100 range (4-8 × 10¹⁰ CFU/kg) established over a 10-year period. After 2 hours, the E coliconcentration was 5-fold lower in the treatment group (0.9 ± 0.6 × 10⁷ CFU/kg) compared with the control group (4.8 ± 2.6 × 10⁷ CFU/kg),P < 0.05.
Weight, sex, E coli dose, and survival in control and rhATIII groups
| . | Weight (kg) . | Sex . | E coli Dose (×1010 CFU/kg) . | E coli Count (2 h) (×107 CFU/kg) . | Survival (h) . |
|---|---|---|---|---|---|
| Control Group No. | |||||
| 7 | 5.5 | F | 9.48 | 15 | 19.5 |
| 11 | 5 | F | 10.02 | 3.65 | 27 |
| 3 | 6.6 | M | 7.68 | 1.72 | 17 |
| 4 | 6.1 | M | 8.16 | 1.28 | 15 |
| 7b | 6.8 | M | 8.15 | 2.22 | 18.5 |
| Mean ± SEM | 6.0 ± 0.3 | 8.7 ± 0.45 | 4.77 ± 2.59 | 19.4 ± 2 | |
| rhATIII Group No. | |||||
| 1 | 10.2 | F | 5.45 | 0.07 | >168 |
| 2 | 11.4 | F | 7.7 | 0.02 | 28 |
| 3 | 9.6 | M | 6.7 | 0.90 | >168 |
| 4 | 10.5 | M | 5.34 | 1.39 | 57 |
| 5 | 6.9 | F | 5.64 | 1.15 | >168 |
| Mean ± SEM | 9.7 ± 0.8* | 6.2 ± 0.5* | 0.70 ± 0.28* | >117.8 ± 31.1† |
P < .05 compared with control group (Mann-Whitney U test). Although statistically different, the amounts infused were all within the LD100 range (4-8 × 10¹⁰ CFU/kg) established over a 10-year period.
Indicates P = .002 (log rank test).
Plasma ATIII concentration-time data
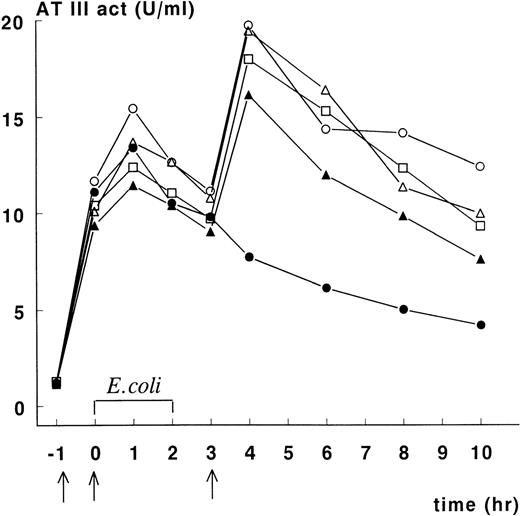
Figure 1 depicts ATIII activity in plasma of animals in the treatment group. Increases in ATIII activity were noted following each administration of rhATIII. The data indicate that baboon No. 2 did not receive the third rhATIII dose, and we have not been able to determine how this occurred. For the other animals, plasma ATIII activity was maintained at or above 10 units/kg of body weight for 10 hours after initiation of E colichallenge, and maximum plasma concentrations of ATIII activity (measured at t = 4 hours) averaged 18 units/mL. After the final infusion, ATIII activity disappeared from the circulation with an apparent half-life of approximately 6 hours.
Course of ATIII activity levels in septic baboons treated with rhATIII.
Recombinant human ATIII was infused 1 hour before E coliinfusion, at t = 0, and 3 hours after infusion in concentrations of 66.7, 33.3, and 66.7 mg/kg, respectively (indicated by arrows). ATIII activity levels were measured as previously described. Baboon No. 1 (○), No. 2 (•), No. 3 (▵), No. 4 (▴), and No. 5 (□).
Overall outcome
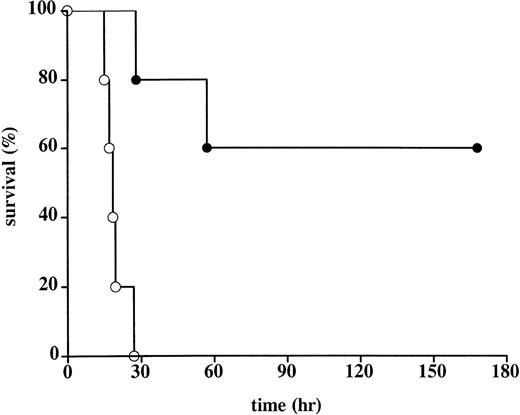
Administration of rhATIII promoted survival against a lethal infusion of E coli (Table 1, Figure2). The mean survival of controls was 19.4 hours. In this group, all animals died of multiple organ failure and DIC. These controls behaved consistently and comparably with other control groups in studies done by the Oklahoma Medical Research Group.3,4 7 In contrast, the mean survival rate of the treated animals was significantly longer: 3 animals survived >168 hours to scheduled euthanasia; 1 animal died 57 hours after E coli administration as a result of capillary leakage in the lungs, consistent with acute respiratory distress syndrome (ARDS), but no evidence of DIC; and 1 animal died 28 hours after E coliadministration as a result of multiple organ failure and moderate DIC. Notably, the latter animal (baboon No. 2) had not received the final administration of rhATIII at t = 3 hours after the onset of infection (Figure 1). As a result, the plasma ATIII activity levels in this animal at time points beyond 3 hours were half those measured in the 3 animals that survived until scheduled sacrifice. Plasma ATIII activity levels in the animal that only survived 57 hours postinfection (baboon No. 4) were consistently lower following E coli challenge than the levels in animals that survived until study termination.
Survival in control and rhATIII-treated baboons.
The Kaplan-Meier curve of 5 control baboons (○) and 5 rhATIII-treated baboons (•) after lethal challenge with E coli. Animals surviving for 168 hours (7 days) were considered permanent survivors. Survival was significantly higher in the rhATIII-treated animals, as measured by log rank test (P = .002).
Physiological and hematological responses
The effect of rhATIII infusion on E coli–induced physiological and hematological response patterns is shown in Table2. In all baboons, the infusion of E coli produced a severe hypotensive shock, which was not affected by rhATIII infusion. A decline in MSAP was observed at t = 2 hours and maintained throughout the 10 hour-observation period. Heart rates were similarly elevated in either group, but temperature was significantly higher in the treatment group than in the control group (P < .05). Administration of the first infusion of rhATIII resulted in a significant rise in white blood cell (WBC) counts, from 5.7 ± 0.8 (103/μL) at t = −1 to 13.2 ± 3 (103/μL) at t = 0 (P < .05). Saline-infused controls had WBC counts of 5.9 ± 0.7 (103/μL) and 5.8 ± 1.7 (103/μL) at these respective time points. After E coli challenge, WBC counts decreased equally in both treatment groups.
Effects of ATIII treatment on physiological responses in baboons after infusion of lethal E coli
| Time (h) . | 0 . | 1 . | 2 . | 4 . | 6 . | 8 . | 10 . |
|---|---|---|---|---|---|---|---|
| MSAP | |||||||
| Control | 119.4 ± 6.7 | 109 ± 2.9 | 74.4 ± 7.4 | 61.6 ± 7.8 | 72.2 ± 4.4 | 72.6 ± 10.6 | 68.6 ± 1.09 |
| ATIII | 126.6 ± 4.6 | 108.4 ± 7.4 | 74.6 ± 10 | 80 ± 11.2 | 83.4 ± 7.3 | 81 ± 6.2 | 79.4 ± 7.2 |
| HR | |||||||
| Control | 136 ± 11.2 | 156 ± 12.9 | 176 ± 9.3 | 193 ± 8.8 | 190 ± 10 | 192 ± 9.7 | 195 ± 8.7 |
| ATIII | 144 ± 9.3 | 178 ± 16.2 | 207 ± 14.3 | 204 ± 12.1 | 205 ± 12 | 207 ± 8.3 | 207 ± 8.6 |
| TEMP | |||||||
| Control | 36.4 ± 0.5 | 35.9 ± 0.3 | 36.4 ± 0.4 | 37.1 ± 0.4 | 37.1 ± 0.4 | 37.3 ± 0.6 | 36.9 ± 0.4 |
| ATIII | 37.1 ± 0.1 | 37.3 ± 0.2 | 38.3 ± 0.3 | 38.4 ± 0.2 | 38.3 ± 0.3 | 38.2 ± 0.3 | 38.3 ± 0.2 |
| WBC | |||||||
| Control | 5.8 ± 1.7 | 2.3 ± 0.2 | 1.4 ± 0.2 | 1.4 ± 0.2 | 1.6 ± 0.2 | ND | 2.7 ± 0.3 |
| ATIII | 13.2 ± 3 | 3.2 ± 1 | 1.3 ± 0.2 | 1.8 ± 0.3 | 2.2 ± 0.3 | ND | 3.1 ± 0.6 |
| PLT | |||||||
| Control | 323 ± 26 | 255 ± 18 | 215 ± 17 | 175 ± 16 | 150 ± 14 | ND | 124 ± 25 |
| ATIII | 307 ± 46 | 220 ± 28 | 207 ± 29 | 177 ± 30 | 159 ± 28 | ND | 85 ± 16 |
| HCT | |||||||
| Control | 37.2 ± 1.1 | 39.8 ± 1.3 | 37.4 ± 1.3 | 37.8 ± 1.8 | 40.2 ± 1.6 | ND | 41.6 ± 1.0 |
| ATIII | 41.4 ± 1.1 | 41 ± 1 | 38.6 ± 1.2 | 41 ± 1.8 | 40.8 ± 1.2 | ND | 40.2 ± 2.1 |
Values represent mean ± SEM of mean arterial pressure (MSAP, mm Hg), heart rate (HR, beats/min), temperature (temp, °C), white blood cell counts (WBC, 103/mm3), platelets (PLT, 103/mm3), and hematocrit (HCT, %). The course of the parameters was different between groups for WBC at t = 0 and for temperature (P < .05). ND indicates not determined.
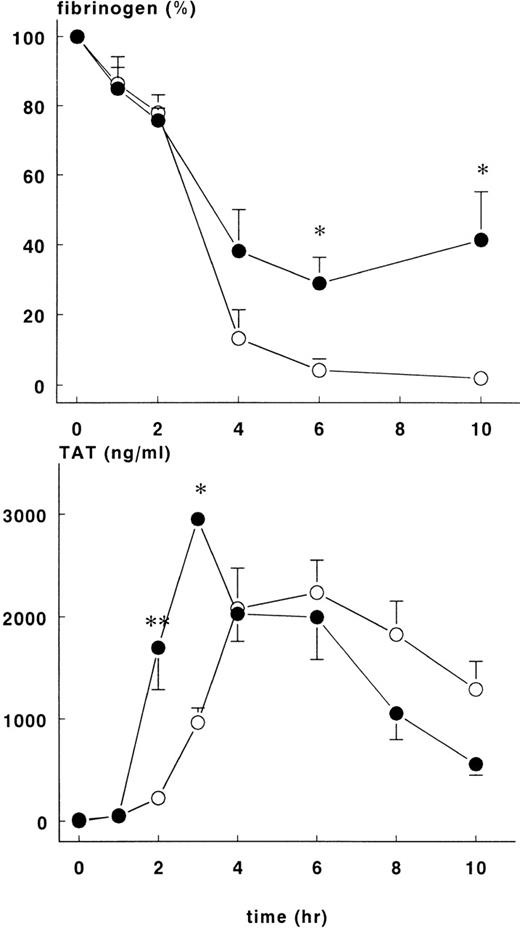
Changes in hematocrit were not different between the groups, but the fall in fibrinogen concentration varied. Fibrinogen levels in the treatment group were 29±7.4% of baseline at 6 hours and 41.4 ± 13.9% of baseline at 10 hours (P < .05). These figures are significantly higher than those in the control group at these time points, 4.2 ± 3.2% and 2 ± 0.8%, respectively (Figure 3).
Fibrinogen and TAT complexes in control and treatment group.
Mean ± SEM plasma levels of fibrinogen (upper panel) and TAT complexes (lower panel) in control (○) and rhATIII-treated (•) baboons. After infusion of E coli, fibrinogen concentration (%) was significantly higher in the treatment group at 6 and 10 hours, whereas TAT complexes were significantly higher in the treatment group at 2 and 3 hours. *P < .05; **P < .01.
No differences between the 2 treatment groups were observed in biochemical markers related to organ damage, such as lactate hydrogenase, creatinine, blood urea nitrogen, and alanine aminotransferase, either before the experiment or after 10 hours (results not shown).
Cytokine responses
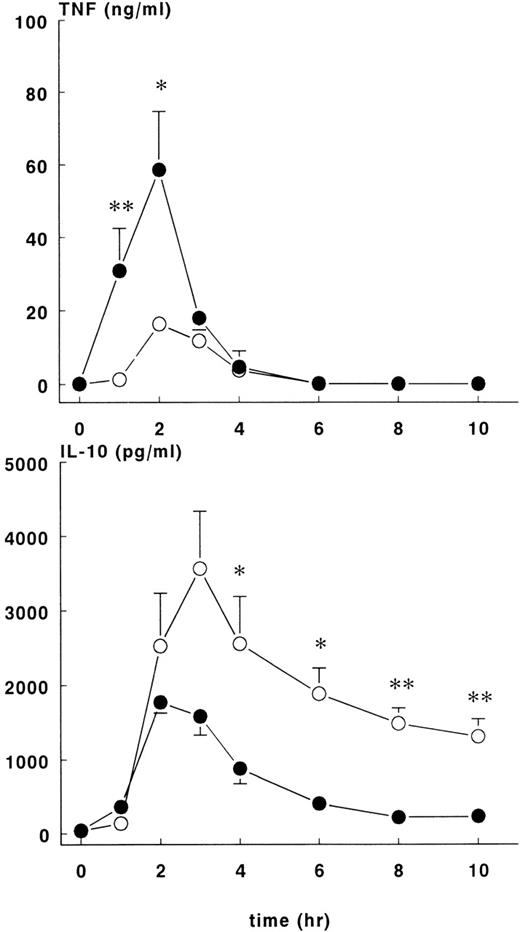
The administration of E coli was associated with changes in TNF, IL-10, IL-6, and IL-8 plasma concentrations that differed in magnitude and/or duration between the control and rhATIII treatment groups. In both groups of animals, there was a transient rise in plasma TNF concentrations, which peaked 2 hours after the onset ofE coli challenge and returned to baseline by the 6-hour time point (Figure 4, upper panel). However, the concentration-time data for these groups were not identical. Plasma TNF concentrations rose more rapidly and were greater in magnitude in the treatment group (58.6 ± 16.1 ng/mL) than in the controls (16.3 ± 2 ng/mL) at t = 2 hours (P < .05).
TNF and IL-10 levels in control and treatment groups.
Mean ± SEM plasma levels of TNF (upper panel) and IL-10 (lower panel) were measured upon lethal E coli infusion. The TNF response was significantly higher (P < .05) in the treatment group (•) compared with the control group (○). After 3 hours, levels of IL-10 were lower in the treatment group compared with the control group. *P < .05; and **P < .01.
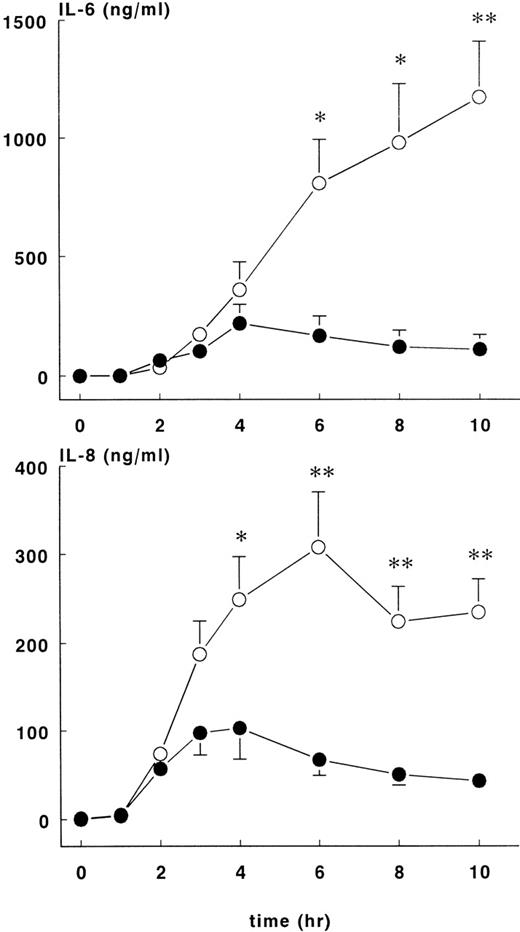
Increases in plasma IL-10 were noted in both groups in response to E coli challenge (Figure 4, lower panel), with peak values occurring 2 to 3 hours after the onset of sepsis: 1776 ± 148 pg/mL at 2 hours for the treatment group and 3566 ± 772 pg/mL at 3 hours for the control group. Plasma IL-10 concentrations were significantly higher for the control group compared with the treatment group (P < .01). Plasma IL-6 (Figure5, upper panel) values started to increase 2 hours after the onset of sepsis and continued to increase in both groups up until the 6-hour time point. At this juncture, IL-6 continued to rise in the control group (peak level of 1174 ± 236 ng/mL at 10 hours) but not in the treatment group (peak level of 220 ± 79 ng/mL at 4 hours), and significant differences in IL-6 concentrations were noted from this time point forward. Increased IL-8 and IL-6 plasma concentrations were first noted 2 hours after the onset of sepsis (Figure 5, lower panel). In both groups of animals, peak values of IL-8 were reached approximately 4 hours after the onset of sepsis: treatment group (103 ± 36 ng/mL) and control group (308 ± 62 ng/mL),P < .01.
IL-6 and IL-8 levels in control and treatment groups.
Mean ± SEM plasma levels of IL-6 (upper panel) and IL-8 (lower panel) in control (○) and rhATIII- treated (•) baboons. The differences between groups were significant after 4 hours. *P < .05; ** P < .01.
IL-6 and IL-8 levels in control and treatment groups.
Mean ± SEM plasma levels of IL-6 (upper panel) and IL-8 (lower panel) in control (○) and rhATIII- treated (•) baboons. The differences between groups were significant after 4 hours. *P < .05; ** P < .01.
Clotting and fibrinolytic responses
Increase in TAT complexes in plasma were noted 2 hours after induction of sepsis for both groups of animals. There were significantly more TAT complexes in the treatment group at 2 hours (1699 ± 410 ng/mL) and 3 hours (2952 ± 48 ng/mL) than in the control group at the same time points (223 ± 35 ng/mL and 964 ± 142 ng/mL, respectively), P < .01 (Figure3). Thereafter, TAT complexes were comparable in both groups and decreased over time.
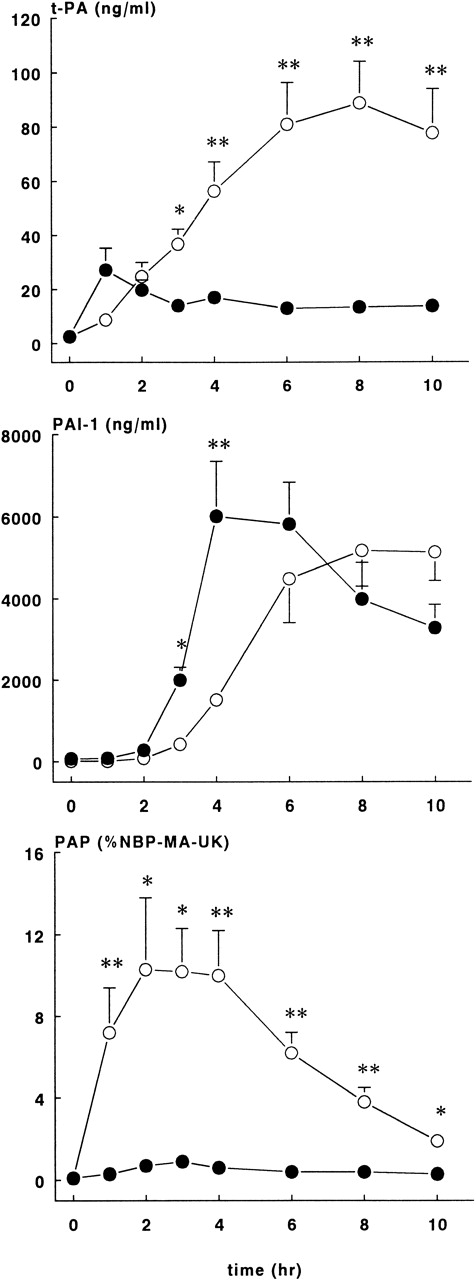
As shown in Figure 6, rhATIII infusions almost completely blocked the tPA response after the E coli challenge. In the treatment group, plasma concentrations reached plateau levels from 1 hour on, with the highest concentration being 27.2 ± 8.1 ng/mL. In contrast, tPA levels in the control group continuously increased, and they reached the highest concentration at 8 hours, 88.8 ± 15.2 ng/mL (P < .01).
Fibrinolytic response in control and treatment groups.
Mean ± SEM plasma levels of tPA (upper panel), PAI-1 (middle panel), and PAP complexes (lower panel) in control (○) and rhATIII-treated (•) baboons. PAP complexes are expressed as a percentage of NBP-MA-UK. tPA and PAP complex levels were significantly lower in the treatment group compared with controls, whereas PAI-1 levels were significantly higher in the treatment group compared with controls at 2 and 3 hours after the E coli infusion. *P < .05; **P < .01.
The appearance of PAI-1 in plasma was also different between the 2 study groups (Figure 6). PAI-1 levels in the ATIII group increased sharply after 2 hours, with peak concentrations of 6021 ± 1328 ng/mL at 4 hours, while the PAI-1 levels in the control group increased more slowly and reached the highest levels of 5180 ± 877 ng/mL at 8 hours (P < .01).
The most striking difference between the groups was observed in PAP complexes (Figure 6). The course in PAP complexes in the control baboons was as expected in this sepsis model, while in the rhATIII treatment group, the generation of PAP complexes was virtually abrogated (P < .01). Plasma concentrations were 10.3 ± 3.5% at 2 hours in the control group, whereas the highest values observed in the treatment group were 2.1 ± 0.4%.
Discussion
In the present study we show that rhATIII, just as plasma-derived ATIII, affords significant protection against the lethal effects of E coli in the baboon model. Supraphysiological levels of ATIII were achieved by preinfusion of rhATIII and maintained by repeated infusions. Maintenance of these levels was possibly necessary to afford protection against the lethal effects of E coli, as baboon No. 2, who did not receive the third rhATIII infusion, had the shortest survival time, although survival time was still longer than any in the control group. High doses of rhATIII attenuated the coagulation response to E coli challenge and, perhaps as importantly, attenuated the inflammatory response that sepsis induces. Both activities may be necessary to protect against lethality.
The dose of E coli administered to the rhATIII treatment group was slightly less than that administered to controls. However, this dose was above the LD100 and therefore expected to induce 100% lethality in baboons. The difference in circulating E coli organisms after 2 hours postinduction can reflect either differences in amounts inoculated or an effect of rhATIII on E coli clearance. As was shown in a previous study,3 plasma-derived ATIII also enhanced the clearance of the E coli organisms from the circulation in this baboon model, although this effect was less than that observed for rhATIII in the present study. Enhanced clearance of E coli from the circulation was also observed with a monoclonal antibody against factor XII in this same model of E coli–induced lethality in baboons.13
Unexpectedly, a rise in WBC count was observed following the first infusion of rhATIII. This suggests that either an inflammatory reaction was induced by the rhATIII preparation or there was a demarginating effect on the marginal pool of neutrophils. A follow-up study in noninfected baboons, which evaluated the effect of rhATIII dose on WBC and neutrophil counts, indicated that the administration vehicle alone, containing sodium chloride, sodium citrate, and glycine, pH 7.4, was all that was required to induce increases in these parameters (data not shown). After the E coli infusion, the WBC count decreased equally in both groups, and no significant differences in clinical, biochemical, or hematological markers were observed. The only measurable difference was in body temperature. Because animals were kept warm with a heating pad during anesthesia, the biological significance of this finding is not known.
Administration of rhATIII had a significant impact on the coagulatory response to E coli challenge. TAT complexes formed more rapidly in the treatment group and reached significantly higher concentrations at earlier time points. The more rapid inhibition of thrombin at early time points may have had an impact on fibrinogen consumption in the rhATIII treatment group. In this group, fibrinogen consumption was significantly attenuated relative to controls, and levels did not drop below 40% of baseline. In controls, fibrinogen levels plummeted to <10% starting values by the 6-hour time point. The protective effect of rhATIII on fibrinogen consumption was similar to that noted for plasma-derived ATIII and consistent with the ability of rhATIII to prevent DIC.3
Treatment with rhATIII in lethal septic baboons had a clear inhibitory effect on fibrinolysis. In particular, its effects on the course of tPA was striking: After an immediate rise, as is normally observed in this model, tPA levels in the treatment group decreased but remained slightly elevated during the observation time. In accordance with the reduced tPA levels, PAP complexes were not formed, while PAI-1 peak levels were mainly unaffected. The particular course of tPA appearance in plasma has not been observed by other interventions, such as administration of C1 inhibitor, in the same E coli model.8 In general, TNF is thought to mediate the fibrinolytic response after E coli challenge, although this consideration is based on observations in low-grade endotoxemia models.5 Since TNF levels were higher in the rhATIII group than in the control group, this cannot explain the observed lack in tPA response. The main source of tPA is probably the endothelium. Stimuli for its release are venous occlusion as well as vasoactive substances like bradykinin and vasopressin.16 However, these mechanisms for tPA release do not provide an explanation for the effect of rhATIII observed in the septic baboons. As it appears that a small fraction of ATIII is bound to glycosaminoglycans associated with the endothelial surface,1 we postulate that ATIII bound to the endothelial surface via heparin-like substances blocks tPA release.
In addition to attenuating the coagulation and fibrinolytic response, rhATIII directly or indirectly influenced the cytokine responses. The concentration of TNF was higher in the treatment group, whereas the IL-10, IL-6, and IL-8 concentrations were lower (Figures 4 and 5).
IL-10 is considered an anti-inflammatory cytokine with autoregulatory effects on pro-inflammatory cytokines such as TNF, IL-6 and IL-8.17 Thus, the enhanced release of TNF in the treatment group may have reflected the reduced release of IL-10 in this group. It is tempting to speculate that the diminished IL-10 response in the treatment group was due to the reduced number of circulating E coli organisms at 2 hours, since in a previous study, the IL-10 response was lower in a sublethal dose compared to a lethal dose ofE coli in a baboon model.18 Treatment with rhATIII markedly attenuated the release of the more distal cytokines IL-6 and IL-8. Four hours after the E coli infusion increased, IL-6 and IL-8 levels were abrogated, and concentrations nearly returned to baseline values at 10 hours. This is the first study reporting such anti-inflammatory effects of ATIII. The mechanism behind this effect is poorly understood. An earlier study had shown that the release of IL-6 in the baboon model is mediated by TNF.19In the present study we observed increased levels of TNF without increased IL-6. Thus, TNF did not appear to exert its expected biological effect on IL-6 up-regulation.
The interaction of ATIII with endothelium may be the key to the ability of ATIII to promote survival. In a sublethal porcine model of endotoxin-induced DIC, administration of a purified ATIII heparin complex prevented development of DIC but failed to significantly influence survival.20 In contrast, administrations of ATIII alone in several animal sepsis models did show a positive effect on survival.3,21,22 Because rhATIII binds strongly to heparin, it is also likely to bind strongly to the endothelium via cell surface heparin sulfate proteoglycans.6 Although the mechanism of action has not been deciphered, it has been shown that ATIII promotes endothelial release of prostacyclin, which may be the key to modulating the inflammatory response.23
In conclusion, we propose that the early administration of high doses of rhATIII, through the combined anticoagulation and anti-inflammatory effects of this therapy, improves the outcome in baboons lethally challenged with E coli. The direct binding of ATIII to endothelium may be key to this dual activity.
Acknowledgments
The authors would like to thank G. Peer and D. Carey for their excellent technical assistance with the E coli baboon model.
Reprints:M. C. Minnema, CLB, Sanquin, PO Box 9190, 1006 AD, Amsterdam, The Netherlands; email: muntar@db.nl.
The publication costs of this article were defrayed in part by page charge payment. Therefore, and solely to indicate this fact, this article is hereby marked “advertisement” in accordance with 18 U.S.C. section 1734.

This feature is available to Subscribers Only
Sign In or Create an Account Close Modal