The recently proposed World Health Organization (WHO) classification of hematologic malignancies attempted to integrate morphologic, clinical, immunophenotypic, and genetic features in defining disease entities. One of the major changes proposed by this classification is to lower the blast count for acute myeloid leukemia (AML) from 30% to 20%, thereby eliminating the previously recognized entity of refractory anemia with excess blasts in transformation (RAEB-T). WHO indicated that the reason for eliminating the RAEB-T entity is the fact that the survival of these patients is not significantly different from those with AML.
While we were among the first to point out that response to chemotherapy was independent of the distinction between AML, RAEB-T, and refractory anemia with excess blasts (RAEB),2 after accounting for features such as poor prognosis cytogenetics and older age which are more frequent in MDS and while we recognize that the 30% (or 20%) cutoff is arbitrary, we believe that consideration should be given to retaining RAEB-T as a specific entity. In particular, we believe that while response to therapy is a highly important criterion in a classification system, biologic features also need to be included. Therapies may change, but “biology” is invariant. Here we present data suggesting that the biology of RAEB-T more resembles that of refractory anemia (RA), refractory anemia with ringed sideroblasts (RARS), and RAEB (“other MDS”) than that of AML. Some of this has been previously noted, such as the frequency of particular cytogenetic abnormalities and duration of abnormal blood accounts in RAEB-T versus AML.2
In order to investigate other biologic features, we compared patients in our database who were enrolled on clinical protocols at M. D. Anderson Cancer Center from the beginning of 1994 to the end of 1998, including 142 patients with RAEB-T, 106 patients with “other MDS” (RA, RAEB, and RARS), and 514 patients with AML.
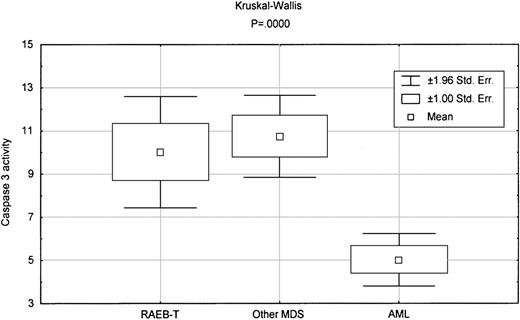
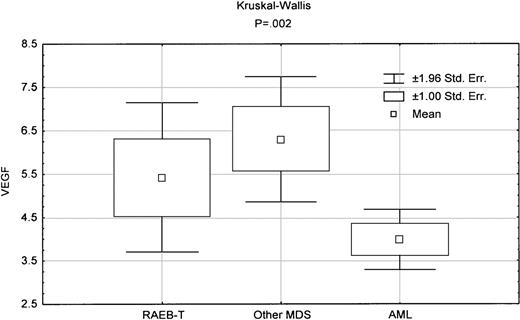
MDS is distinguished from AML by a significant increase in apoptosis,3,4 as assessed by caspase 3 activity measured using a tetrapeptide Ac-DEVD-pNA (Calbiochem, San Diego, CA).5 When we compared caspase 3 activity in RAEB-T with that in AML, there was significantly higher activity in RAEB-T (P = .0001). By contrast, there was no significant difference in caspase 3 activity between other MDS and RAEB-T (Figure1). Of note, there was no overlap between AML and RAEB-T or other MDS in caspase 3 activity, whereas there was complete overlap between RAEB-T and other MDS. In addition, PCNA levels, which reflect proliferation, were significantly higher in RAEB-T than in AML (Table 1) (P = .008).5 By contrast, there was no significant difference between MDS and RAEB-T in PCNA levels (Table 2). Intracellular vascular endothelial growth factor (VEGF) levels in RAEB-T, which we reported to have prognostic value in AML,8 were significantly different from those in AML (P = .04) but not from those in other MDS (Figure2, Tables 1 and 2).
Box-plot comparing caspase 3 activity between various diseases.
The indicated P reflects the Kruskal-Wallis test in comparing the 3 groups.
Box-plot comparing caspase 3 activity between various diseases.
The indicated P reflects the Kruskal-Wallis test in comparing the 3 groups.
Comparison of RAEB-T with AML
| . | RAEB-T median (range) . | AML . | P . |
|---|---|---|---|
| Caspase 3 activity* | 7.87 (0-26) | 1.94 (0-26) | .0001 |
| PCNA* | 3.35 (.98-7.88) | 1.92 (.74-17.28) | .008 |
| Age | 61.5 (19-84) | 59.5 (16-87) | NS |
| AHD | 1 (0-1000) | 0 (0-168) | .0001 |
| B2M | 2.4 (1-8.10) | 2.6 (0-31) | NS |
| PLT | 38.5 (1-471) | 49 (3-2292) | .017 |
| HGB | 7.7 (3.6-15.1) | 7.8 (2.8-15) | NS |
| VEGF* | 4 (1-15) | 3 (5-15) | .04 |
| BM cellularity | 65 (5-100) | 75 (5-100) | .05 |
| Poor cytogenetics (−5,−7,11q23,+8) | 50% | 35% | .001 |
| Therapy-related | 27% | 15% | .011 |
The values of caspase 3 activity, PCNA, and VEGF represent folds of the mean level observed in 12 normal control bone marrows, which is assigned a value of 1.
Comparison of RAEB-T with other MDS
| . | RAEB-T median (range) . | Other MDS . | P . |
|---|---|---|---|
| Caspase 3 activity* | 7.87 (0-26) | 9.25 (0-38.49) | NS |
| PCNA* | 3.35 (.98-7.88) | 3.08 (.73-12.21) | NS |
| Age | 61.5 (19-84) | 65 (21-82) | NS |
| AHD | 1 (0-1000) | 3 (0-96) | .01 |
| B2M | 2.4 (1-8.10) | 2.5 (.8-5.8) | NS |
| PLT | 38.5 (1-471) | 41 (2-184.0) | NS |
| HGB | 7.7 (3.6-15.1) | 7.8 (4.4-12.4) | NS |
| VEGF* | 4 (1-15) | 6.5 (2.5-10.3) | NS |
| BM cellularity | 65 (5-100) | 50 (5-100) | .005 |
| Poor cytogenetics (−5,−7,11q23,+8) | 50% | 53% | NS |
| Therapy-related | 27% | 35% | NS |
The values of caspase 3 activity, PCNA, and VEGF represent folds of the mean level observed in 12 normal control bone marrows, which is assigned a value of 1.
Box-plot comparing VEGF levels between various diseases.
The indicated P reflects the Kruskal-Wallis test in comparing the 3 groups.
Box-plot comparing VEGF levels between various diseases.
The indicated P reflects the Kruskal-Wallis test in comparing the 3 groups.
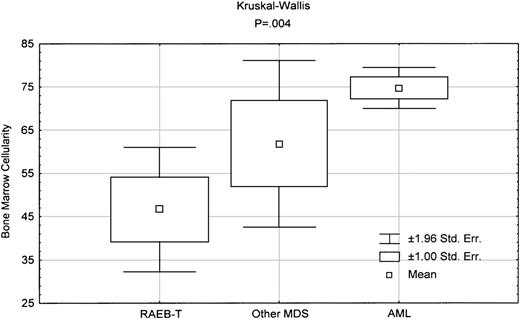
Upon examining other clinical characteristics as shown in Tables 1 and 2, clearly there is significant difference between AML and RAEB-T in the presence of antecedent hematologic diseases (AHD), platelet count, bone marrow cellularity, and the incidence of poor-prognosis cytogenetics (Table 1). In addition, RAEB-T disease was significantly more likely to be therapy-related than AML. By contrast, comparison of RAEB-T with MDS shows no difference between the 2 groups in any of the clinical parameters, except for AHD and bone marrow cellularity. In fact, as shown in Figure3, bone marrow cellularity in RAEB-T is lower than that in other MDS and AML.
Box-plot comparing bone marrow cellularity between various diseases.
The indicated P reflects the Kruskal-Wallis test in comparing the 3 groups.
Box-plot comparing bone marrow cellularity between various diseases.
The indicated P reflects the Kruskal-Wallis test in comparing the 3 groups.
The data presented here suggest that biologically RAEB-T is more likely to be an advanced stage of MDS and that it appears different from AML. Of course, there are other biologic characteristics that we have not examined. Furthermore, it is possible that high caspase 3 activity is dependent not so much on RAEB-T/ other MDS grouping as on other features. Nevertheless, we believe our data suggest that there is sufficient biologic distinction between AML and RAEB-T to warrant retaining the latter as a separate entity.


This feature is available to Subscribers Only
Sign In or Create an Account Close Modal