Abstract
Egr-1 is a transcription factor that couples short-term changes in the extracellular milieu to long-term changes in gene expression. In cultured endothelial cells, the Egr-1 gene has been shown to respond to a variety of extracellular signals. However, the physiological relevance of these findings remains unclear. To address this question, the growth factor-mediated response of the Egr-1 gene under in vivo conditions was analyzed. To that end, either vascular endothelial growth factor (VEGF) or epidermal growth factor (EGF) was injected into the intraperitoneal cavity of mice. Growth factors were delivered to all tissues examined, as evidenced by the widespread distribution of I125-labeled growth factors and the phosphorylation of their respective receptors. In Western blot analyses of whole-tissue extracts, Egr-1 protein levels were shown to be induced in the heart, brain, liver, and spleen of VEGF-treated mice, and in the heart, lung, brain, liver and skeletal muscle of EGF-treated animals. Changes in Egr-1 levels did not correlate with changes in receptor phosphorylation or ERK1/2 phosphorylation. In Northern blot analyses, VEGF induced Egr-1 mRNA levels in all tissues examined except lung and kidney, whereas EGF led to increased transcripts in all tissues except kidney. In immunofluorescence studies, VEGF induced Egr-1 in microvascular endothelial cells of the heart and liver, and EGF induced Egr-1 in the microvascular bed of skeletal muscle. Taken together, these results suggest that the Egr-1 gene is differentially regulated in response to systemically administered VEGF and EGF.
Introduction
Egr-1 (also designated zif268,TIS 8, NFGI-A, Krox 24) is a member of the immediate-early gene family that includes FOS, JUN, and early growth response genes.1-7 Egr-1 encodes a zinc finger-containing DNA-binding protein in many cell types and is up-regulated in response to a wide variety of mitogenic and nonmitogenic stimuli, including peptide growth factors, shear stress, urea, and hypotonicity.8-15 Once activated, Egr-1 binds to 5′-GCG(G/T)GGGCG-3′ consensus sequences within the promoter region of target genes, resulting in transcriptional activation or repression.
Within the endothelium, the Egr-1 gene may play a role in mediating environmentally responsive gene expression. In cultured endothelial cells, for example, Egr-1 has been reported to be activated by acidic fibroblast growth factor (aFGF), basic fibroblast growth factor (bFGF), vascular endothelial growth factor (VEGF), and shear stress.16-20 In turn, the Egr-1 transcription factor induces the expression of a wide range of target genes, including platelet-derived growth factor (PDGF)-A, PDGF-B, tissue factor, transforming growth factor-β, and urokinase-type plasminogen activator.21 22
A well-recognized feature of the endothelium is its remarkable diversity of cell structure and function.23-25 Phenotypic heterogeneity represents an adaptive response to the unique demands of the underlying tissue and is mediated largely by environmentally responsive gene programs. Once endothelial cells are removed from their native environment and grown in tissue culture, they are uncoupled from critical extracellular cues and undergo phenotypic drift. During this process, transcriptional control mechanisms change in ways that are difficult to account for. Therefore, in vitro-derived results must be interpreted with caution and confirmed in the context of the cell's native environment.
The overall goal of the current study was to develop an in vivo system for studying growth factor-mediated regulation of Egr-1. We show that intraperitoneally administered VEGF and epidermal growth factor (EGF) are systemically delivered to multiple organs of the mouse, result in widespread phosphorylation of growth factor receptors, and induce Egr-1 expression in different vascular beds. These results suggest that the Egr-1 transcription factor is differentially regulated in the intact endothelium.
Materials and methods
Animals
Female FVB mice (age, 4 to 8 weeks; weight, 18 to 22 g) were obtained from Taconic (Germantown, NY). All protocols were approved by the Institutional Animal Care and Use Committee of the Beth Israel Deaconess Medical Center.
Injection of 125I-labeled growth factors
Five hundred thousand counts per minute (cpm) of I125-labeled VEGF or 125I-labeled EGF (NEN Life Science Products, Boston, MA) were mixed with unlabeled recombinant human VEGF165 (0.5 μg/g body weight) (a generous gift of Michael Simons, Beth Israel Deaconess Medical Center, Boston, MA) or unlabeled recombinant human EGF (1.0 μg/g body weight) (PeproTech, Rocky Hill, NJ), respectively, in a total volume of 300 μL. The resultant mixture was injected into the peritoneum of 4- week-old female FVB mice. The animals were killed 10 minutes, 30 minutes, 60 minutes, 120 minutes, and 240 minutes later. Blood was removed by cardiac puncture. The organs were then harvested, rinsed in phosphate-buffered saline (PBS), and weighed. Radioactivity was measured by gamma spectrometry (Auto-Gamma Counting System, Packard Instrument, Meriden, CT); cpm were corrected for tissue weight.
Injection of unlabeled growth factors
Mice were injected intraperitoneally with VEGF (1.0 μg/g body weight), EGF (2.0 μg/g body weight), or 0.9% normal saline in a total volume of 300 μL. Animals were killed 5 minutes, 10 minutes, 1 hour, 2 hours, and 4 hours later, and the tissues were harvested for protein or RNA extracts. Alternatively, mice injected with VEGF or EGF were perfused at 1 hour with 2% paraformaldehyde, and the organs were processed for cryosection as previously described.26
Western blot analyses of Egr-1 and phosphorylated ERK1/2
For whole-organ protein extracts, tissues were harvested from mice, washed twice with cold PBS, and homogenized in ice-cold lysis buffer containing 20 mmol/L HEPES, pH 7.5, 150 mmol/L NaCl, 1% NP-40, 0.1% SDS, 1 mmol/L EDTA, 50 mmol/L sodium fluoride, 2 mmol/L sodium vanadate, 1 mmol/L dithiothreitol, 0.5 mmol/L phenylmethylsulfonyl fluoride, and a protease inhibitor cocktail (Boehringer Mannheim, Mannheim, Germany). The resultant lysates were incubated on ice for 2 hours and then centrifuged at 10 000g for 20 minutes at 4°C. The supernatants were saved as tissue protein extracts. Protein quantitation was carried out with the microprotein determination system (Sigma, St. Louis, MO).
For Western blot analyses of Egr-1 and phospho-ERK1/2, 40 μg protein extract was separated by 10% SDS-PAGE and electrotransferred to nitrocellulose membranes (Bio-Rad Laboratories, Hercules, CA). Membranes were blocked with 5% nonfat dry milk in Tris-buffered saline with 0.1% Tween 20 for 1 hour at room temperature. The membrane was then incubated with a primary rabbit polyclonal anti-Egr-1 antibody (1:1000 dilution) (Santa Cruz Biotechnology, Santa Cruz, CA) or phospho-p44/42 MAPK polyclonal antibody (New England Biolabs, Beverly, MA) overnight at 4°C, followed by secondary antibody goat antirabbit horseradish peroxidase conjugate (1:1000 dilution) (Pierce, Rockford, IL) for 1 hour at room temperature. Peroxidase activity was visualized with an enhanced chemiluminescence substrate system (NEN Life Science Products). The phospho-ERK1/2-probed membrane was subsequently stripped and incubated with an anti-ERK-2 antibody (Transduction Laboratories, Lexington, KY).
Immunoprecipitation of Flk-1 and the EGF receptor
Protein extracts from tissues were prepared as described above. One milligram protein from VEGF-treated mice was incubated with 4 μg anti-phosphotyrosine PY20 (Transduction Laboratories), whereas 1 mg protein from EGF-treated mice was incubated with 3 μg polyclonal anti-EGF-R IgG (Santa Cruz Biotechnology) overnight at 4°C. The next day, 40 μL protein A/G plus–agarose (Santa Cruz Biotechnology) was added to the mixture, incubated for 1 hour at 4°C, and centrifuged. The beads were washed 4 times with protein lysis buffer. Immunoprecipitated proteins were eluted by boiling in PAGE sample buffer, separated by 7.5% SDS-PAGE, and processed for Western blot analysis. For detection of tyrosine phosphorylated Flk-1, the blot was probed with primary polyclonal anti-Flk-1 antibody (1:1000; Santa Cruz Biotechnology) for 2 hours at room temperature. For the detection of tyrosine phosphorylated EGF-R, the blot was probed with primary monoclonal anti-phosphotyrosine antibody (1:1000; Upstate Biotechnology, Lake Placid, NY) for 2 hours at room temperature. IgG bands were visualized as a control for gel loading.
Northern blot analyses
Ten micrograms total RNA was loaded on a 0.7% formaldehyde-containing agarose gel. The RNA was transferred to nylon membrane, covalently cross-linked with UV radiation, prehybridized for 6 hours, and hybridized for 18 hours at 42°C with a [32P]dCTP-labeled cDNA probe containing murine Egr-1 sequence (a generous gift from Vikas Sukhatme, Beth Israel Deaconess Medical Center, Boston, MA). The membranes were subsequently stripped and probed with a radiolabeled 18S-ribosome probe.
Immunofluorescence studies
Frozen tissue sections were fixed and coincubated with a rat monoclonal anti-CD31 antibody (1:200 dilution) (Pharmingen, San Diego, CA) and either a rabbit polyclonal anti-Egr-1 antibody (1:100 dilution) (Santa Cruz Biotechnology), a rabbit polyclonal anti-EGF-R antibody (1:100 dilution) (Santa Cruz Biotechnology), or a rabbit anti-Flk-1 antibody (1:100 dilution) (Santa Cruz Biotechnology) for 60 minutes at room temperature. Sections were washed 3 times in PBS and incubated with Cy3-conjugated goat antirabbit IgG (1:50 dilution) (Zymed Lab, San Francisco, CA) and fluorescein isothiocyanate (FITC)-conjugated goat antirat IgG (1:50 dilution) (Vector Laboratories, Burlingame, CA) for 30 minutes at room temperature. After extensive washing in PBS, slides were mounted with DAPI/Antifade (Oncor, Gaithersburg, MD). In negative controls, the primary antibodies were omitted from the above procedure. Confocal images were obtained with a Bio-Rad MRC 1024 confocal laser-scanning microscope (Bio-Rad Laboratories).
Results
Intraperitoneal injections of VEGF and EGF result in systemic growth factor delivery
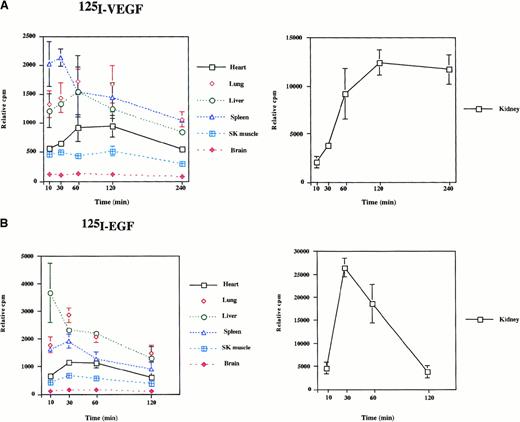
To determine the biodistribution of intraperitoneally delivered growth factors, 125I-labeled VEGF or EGF was administered to mice. Mice were killed at 10 minutes, 30 minutes, 60 minutes, 120 minutes, and 240 minutes after the injections, and radioactivity of the organs was measured by gamma spectrometry. As shown in Figure1, significant radioactivity (expressed as cpm/g tissue weight) was detected in all organs examined. In VEGF-treated animals, radioactivity peaked in the spleen at 30 minutes and in most other tissues at 60 minutes (Figure 1A). The level of radioactivity between 60 minutes and 240 minutes was highest in the kidney, lung, spleen, and liver and lowest in the heart, skeletal muscle, and brain. In response to EGF administration, radioactivity peaked in the liver at 10 minutes and in other tissues at 30 minutes (Figure 1B). The level of radioactivity between 30 minutes and 120 minutes was distributed in the following order: kidney > lung > liver > spleen > heart > skeletal muscle > brain. When comparing growth factor turnover in the VEGF- and EGF-treated mice, the most pronounced differences were found in the kidney. In EGF-treated mice, radioactivity peaked early (30 minutes) and subsequently tapered off, whereas 125I levels peaked later (2 to 4 hours) in the VEGF-injected mice. These findings suggest that EGF is cleared more rapidly by the kidney than is VEGF. In summary, the 125I-labeled growth factor studies suggest that intraperitoneally delivered VEGF and EGF are systemically distributed to the organs of the mouse.
Radioactivity in mouse tissues after the intraperitoneal injection of 125I-EGF and 125I-VEGF.
A total of 500 000 cpm 125I-VEGF (A) or125I-EGF (B) was injected into the intraperitoneal cavity of mice. Organs were harvested at the times indicated, and radioactivity was measured by gamma spectrometry. Each data point represents the mean and range of results from 2 animals. Radioactivity is expressed as cpm relative to organ weight.
Intraperitoneal injections of VEGF and EGF result in widespread receptor phosphorylation
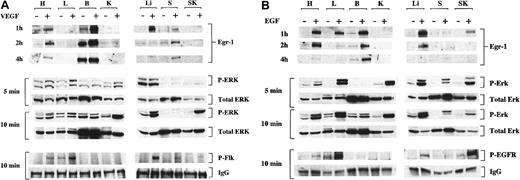
Our next goal was to show that the systemically delivered growth factors resulted in phosphorylation of their corresponding receptors. To that end, mice were injected with either VEGF (1 μg/g body weight), EGF (2 μg/g body weight), or normal saline. After VEGF treatment, protein extracts from various organs were immunoprecipitated with the anti-phosphotyrosine antibody and probed with an anti-Flk-1-antibody. After EGF treatment, tissue protein extracts were immunoprecipitated with anti-EGF receptor antibody and subsequently immunoblotted with an anti-phosphotyrosine antibody. As shown in Figure2, the administration of VEGF induced phosphorylation of Flk-1 in all organs except the brain and kidney, whereas the administration of EGF induced phosphorylation of the EGF-R in all tissues but the kidney. Together with the125I-growth factor studies, these findings support the use of the intraperitoneal route as a tool to study the systemic effects of VEGF and EGF.
Phosphorylation of EGF-R, Flk-1 and ERK1/2 and induction of Egr-1 protein after intraperitoneal injections of VEGF and EGF.
Mice received intraperitoneal injections of VEGF (A), EGF (B), or normal saline (A, B). Tissues were processed at 5 minutes, 10 minutes, or both for Western blot analysis of phosphorylated Flk-1 (P-Flk), EGF-R (P-EGFR), and ERK1/2 (P-ERK), as described in “Materials and methods.” Levels of phosphorylated ERK1/2 are compared with total ERK2 (total ERK), whereas levels of phosphorylated receptor are compared to IgG. A lower band that appears in some lanes of the P-EGF-R blot is nonspecific. Tissues were harvested from growth factor-treated mice at 1 hour, 2 hours, and 4 hours and were processed for Western blot analyses of Egr-1 in the heart (H), lung (L), brain (B), kidney (K), liver (Li), spleen (S), and skeletal muscle (SK). +, growth factor-treated mice; −, normal saline-treated mice.
Egr-1 protein levels are induced in different organs by VEGF and EGF
To study the effects of VEGF and EGF on Egr-1 expression in vivo, mice were injected with VEGF (1.0 μg/g body weight), EGF (2.0 μg/g body weight), or normal saline. Tissues were harvested for total protein 1 hour, 2 hours, and 4 hours after injection, and Egr-1 was detected by Western blot analysis. In control mice, Egr-1 protein was detectable in the brain and, to a lesser extent, in the heart and spleen (Figure 2A-B). At 1 hour, VEGF induced Egr-1 protein levels 2.6-fold in the heart, 2.6-fold in the brain, 14.8-fold, in the liver, and 2.3-fold in the spleen (Figure 2A). VEGF did not result in increased Egr-1 protein in the lung or skeletal muscle. At 1 hour, EGF induced Egr-1 protein levels 5.1-fold in the heart, 3.1-fold in the lung, 3.4-fold in the brain, 6.1-fold in the liver, and 3-fold in skeletal muscle (Figure 2B). EGF did not induce Egr-1 protein in the spleen. The level of VEGF- and EGF-mediated induction of Egr-1 was lower at 2 and 4 hours. These results demonstrate that systemically delivered growth factors are associated with distinct patterns of Egr-1 induction in vivo.
VEGF- and EGF-mediated phosphorylation of ERK1/2 does not correlate with Egr-1 induction
In previous in vitro studies, the induction of the Egr-1 gene has been linked to MAPK activation. To determine whether the up-regulation of Egr-1 was similarly coupled to the MAPK pathway in vivo, the effect of the growth factors on ERK1/2 phosphorylation was studied. At 5 minutes and 10 minutes after the injection of VEGF or EGF, the ratio of phospho-ERK1/2 to total ERK protein was significantly elevated in all tissues except the brain (Figure 2A-B). In general, the level of induction was higher in the EGF-treated mice. The growth factor-mediated changes in ERK phosphorylation did not always correlate with Egr-1 induction. For example, in the kidney and spleen of EGF-treated mice, there was significant induction of ERK1/2 phosphorylation with little or no changes in Egr-1 levels. In the brain of VEGF- and EGF-treated mice, Egr-1 levels were increased in the absence of significant changes in ERK1/2 phosphorylation. Taken together, these results suggest that growth factor-mediated induction of Egr-1 is not tightly coupled to MAPK activation at the level of the whole organ.
Egr-1 mRNA levels are induced in different organs by VEGF and EGF
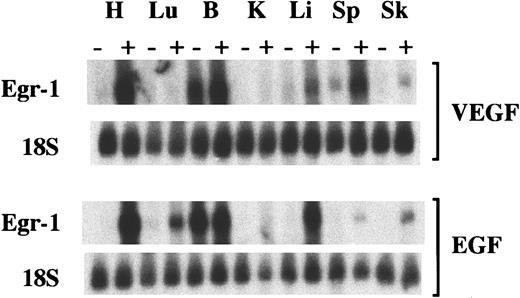
To determine the response of Egr-1 mRNA to VEGF and EGF, Northern blot analyses were performed. At 1 hour, VEGF induced Egr-1 mRNA by 6.8-fold in the heart, 1.2-fold in the brain, 2.8-fold in the liver, 3.6-fold in the spleen, and 2-fold in the skeletal muscle, but it did not increase Egr-1 mRNA in the lung or kidney (Figure3). At 1 hour, EGF induced Egr-1 mRNA by 16-fold in the heart, 3.3-fold in the lung, 1.1-fold in the brain, 7.5-fold in the liver, 1.4-fold in the spleen, and 12-fold in the skeletal muscle (Figure 3), but it did not induce Egr-1 transcript levels in the kidney. The small increase in Egr-1 mRNA in VEGF-treated skeletal muscle contrasted with the consistent absence of detectable protein in Western blot analyses and immunohistochemical assays (see below). This discordance notwithstanding, the results of the Northern blot analyses support the notion that the Egr-1 gene is induced at different levels in different tissues and that the degree of induction does not correlate with either receptor phosphorylation or ERK1/2 phosphorylation.
Induction of Egr-1 mRNA after intraperitoneal injections of VEGF and EGF.
Mice received intraperitoneal injections of VEGF, EGF, or normal saline. Tissues were processed 1 hour later for Northern blot analysis of Egr-1 and 18S ribosome in the heart (H), lung (Lu), brain (B), kidney (K), liver (Li), spleen (Sp), and skeletal muscle (Sk). +, growth factor-treated mice; −, normal saline-treated mice.
VEGF and EGF induce Egr-1 in different vascular beds
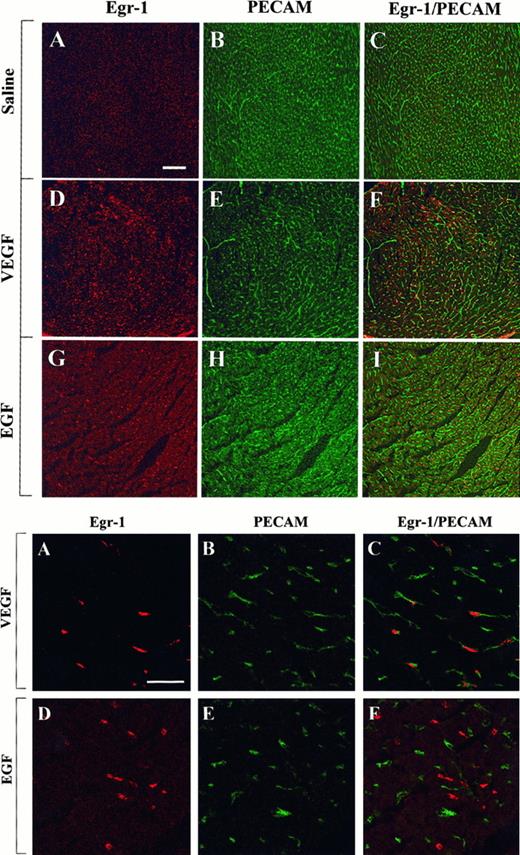
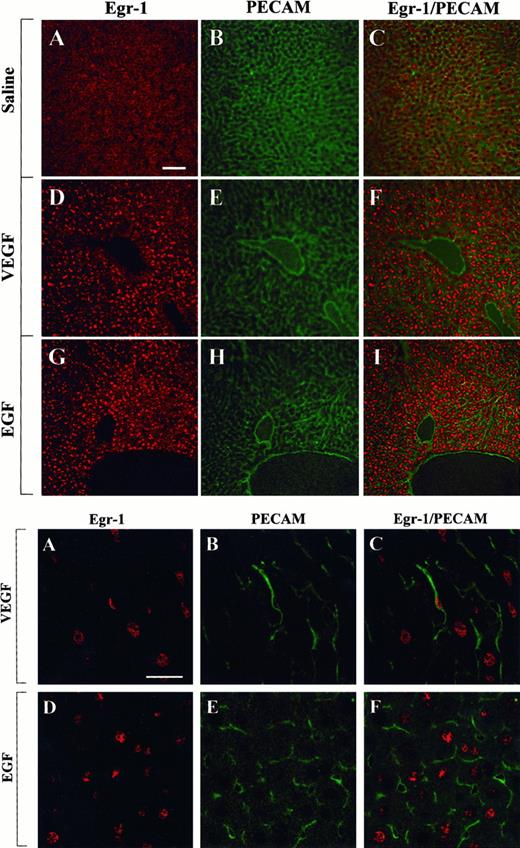
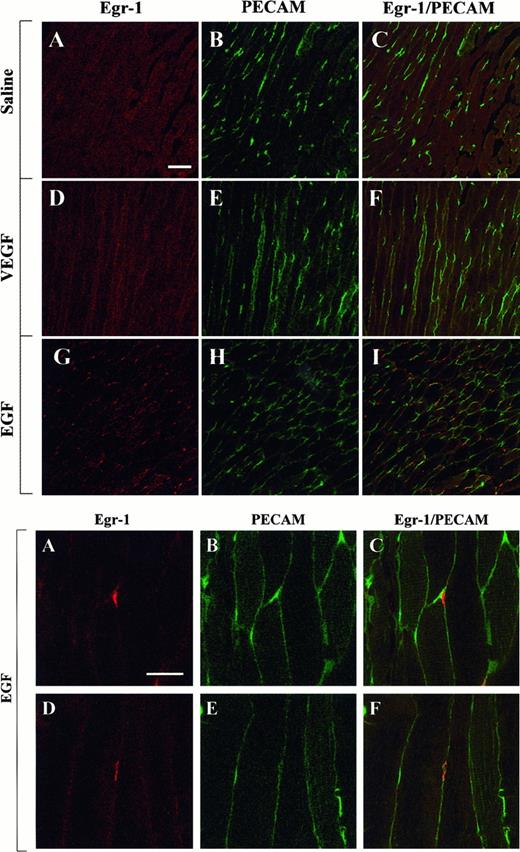
The above studies were designed to measure growth factor-mediated changes in Egr-1 expression at the level of the whole tissue. To determine whether Egr-1 was induced in endothelial cells, tissue sections from the heart, liver, and skeletal muscle of VEGF-, EGF-, and normal saline-treated mice were processed for immunofluorescence detection of Egr-1 and PECAM. As shown in Figure4, the administration of VEGF resulted in increased Egr-1 expression in PECAM-positive cardiac microvascular endothelial cells. In EGF-treated animals, the Egr-1 gene product was up-regulated in PECAM-negative cells. These latter cells probably are cardiomyocytes. In the liver, VEGF treatment resulted in increased Egr-1 levels in both hepatocytes and sinusoidal endothelial cells, whereas EGF injections resulted in higher levels of Egr-1 in hepatocytes alone (Figure 5). Finally, in skeletal muscle, EGF-treatment induced Egr-1 expression in capillary endothelial cells, whereas VEGF had no such effect (Figure6).
Confocal microscopy and double immunostaining of Egr-1 and PECAM in the heart of VEGF- and EGF-treated mice.
Mice received intraperitoneal injections of normal saline, VEGF, or EGF. Hearts were removed 1 hour later. Tissue sections were double immunostained with a rabbit polyclonal anti-Egr-1 antibody and a rat monoclonal anti-CD31 antibody, washed in PBS, and incubated with Cy3-conjugated goat antirabbit IgG and FITC-conjugated goat antirat IgG. (Top) Low-power view of optical sections through the myocardium of a normal saline-treated animal (A-C), a VEGF-treated animal (D-F), and an EGF-treated animal (G-I). Egr-1 immunofluorescence is shown on the left (A, D, G), and PECAM immunofluorescence is shown in the middle (B, E, H). The 2 images are combined on the right (C, F, I). Bar, 100 μm. (Bottom) High-power view of optical sections through the myocardium of VEGF-treated animal (A-C) and EGF-treated animal (D-F). Egr-1 immunofluorescence is shown on the left (A, D), and PECAM immunofluorescence is shown in the middle (B, E). The 2 images are combined on the right (C, F). Bar, 25 μm.
Confocal microscopy and double immunostaining of Egr-1 and PECAM in the liver of VEGF- and EGF-treated mice.
Mice received intraperitoneal injections of normal saline, VEGF, or EGF. Livers were removed 1 hour later and processed for immunodetection of Egr-1 and PECAM, as described in Figure 4. (Top) Low-power view of optical sections through the liver of normal saline-treated animal (A-C), VEGF-treated animal (D-F), and EGF-treated animal (G-I). Egr-1 immunofluorescence is shown on the left (A, D, G), and PECAM immunofluorescence is shown in the middle (B, E, H). The 2 images are combined on the right (C, F, I). Bar, 100 μm. (Bottom) High-power view of optical sections through the liver of VEGF-treated animal (A-C) and EGF-treated animal (D-F). Egr-1 immunofluorescence is shown on the left (A, D), and PECAM immunofluorescence is shown in the middle (B, E). The 2 images are combined on the right (C, F). Bar, 25 μm.
Confocal microscopy and double immunostaining of Egr-1 and PECAM in the skeletal muscle of VEGF- and EGF-treated mice.
Mice received intraperitoneal injections of normal saline, VEGF, or EGF. The thigh muscle was removed 1 hour later and processed for immunodetection of Egr-1 and PECAM, as described in Figure 4. (Top) Low-power view of optical sections through the skeletal muscle of normal saline-treated animal (A-C), VEGF-treated animal (D-F), and EGF-treated animal (G-I). Egr-1 immunofluorescence is shown on the left (A, D, G), and PECAM immunofluorescence is shown in the middle (B, E, H). The 2 images are combined on the right (C, F, I). Bar, 100 μm. (Bottom) High-power view of optical sections through the skeletal muscle of EGF-treated animals. Egr-1 immunofluorescence is shown on the left (A, D), and PECAM immunofluorescence is shown in the middle (B, E). The 2 images are combined on the right (C, F). Bar, 25 μm.
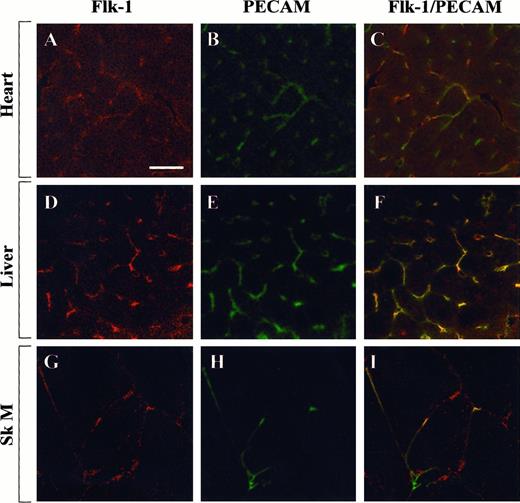
To test whether the observed differences in Egr-1 regulation were caused by differential distribution of growth factor receptors, tissue sections from the heart, liver, and skeletal muscle were examined for the expression of Flk-1 and EGF-R. In immunofluorescence studies, Flk-1 was shown to be expressed within a subset of endothelial cells in the heart, liver, and skeletal muscle (Figure7). By contrast, EGF-R was detected in myocytes of the heart, in hepatocytes and endothelial cells of the liver, and in a few microvascular endothelial cells of the skeletal muscle (Figure 8). These findings suggest that the presence of Flk-1, EGF-R, or both is necessary but not sufficient for growth factor-mediated induction of Egr-1.
Confocal microscopy and double immunostaining of Flk-1 and PECAM in mouse tissues.
Tissue sections from control mice were processed for immunodetection of Flk-1 and PECAM. High-power view of optical sections through the heart (A-C), liver (D-F), and skeletal muscle (G-I). Flk-1 immunofluorescence is shown on the left (A, D, G), and PECAM immunofluorescence is shown in the middle (B, E, H). The 2 images are combined on the right (C, F, I). Bar, 100 μm.
Confocal microscopy and double immunostaining of EGF-R and PECAM in mouse tissues.
Tissue sections from control mice were processed for immunodetection of EGF-R and PECAM. High-power view of optical sections through the heart (A-C), liver (D-F), and skeletal muscle (G-I). EGF-R immunofluorescence is shown on the left (A, D, G), and PECAM immunofluorescence is shown in the middle (B, E, H). The 2 images are combined on the right (C, F, I). Bar, 100 μm.
Discussion
There is a growing appreciation that endothelial cells display phenotypic heterogeneity.25 27 Although endothelial cells serve common roles in hemostasis, cellular and nutrient trafficking, and control of vasomotor tone, they do so according to the unique demands of the underlying tissue. Endothelial cells from different vascular beds express different sets of gene products. Moreover, cell type-specific patterns of gene expression are ultimately governed by environmentally responsive signal transduction networks. An understanding of the mechanisms by which these signals are transduced would provide an important framework for elucidating the molecular basis of endothelial cell heterogeneity.
Egr-1 is a transcription factor that couples short-term changes in the extracellular environment to long-term changes in gene expression. Egr-1 has been shown to be induced in cultured endothelial cells by bFGF, aFGF, and shear stress.16-19 In response to VEGF, Egr-1 rapidly accumulates in the nucleus and binds to its cognate binding site.20 In more recent studies (manuscript in preparation), we demonstrated that Egr-1 protein and mRNA levels are up-regulated in cultured endothelial cell types in the presence of VEGF and EGF. In the current report, we have extended these observations to the in vivo setting. Our findings confirm that endothelial expression of Egr-1 is induced by the systemic delivery of VEGF and EGF to the intact animal. Interestingly, the growth factor-mediated response was not uniform. Systemically administered VEGF led to increased Egr-1 levels in the microvascular endothelium of the liver and heart, and EGF resulted in Egr-1 induction in microvascular endothelial cells of skeletal muscle. These differences were not fully explained by the distribution of growth factor receptors. For example, the administration of VEGF failed to induce immunodetectable levels of Egr-1 in the microvascular bed of skeletal muscle, despite the presence of the Flk-1 receptor in a subset of these endothelial cells. Taken together, these results suggest that the Egr-1 gene is regulated by vascular bed-specific mechanisms.
Under in vitro conditions, Egr-1 is considered universally responsive to mitogenic stimuli such as growth factors and hormones.2Moreover, mitogenic stimulation of the Egr-1 gene has been shown to be mediated in many cell types by the MAPK signal transduction pathway.15,19 28-31 Based on these observations, one might predict that growth factor-mediated activation of the MAPK pathway in the intact animal would be tightly coupled to Egr-1 induction. However, the results of the current study demonstrate a distinct lack of correlation between ERK1/2 phosphorylation and Egr-1 up-regulation in vivo. In some organs, ERK1/2 phosphorylation may be necessary, but is insufficient, for up-regulation of the Egr-1 gene. For example, systemically administered VEGF resulted in increased ERK1/2 phosphorylation in the lung in the absence of detectable changes in Egr-1 protein and mRNA levels. In other organs, the MAPK pathway may play a less important role in mediating Egr-1 induction. This appears to be true in the spleen, in which there was a lack of correlation between VEGF- or EGF-mediated induction of Egr-1 and ERK1/2 phosphorylation. In certain tissues, Egr-1 appears to be regulated at a posttranscriptional level. For example, VEGF and EGF each induced Egr-1 protein in the brain without appreciable changes in the levels of ERK1/2 phosphorylation or Egr-1 mRNA. These latter results should be qualified in 2 important ways. First, the findings are derived from studies of whole-tissue extracts and may not necessarily reflect changes in endothelial cell populations. Second, the results support, but do not prove, a link between receptor phosphorylation, ERK1/2 phosphorylation, and Egr-1 expression.
Previous studies have supported the use of the intraperitoneal route to deliver growth factors in vivo. Intraperitoneally administered EGF was shown to increase MAPK activity in the liver of adult rats, to enhance nuclear protein phosphorylation in the liver of mice,32-34and to stimulate p85 kinase activity in multiple organs of mice.35 Intraperitoneal injections of insulin-like growth factor (IGF-1) in neonatal mice induced phosphorylation of the IGF-1 receptor in skeletal muscle and liver.36 Finally, intraperitoneal administration of 125I-labeled PDGF-AB in mice resulted in sustained serum levels of radioactivity for 2 to 4 hours.37 As far as we know, there are no previous reports describing the distribution of intraperitoneally delivered VEGF. Indeed, our results provide the first definitive evidence that this route of administration may be used to achieve systemic levels of both EGF and VEGF.
The intraperitoneal delivery system will provide a valuable tool for studying inducible gene expression in vivo. One priority will be to determine the extent to which growth factor-mediated changes in Egr-1 induce the expression of target genes, such as tissue factor and urokinase-type plasminogen activator. In addition, the delivery of growth factors to transgenic mice that harbor promoter–reporter gene constructs will facilitate the identification of environmentally responsive DNA regions under in vivo conditions. The growth factor delivery system will also be useful for analyzing differential activation of signal transduction pathways in different vascular beds. Finally, the intraperitoneal delivery route will provide a means to study the regulation of genes in other lineages, such as cardiomyocytes and hepatocytes.
Despite the important advantages of the growth factor delivery system, it also has inherent limitations. For one, the administration of large quantities of growth factors to mice is costly. It will be necessary to carry out dose–response studies to determine whether smaller doses of VEGF or EGF will have comparable effects on receptor-mediated signaling and Egr-1 expression. The second limitation is the difficulty in attributing changes in Egr-1 expression to a direct effect of the growth factor. Rapid phosphorylation of the growth factor receptors and MAPK pathways supports a primary effect of VEGF and EGF. However, it is conceivable that some of the observed changes are mediated by secondary signals. For example, hepatocytes do not express detectable levels of Flk-1 on the cell surface. It, therefore, seems likely that the VEGF-mediated induction of Egr-1 in these cells is mediated by factor(s) secreted by neighboring sinusoidal endothelial cells. Finally, it is hard to draw firm conclusions about the physiological relevance of growth factor-mediated gene expression. For example, the observation that Egr-1 is selectively induced in microvascular endothelial cells of the skeletal muscle by EGF does not prove that this growth factor mediates constitutive vascular bed-specific expression of Egr-1. These limitations notwithstanding, we believe that the growth factor delivery system represents a novel strategy for studying the molecular mechanisms of differential gene expression in vivo.
In summary, the results of the current study provide important insights about Egr-1 gene regulation. The findings suggest that the Egr-1 gene may be differentially regulated under in vivo conditions. Because the Egr-1 is an early growth response gene, these findings provide a potential link between extracellular signals and phenotypic expression. Indeed, as a barometer of the extracellular milieu, Egr-1 may serve to fine-tune expression according to the needs of the local environment. An important goal for future studies will be to determine whether the Egr-1 gene is responsible for mediating differential expression of target genes within the endothelium.
Supported by National Institutes of Health grant HL60585-01. J.C.T. is the recipient of a Judith Graham Pool Postgraduate Research Fellowship Award from the National Hemophilia Foundation. W.C.A. is the recipient of an American Society of Hematology Scholar Award.
The publication costs of this article were defrayed in part by page charge payment. Therefore, and solely to indicate this fact, this article is hereby marked “advertisement” in accordance with 18 U.S.C. section 1734.
References
Author notes
William C. Aird, Department of Molecular Medicine, Beth Israel Deaconess Medical Center, RW-663, 330 Brookline Ave, Boston, MA 02215; e-mail: waird@caregroup.harvard.edu.


This feature is available to Subscribers Only
Sign In or Create an Account Close Modal