Abstract
Lymphocyte-specific protein 1, recently renamed leukocyte-specific protein 1 (LSP1), is an F-actin binding protein expressed in lymphocytes, macrophages, and neutrophils in mice and humans. This study examines LSP1-deficient (Lsp1−/−) mice for the development of myeloid and lymphocytic cell populations and their response to the development of peritonitis induced by thioglycollate (TG) and to a T-dependent antigen.Lsp1−/− mice exhibit significantly higher levels of resident macrophages in the peritoneum compared to wild-type (wt) mice, whereas the development of myeloid cells is normal. This increase, which is specific for conventional CD5−macrophages appears to be tissue specific and does not result from differences in adhesion to the peritoneal mesothelium. The level of peritoneal lymphocytes is decreased inLsp1−/− mice without affecting a particular lymphocytic subset. The proportions of precursor and mature lymphocytes in the central and peripheral tissues of Lsp1−/−mice are similar to those of wt mice andLsp1−/−mice mount a normal response to the T-dependent antigen, ovalbumin (OVA). On injection of TG, theLsp1−/−mice exhibit an accelerated kinetics of changes in peritoneal macrophage and neutrophil numbers as compared to wt including increased influx of these cells. LSP1− neutrophils demonstrate an enhanced chemotactic response in vitro to N-formyl methionyl-leucyl-phenylalanine (FMLP) and to the C-X-C chemokine, KC, indicating that their enhanced influx into the peritoneum may be a result of increased motility. Our data demonstrate that LSP1 is a negative regulator of neutrophil chemotaxis.
Introduction
Mouse lymphocyte-specific protein 1 (LSP1; p50, pp52) is an intracellular phosphoprotein of 330 amino acid residues expressed in B-lineage cells, functional T cells and thymocytes, and macrophages and neutrophils derived from fetal liver and bone marrow.1-4 LSP1 is not expressed in other hematopoietic lineages such as erythrocytes, mast cells, or megakaryocytes. In addition, nonhematopoietic tissues such as liver, kidney, heart, lung, brain, skeletal muscle, and testis do not express LSP1 messenger RNA (mRNA).1,3 Human LSP1 (WP34) has a similar pattern of expression and shares a significant sequence homology with mouse LSP1 particularly in the carboxyl-terminal half of the molecule.5-7 LSP1 contains a high-affinity F-actin binding site, which directs it to the microfilament-rich cortical cytoskeleton directly underneath the plasma membrane.2,8,9 LSP1 is a substrate for protein kinase C (PKC) and for MAPKAP kinase 2.10-12 LSP1 has 2 putative EF-hand Ca++-binding motifs near the amino terminus and recombinant LSP1 binds Ca++.2
Evidence suggests that LSP1 is an important signaling molecule that regulates cytoskeletal architecture and motility as well as receptor-induced apoptosis. Howard and coworkers13 showed that LSP1 expression in various eukaryotic cell lines, including the highly motile melanoma cell line A7, resulted in the development of hairlike projections that contain thick bundles of F-actin filaments. LSP1-expressing A7 cells also exhibited a lack of motility even when the level of LSP1 expression was not sufficient to produce hairlike formations. These findings support the earlier suggestion that LSP1 overexpression may be responsible for the morphologic and motile abnormalities of neutrophils of patients with the neutrophil actin dysfunction disorder, NAD 47/89, which exhibit a lack of motility and numerous F-actin–rich hairlike projections on their surface.14,15 We recently found that LSP1 plays a role in anti-IgM–induced apoptosis of the B-cell lymphoma line WEHI-231 and immature splenic B cells.16 It is unknown whether the 2 functions of LSP1, that is, regulation of the cytoskeleton-driven events and receptor-induced apoptosis, are mechanistically related or work independently in a cell type-specific manner.
Based on the biochemical and functional characteristics of LSP1, its cytoskeletal localization in the proximity of the plasma membrane, and its restricted hematopoietic expression, we postulated that LSP1 is important for the proper functioning of the immune system. To investigate the role of LSP1 in vivo we generated an LSP1-deficient (Lsp1−/− ) mouse strain and examined the development of lymphocyte and myeloid cell populations. In addition, we analyzed an acute inflammatory response and T-dependent humoral immune response in these animals.
Materials and methods
Gene targeting and production of Lsp1−/−mice
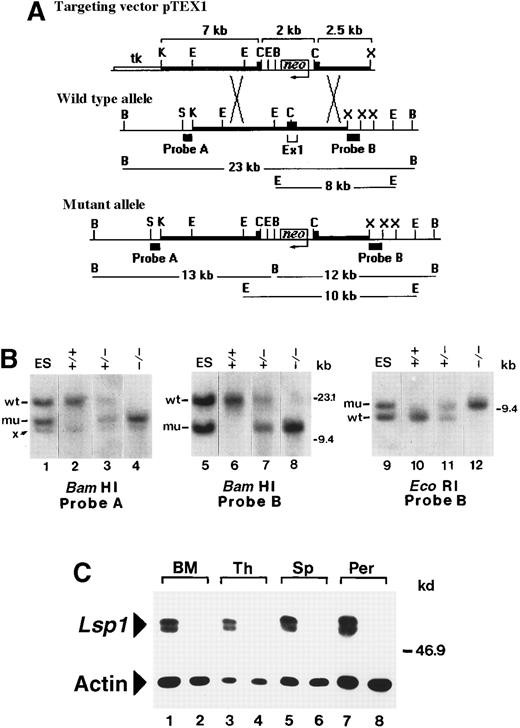
The intron/exon structure of the mouse Lsp1 gene has been determined previously.17 The gene encodes 2 tissue-specific protein isoforms, LSP1 and S37, which have unique amino termini arising from the use of alternative first exons, with remaining downstream exons in common. Because S37 is expressed in several tissues during mouse embryonic development,17 we targeted the LSP1-specific exon 1. A targeting vector, pTEX1, was used for homologous recombination in the 129-derived embryonic stem (ES) cell line, R1.18 This vector inserts the neomycin resistance gene in opposite transcriptional orientation into a uniqueClaI site contained within the coding region of exon 1. To assemble the targeting construct, 129/SvJ-derived genomic fragments extending upstream of exon 1 (7 kb KpnI-ClaI) and downstream of exon 1 (2.5 kb ClaI-XbaI) were subcloned into appropriate sites flanking the neomycin resistance cassette of the gene targeting vector, pPNT19 (Figure1A). pPNT also contains the herpes simplex virus (HSV)-thymidine kinase gene that allows for negative selection of random integration events in gancyclovir. ES cell growth and gene targeting were carried out according to an established protocol.20 Briefly, pTEX1 (240 μg), linearized at a unique NotI site, was used to transfect 3 × 10⁷ R1 cells by electroporation. Following selection in medium containing 250 ng/mL G418 plus 2 μmol/L gancyclovir, transfectants were grown in 96-well plates and screened by genomic Southern blotting for the presence of a targeted allele.21A 0.6-kb SstI-Kpn1 fragment 5′ of exon 1 (probe A) and a 1 kb XbaI fragment 3′ of exon 1 (probe B), both external to the arms of homology in pTEX1, were used to probeEcoRI- or BamHI-digested DNA. Of 293 G418-gancyclovir–resistant clones analyzed, 22 were found to contain both a wild-type (wt) and a mutant allele. Three of these clones were used to generate chimeras by aggregation with CD1 morulae,22 followed by transfer into pseudopregnant CD1 females.23 Chimeric males derived from 2 independently targeted ES cell clones were identified as germline transmitters and were subsequently bred with 129/SvJ females to obtain theLsp1 mutation on an inbred background. Heterozygous mice were then intercrossed to produce homozygotes. All mouse genotypes were determined by Southern blot analysis of tail DNA. The expression of LSP1 was determined by Western blotting.2 24 In the initial stages of this work wt and Lsp1−/−mice were bred and housed in a conventional facility and subsequently in microisolators. All mice were analyzed at 8 to 12 weeks of age.
Generation of
Lsp1−/−mice. (A) Restriction maps of pTEX1 and of the exon 1-containing regions of the wt and mutantLsp1 alleles. Thick lines represent regions of homology between the vector and endogenous allele. Diagnostic BamHI and EcoRI fragments, which hybridize with probes A and B on genomic Southern blots, are indicated in kilobases. Neoindicates neomycin gene; tk, HSV-thymidine kinase gene; K,KpnI; E, EcoRI; C, ClaI; B,BamHI, X, XbaI; S, SstI (maps not drawn to scale). (B) Southern blot analysis of targeted ES cell DNA (lanes 1, 5, and 9) and of tail DNA from F2 littermates (lanes 2-4, 6-8, and 10-12). Hybridizing bands from the wt and mutant (mu) allele are indicated. Band x is a cross-hybridizing BamHI fragment that is also detected in wt ES cells (not shown). (C) Cell lysates (1 × 10⁵ cell equivalents) from bone marrow (BM), thymus (Th), spleen (Sp), and peritoneal cavity (Per) of wt (odd numbered lanes) and Lsp1−/− (even numbered lanes) mice were analyzed using antimouse LSP1 serum or antiactin mAbs as described in “Materials and methods.” The positions of the markers in kilobases and kilodaltons are indicated on the right side of the panels in B and C, respectively.
Antibodies for flow cytometry
Antibodies used in this study included phycoerythrin (PE)-conjugated monoclonal antibodies (mAbs) anti-B220 (Sigma Chemical Co, St Louis, MO), anti-CD4, and anti-CD5 (PharMingen, San Diego, CA); fluorescein isothiocyanate (FITC)-conjugated mAbs anti-CD43 (a gift from Dr C. Paige, Toronto), anti-CD8, anti-αβTCR, anti-CD3 (PharMingen), anti-B220 (Sigma), anti-Mac-1 (anti-CD11b, M1/70; Serotec, Oxford, UK), anti-Gr-1 (Cedarlane Laboratories, Hornby, Ontario), anti-IgM Abs (μ-specific F(ab′2); Jackson ImmunoResearch Laboratories, West Grove, PA), and anti–I-Ab major histocompatibility complex (MHC) class II (Y3P, a gift from Dr T. Watts, Toronto); biotin-conjugated mAbs anti-F4/80 (Serotec), anti–Mac-1 (M1/70; a gift from Dr C. Guidos, Toronto and biotinylated using sulfo-NHS-LC-biotin as described by manufacturer, Pierce, Rockford, IL), anti-HSA (anti-CD24; PharMingen), and anti-IgD (HBδ6, a gift from Dr F. Finkelman, Cincinnati, OH and biotinylated as above) were used in conjunction with PE- or FITC-conjugated streptavidin (Caltag, San Francisco, CA). Isotype control antibodies were from Caltag or PharMingen.
Cell collection and flow cytometric analysis
Peripheral blood cells, obtained by collecting 2 drops of blood from a tail vein incision, were placed into Gey's solution25 followed by incubation on ice for 30 minutes for red blood cell lysis. Peritoneal cells from killed mice were obtained by injecting 5 mL ice-cold lavage buffer (phosphate-buffered saline [PBS] containing 5% fetal calf serum [FCS], Sigma) into the peritoneal cavity. After gentle massage, the fluid was harvested. For thioglycollate (TG) elicitation, mice were injected intraperitoneally with 0.7 mL of 4% sterile aged (2 months or more) Brewer's TG broth (Difco Laboratories, Detroit, MI). In selected experiments 5 mmol/L EDTA was added to the lavage buffer and EDTA was maintained throughout the staining procedure. Bone marrow cells were obtained by flushing femurs with Hank's balanced salt solution (HBSS) containing 2.5% FCS (HF). Single cell suspensions of spleen, lymph node, and thymus were prepared in HF and red blood cells from bone marrow and spleen preparations were depleted by ACK lysing buffer containing 0.15 mol/L NH4Cl.26 Cells were washed and resuspended (107 cells/mL) in HF containing 0.1% azide and Fc receptors were blocked using mouse and rat IgG (Sigma, 10 μg/mL each) and staining was performed as described.27 Live cells excluding propidium iodide were gated except for the peritoneal lymphocyte stainings where cells with the forward and side scatter (FSC/SSC) properties of small live lymphocytes were gated. Three-color flow cytometry was performed using a FACScan instrument equipped with CELLQuest software (Becton Dickinson, San Jose, CA).
Adhesion of peritoneal macrophages to fibronectin
Peritoneal cells were washed and resuspended (4 × 10⁶ cells/mL) in RPMI media supplemented with 10% FCS, 2 mmol/L glutamine, penicillin/streptomycin (100 U/mL), and 0.1 mmol/L nonessential amino acids (all from Life Technologies, Gaithersburg, MD). Cells (1-4 × 10⁵) were cultured in 24-well plates containing fibronectin-coated coverslips for 2 hours at 5% CO2, washed twice with RPMI media, and fixed in methanol for 10 minutes at room temperature. Immunostaining with biotinylated antimouse F4/80 antibodies (1:75, Serotec) and streptavidin-peroxidase was performed using Universal Immunostaining kit (Immunotech, Marseille, France) as described by the supplier. No staining was observed with isotype control. F4/80+ cells were enumerated in a blinded fashion within 10 randomly chosen area units (defined by the area of a grid, 0.0625 mm2). Cell counts from wells containing similar numbers of macrophages (as determined by flow cytometry, see above) were compared between wt and Lsp1−/−strains.
Bronchoalveolar lavage and cell counts
Mice were anesthetized by a single intraperitoneal injection of pentobarbital (Somnotol). Alveolar cells from lungs were lavaged 3 times with 0.6 mL PBS using an angiocath (22 gauge) inserted into the trachea. Cells were cytocentrifuged, fixed with methanol, and stained with May-Grunwald-Giemsa. The percentage of macrophages was determined by counting a total of 400 cells/slide. Total cell numbers were counted after resuspending the cells in HF (1-2 × 10⁶ cells/mL).
Neutrophil chemotaxis assay
Peritoneal exudates from wt andLsp1−/−mice, containing 80% neutrophils, were obtained 4 hours after TG injection by lavage with Ca++-, Mg++-free HBSS. Cells were labeled with 1.5 μmol/L calcein-am for 30 minutes at room temperature in HBSS and washed twice with Ca++-, Mg++-containing HBSS with 0.1% bovine serum albumin (BSA). Microplate chambers (96 wells) with 3 μm pore polycarbonate filters from Neuro Probe, Inc (Cabin John, MD) were used for chemotaxis. Chemoattractants (10−6-10−4 mol/L N-formyl methionyl-leucyl-phenylalanine [fMLP], Sigma, or 10−6mol/L C-X-C chemokine [KC], R&D Systems, Minneapolis, MN) were placed in the lower chamber and 25 μL of cells (1 × 10⁵) were placed on top of the chamber and incubated for 45 minutes at 37°C in a tissue culture incubator with 5% CO2. After incubation, nonmigrating cells were aspirated gently from the upper side of the filter, which was further wiped clean using cotton swabs. Fluorescence of the underside of the filter was determined using a Cytofluor 2300 (Millipore) fluorescent plate reader. The number of neutrophils that migrated across the filter was quantified using a standard curve (cell number versus fluorescence) constructed separately for neutrophils from each mouse. All assays were done in triplicate.
Immunization and measurement of ovalbumin (OVA)-specific antibody production
Mice were immunized by a single intraperitoneal injection of 50 μg OVA (Sigma) in complete Freund's adjuvant (Life Technologies). Mice were bled from the tail vein at various time points following immunization and OVA-specific antibody titers were measured by enzyme-linked immunosorbent assay (ELISA).28 Plates were developed with p-nitrophenyl phosphate substrate (Sigma FAST pNPP, Sigma) and optical densities at 405 nm were read on a plate reader (EL311sx AutoReader, Bio-Tek Instruments, Winooski, VT). The same anti-OVA serum sample was used to generate a linear standard curve in all experiments. Anti-OVA titers are expressed in arbitrary units relative to the standard.
Statistical analysis
All data are expressed as mean values ± 1 SEM. Unpaired Student t test or Welch t test was used with GraphPad InStat software (San Diego, CA).
Results
Confirmation of Lsp1−/−deficiency
Restriction maps of the exon 1-containing region of the mouse Lsp1 gene before and after homologous recombination with pTEX1 are diagrammed in Figure 1A. In the wt allele, probes A and B hybridize with the same BamHI fragment of ∼23 kb, whereas in the mutant allele, probes A and B hybridize with novelBamHI fragments of ∼13 kb and ∼12 kb, respectively. Probe B was also used for hybridization of EcoRI digests because this probe detects a fragment of ∼8 kb in the wt allele versus a fragment of ∼10 kb in the mutant allele (Figure 1B). Intercrosses of Lsp1+/− (F1) mice producedLsp1−/− mice at the expected mendelian frequency in the F2 generation. To confirm the absence of LSP1 expression in Lsp1−/− mice, cell lysates prepared from bone marrow, thymus, spleen, and peritoneal cavity were analyzed by Western blotting. As shown in Figure 1C, the typical LSP1 doublet bands2,29 are detected in lysates from wt mice, but not from Lsp1−/− mice. Actin levels indicate equivalent loading. The LSP1 gene encodes 2 isoforms, LSP1 and S37, which share the amino acids 24 to 330.17 The anti-LSP1 polyclonal antiserum used recognizes the C-terminal half of LSP1, amino acids 179 to 330,16 which is identical in the 2 isoforms. Figure 1C confirms that the hematopoietic tissues tested from Lsp1−/− mice do not express S37 as expected,17 hence, S37 cannot compensate for LSP1 deficiency in hematopoietic cells. Lsp1−/−mice thrive and reproduce as well as their wt counterparts and mice observed for up to 14 months are grossly normal with no obvious health defects. No differences are observed in body weight and in cellularity of spleen, thymus, lymph nodes, peritoneal cavity (see below), or bone marrow.
An expanded population of peritoneal macrophages in Lsp1−/−mice
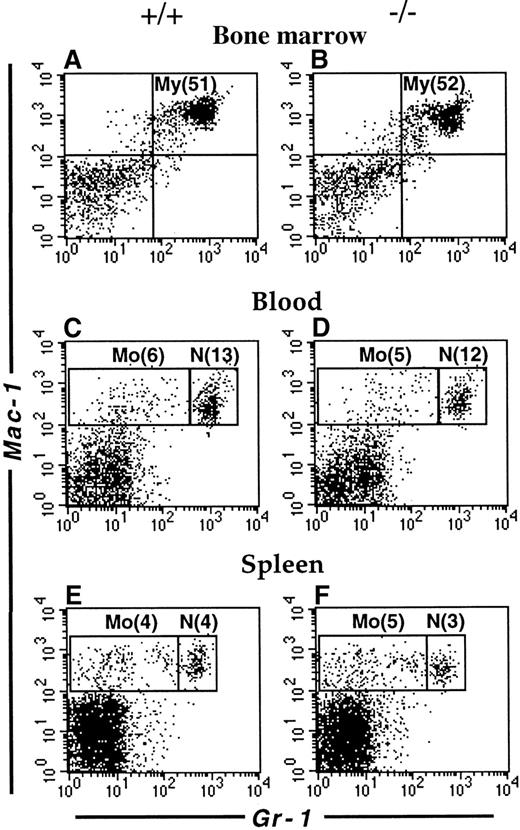
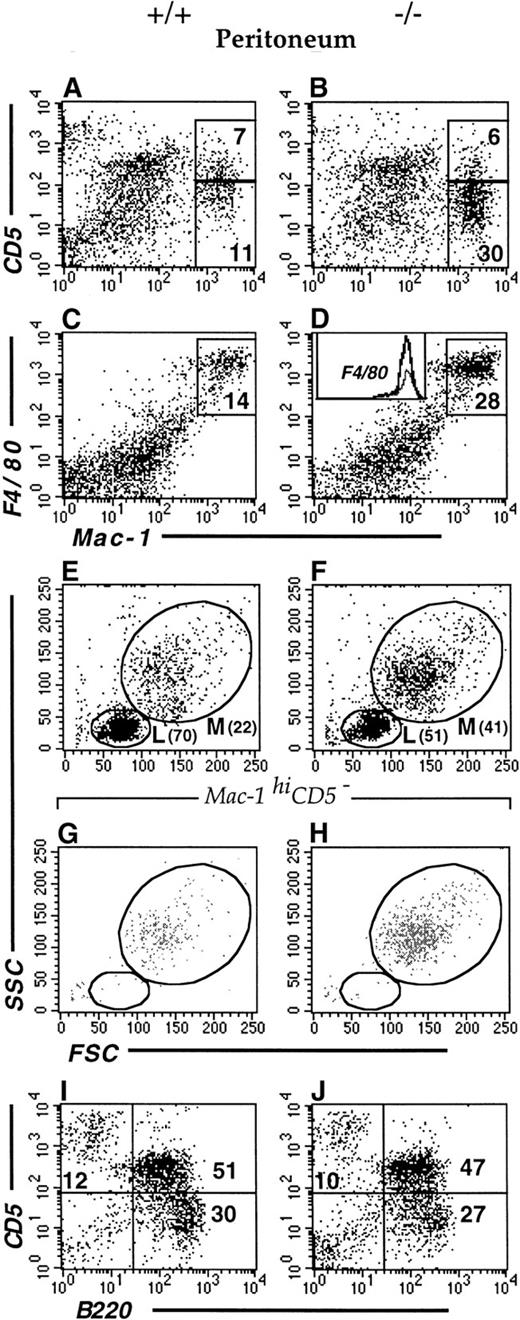
The mouse LSP1 mRNA is expressed in macrophages and neutrophils derived in vitro from committed precursors and LSP1 protein is expressed in macrophage cell lines and the early myelomonocytic cell line WEHI-3.3 We have recently observed that LSP1 is expressed in freshly isolated peritoneal macrophages by immunofluorescence microscopy (not shown). To investigate whether LSP1 plays a role in the development of myeloid cell populations, we examined the myeloid compartments of Lsp1−/−and wt mice in various tissues by flow cytometry. As shown in Figure2, the proportion of myeloid cells in bone marrow and neutrophil and monocyte populations in blood and spleen are similar in the 2 genotypes, indicating that LSP1 deficiency does not affect myeloid development. In contrast, peritoneal Mac-1hiCD5− macrophages are expanded significantly in Lsp1−/−animals. Figure3 illustrates a typical analysis where staining for Mac-1 and CD5 showed a 3-fold increase in the proportion of Mac-1hiCD5− cells, whereas the proportion of Mac-1hiCD5+ cells was similar to wt, as seen in panels A and B. To confirm that Mac-1hi cells analyzed are macrophages, we stained the peritoneal cells for Mac-1 and the macrophage marker F4/80, which is expressed on the surface of both CD5− and CD5+ subsets of macrophages.30-32 Panels C and D show that all Mac-1hi cells are F4/80+, and thus are macrophages. The proportion of total F4/80+ macrophages is increased by approximately 2-fold in the peritoneum ofLsp1−/− mice. The expansion of macrophages is also detected by FSC/SSC analysis. Panels E and F illustrate the presence of an expanded population of peritoneal cells (M), which are larger and more granular than the lymphocytes (L). When Mac-1hiCD5−or Mac-1hiF4/80+ cells (shown in panels A-D) were gated and analyzed for their FSC/SSC properties, the cell population corresponding to M in the total peritoneal cells was found (compare panels G and H with E and F), confirming that the expanded population seen in Lsp1−/− mice by FSC/SSC analysis (as shown in panels E and F) are macrophages.
Flow cytometric analysis of myeloid cells.
Single cell suspensions from the bone marrow (A,B), blood (C,D) and spleen (E,F) of wt (A,C,E) and Lsp1−/− (B,D,F) mice were stained with anti-Gr-1-FITC versus biotin-anti-Mac-1/streptavidin-PE. Cell populations corresponding to myeloid cells (My, Mac-1+Gr-1+); monocytes (Mo, Mac-1+Gr-1lo/−) and neutrophils (N, Mac-1+Gr-1hi) are indicated in boxes. Numbers in parentheses correspond to percentage of total cells.
Flow cytometric analysis of peritoneal cells.
Cells from wt (A,C,E,G,I) and Lsp1−/−(B,D,F,H,J) mice were stained with anti-Mac-1-FITC versus anti-CD5-PE (A,B) or anti-F4/80-biotin/streptavidin-PE (C,D). The inset in panel D shows histograms of F4/80 stainings from panels C (regular line) and D (bold line). Panels E, F, G, and H illustrate the FSC/SSC plots of all cells (E,F) and of Mac-1hiCD5− subsets (G,H) gated from the analysis illustrated in panels A and B, respectively. Peritoneal cells with FSC/SSC properties of small live lymphocytes were analyzed for staining with anti-B220-FITC versus anti-CD5-PE (I,J).
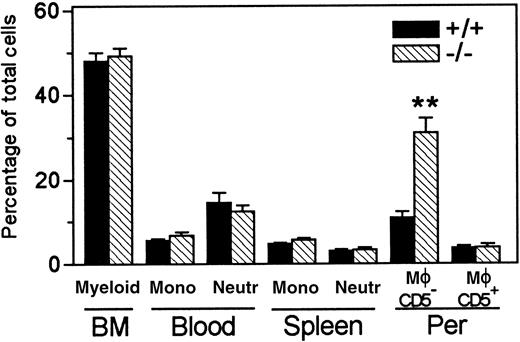
Cumulative data of myeloid development in wt andLsp1−/− mice are summarized in Figure4. Table1 illustrates the cumulative values obtained for CD5− and CD5+ macrophages or F4/80+ total macrophages. Because total peritoneal cell numbers are equivalent between the 2 genotypes (5.34 × 10⁶ ± 0.23 × 10⁶ versus 5.65 × 10⁶ ± 0.31 × 10⁶ from 25 wt versus 21 Lsp1−/− mice, respectively), the increase in the proportion of CD5− macrophages results in significantly increased numbers of these cells inLsp1−/− mice (Table 1 footnote). It is noteworthy that a similarly expanded population of Mac-1hiCD5− or Mac-1hiF4/80+ peritoneal macrophages was found from Lsp1−/−mice generated from a second line of targeted ES cells (not shown), confirming that the expanded macrophage population inLsp1−/−animals is due to LSP1 deficiency and not due to random mutation(s) in a particular ES cell clone.
Myeloid development in wt and
Lsp1−/− mice. Cumulative data from 9 to 11 mice per group show mean percentage ± 1 SEM of myeloid cells in the bone marrow, monocytes (mono), and neutrophils (neutr) in blood and spleen and CD5− and CD5+ macrophages (Mφ) in the peritoneum (Per). **, P = .0003.
Myeloid development in wt and
Lsp1−/− mice. Cumulative data from 9 to 11 mice per group show mean percentage ± 1 SEM of myeloid cells in the bone marrow, monocytes (mono), and neutrophils (neutr) in blood and spleen and CD5− and CD5+ macrophages (Mφ) in the peritoneum (Per). **, P = .0003.
Peritoneal macrophage and lymphocyte populations in wt and Lsp1−/− mice
| Cell population . | Percentage of total cells . | |
|---|---|---|
| wt . | Lsp1−/− . | |
| Macrophages | ||
| Mac-1hiCD5− | 10.9 ± 1.4 (8) | 31.0 ± 3.4 (9)* |
| Mac-1hiCD5+ | 3.7 ± 0.5 (8) | 3.9 ± 0.8 (9) |
| F4/80+Mac-1hi | 16.2 ± 2.9 (5) | 29.9 ± 2.6 (5)† |
| Lymphocytes | 67.6 ± 2.7 (8) | 47.4 ± 2.9 (9)* |
Values represent mean percentage ± 1 SEM. Numbers in parentheses correspond to the number of mice.
P ≤ .0003.
P = .008.
Lymphocytes are analyzed from FSC/SSC profiles as shown in Figure 3. The CD5− macrophage numbers based on the total peritoneal cell numbers (see “Results”) are 0.59 × 10⁶± 0.07 × 10⁶ versus 1.75 × 10⁶ ± 0.19 × 10⁶ in wt versusLsp1−/− mice, respectively.
The increase in percent macrophages is accompanied by a significant diminution of the percent small lymphocytes in the peritoneum ofLsp1−/− mice as compared to wt (see cell population designated L in Figure 3, panels E and F, and Table 1). To determine whether this reduction affects a particular subset of lymphocytes, we stained the peritoneal cells for B- and T-cell markers (Figure 3, panels I and J, and Table 2). Similar proportions of CD5+ and CD5− B-cell subsets and T cells are found within the lymphocyte population of the 2 genotypes.
Lymphocyte development in wt andLsp1−/− mice in various tissues
| Cell population . | . | Percentage of total cells . | |
|---|---|---|---|
| wt . | Lsp1−/− . | ||
| Bone marrow | |||
| Pro-B cells | B220loCD43+ | 5.4 ± 0.1 (4) | 5.8 ± 0.5 (4) |
| Pre-B cells* | B220loCD43−IgM− | 11.2 ± 0.5 (4) | 9.4 ± 0.7 (4) |
| B cells | |||
| Immature | IgM+IgDlo-neg | 10.3 ± 0.4 (7) | 8.8 ± 0.8 (7) |
| IgM+B220lo | 7.6 ± 0.4 (7) | 7.4 ± 1.0 (7) | |
| Mature | IgM+IgDhi | 3.2 ± 0.2 (7) | 4.4 ± 0.5 (7) |
| IgM+B220hi | 4.3 ± 0.3 (7) | 4.4 ± 0.2 (7) | |
| Thymus | CD4−CD8− | 5.8 ± 0.8 (8) | 5.6 ± 0.4 (9) |
| CD4+CD8+ | 82.1 ± 0.9 (8) | 81.1 ± 0.9 (9) | |
| CD4+CD8− | 9.4 ± 0.3 (8) | 10.3 ± 0.4 (9) | |
| CD4−CD8+ | 2.9 ± 0.1 (8) | 3.0 ± 0.2 (9) | |
| Spleen | |||
| B cells | |||
| Immature | B220+HSAhi | 7.8 ± 0.8 (4) | 6.5 ± 0.3 (4) |
| Mature | B220+HSAlo | 49.6 ± 1.9 (4) | 45.3 ± 0.5 (4) |
| IgM+IgDhi | 45.9 ± 0.8 (7) | 43.1 ± 1.0 (7) | |
| T cells | CD4+CD8− | 24.5 ± 0.9 (7) | 23.9 ± 1.7 (7) |
| CD4−CD8+ | 9.9 ± 1.0 (7) | 10.4 ± 1.6 (7) | |
| α/β TCR+ | 32.7 ± 3.0 (3) | 36.0 ± 8.0 (3) | |
| Blood | |||
| B cells | B220+CD3− | 6.2 ± 0.6 (11) | 7.9 ± 0.8 (10) |
| T cells | B220−CD3+ | 64.8 ± 2.7 (11) | 63.2 ± 3.1 (10) |
| Lymph nodes | |||
| B cells | B220+CD3− | 16.0 ± 1.0 (4) | 14.6 ± 1.0 (5) |
| T cells | B220−CD3+ | 78.1 ± 0.5 (4) | 79.6 ± 1.9 (5) |
| Percentage of lymphocytes | |||
| Peritoneal cavity | |||
| B cells | |||
| B-1a | B220+CD5+ | 49.0 ± 4.0 (5) | 49.1 ± 1.9 (5) |
| Mac-1+CD5+ | 41.9 ± 3.0 (6) | 40.9 ± 4.2 (7) | |
| B-1b + B-2 | B220+CD5− | 27.3 ± 1.3 (5) | 28.8 ± 1.0 (5) |
| T cells | B220−CD5+ | 17.9 ± 4.3 (5) | 12.1 ± 1.8 (5) |
Values represent the mean percentage ± 1 SEM in total cells of bone marrow, thymus, spleen, blood, and lymph nodes or in total lymphocytes of peritoneal cavity. Numbers in parentheses correspond to the number of mice.
The percentage of pre-B cells in bone marrow was determined for each individual mouse by subtracting the percentage of B220loCD43+ (pro-B) cells from the percentage of B220loIgM− (pro-B + pre-B) cells.
Although we did not induce any inflammation in the mice used in this part of our study, we considered the possibility that LSP1− macrophages are elicited rather than being resident macrophages, perhaps due to increased susceptibility ofLsp1−/− mice to inflammation by normally innocuous levels of environmental pathogens. Previous studies showed that surface F4/80 levels are down-regulated in peritoneal macrophages elicited by inflammatory stimuli.33-35 LSP1−and LSP1+ peritoneal macrophages exhibit equivalent F4/80 levels on their surface (Figure 3D, inset); therefore, it is unlikely that elicited macrophages account for the expanded macrophage population in Lsp1−/−mice. This is also supported by the fact that Lsp1−/− mice raised in microisolators exhibited similar increases in peritoneal macrophage numbers (not shown). Finally, the levels of surface antigens ICAM-1 (CD54) and MHC class II, which are up-regulated in activated macrophages,36 37 are not different betweenLsp1−/−and wt mice (not shown).
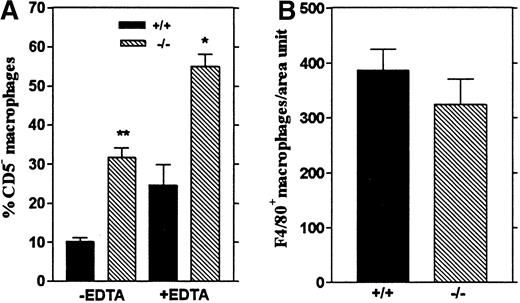
We next investigated whether the increased macrophage numbers found in the peritoneum of Lsp1−/− mice may reflect a weaker adhesive capacity of LSP1− macrophages to mesothelium,38 which would result in a more efficient recovery by peritoneal lavage. The integrin receptors play a central role in adhesion through regulation of a variety of cell-cell or cell-substrate interactions.39 We took 2 approaches to determine whether integrin-dependent adhesion is different between the macrophages from wt and Lsp1−/− mice. First, we included EDTA in the peritoneal lavage buffer so that chelation of divalent cations, required for integrin mediated adhesion, would disrupt macrophage adhesion. Secondly, we analyzed the adhesion of peritoneal macrophages to fibronectin coated coverslips in vitro, which is in part dependent on the integrin α4β1(VLA-440). VLA-4 also binds to vascular cell adhesion molecule-1 (VCAM-1), expressed in unstimulated mesothelial cells whose involvement in monocyte adhesion to these cells was described.41 Figure 5A shows that addition of EDTA results in an increase in the proportion of peritoneal macrophages recovered from mice of both genotypes. Accordingly, the proportion of Mac-1hiCD5−macrophages recovered in the presence of EDTA fromLsp1−/− mice remains significantly higher (55.0 ± 3.1%) than those recovered from wt mice (24.7 ± 5.3%). These data show that the adhesion of macrophages to the peritoneal mesothelium likely involves integrins. However, the increased numbers of CD5− macrophages recovered inLsp1−/− animals do not simply reflect differences in integrin-mediated adhesion. In support of these results, our in vitro experiments of adhesion to fibronectin (Figure 5B) show that the capacity of the peritoneal macrophages to bind to fibronectin is not changed by LSP1 deficiency.
Recovery and adhesion of peritoneal macrophages.
(A) The effect of EDTA on the recovery of peritoneal macrophages. The proportion of Mac-1hiCD5− macrophages harvested from the peritoneum of wt (+/+) orLsp1−/−(−/−) mice with or without 5 mmol/L EDTA in the lavage buffer are shown. Data are presented as mean values ± 1 SEM from 3 mice per genotype (+EDTA) and 8 or 9 mice (wt orLsp1−/−, respectively, −EDTA). *,P = .008, **, P = .0003. (B) Adhesion of the peritoneal macrophages to fibronectin in vitro. F4/80+macrophages from wt and Lsp1−/−mice adhered to fibronectin-coated coverslips were counted within a defined area as described in “Materials and methods.” Data are presented as means ± 1 SEM from 4 mice per genotype.
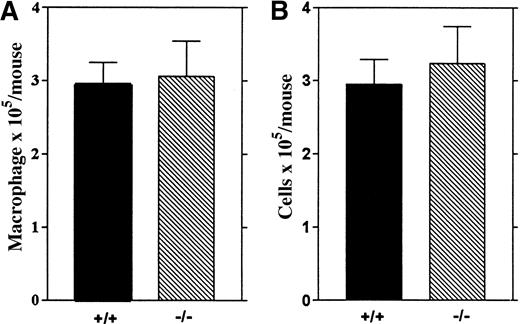
To investigate whether LSP1 deficiency affects other resident macrophage populations, we analyzed alveolar macrophages recovered by bronchoalveolar lavage from wt and Lsp1−/−animals and found similar numbers of total cells and macrophages in the 2 genotypes (Figure 6), indicating that LSP1 deficiency does not affect all resident macrophage populations.
Alveolar macrophages from wt and
Lsp1−/− mice. The number of macrophages (A) and total cells (B) recovered from 5 mice per genotype are illustrated as mean values ± 1 SEM.
Alveolar macrophages from wt and
Lsp1−/− mice. The number of macrophages (A) and total cells (B) recovered from 5 mice per genotype are illustrated as mean values ± 1 SEM.
Accelerated kinetics of changes in leukocyte populations in inflamed peritoneum from Lsp1−/−mice
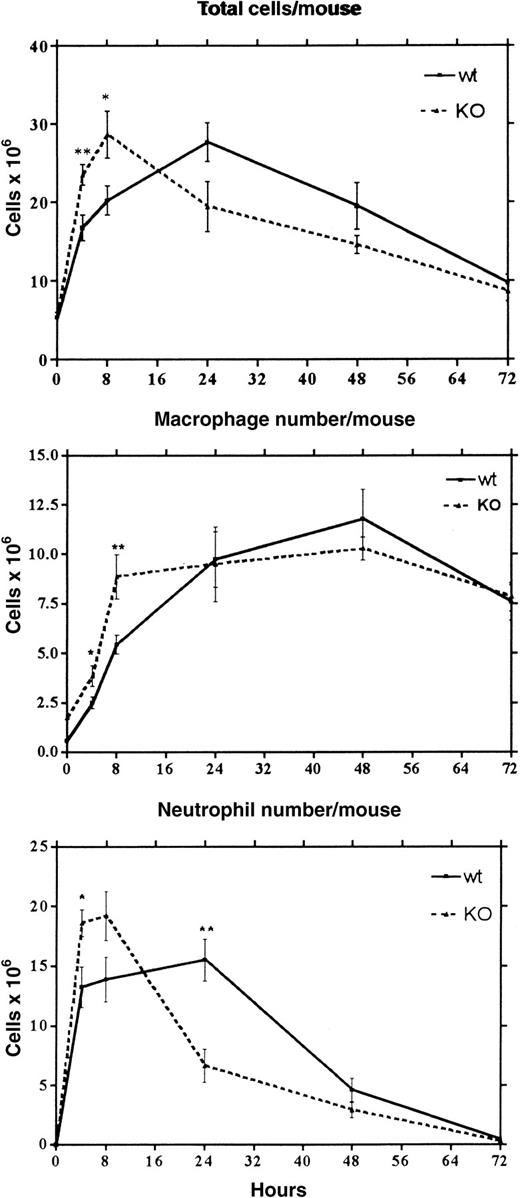
Because LSP1 deficiency changes the number of lymphocytes and macrophages in the resting peritoneum, we next investigated whether lack of LSP1 affects the proportion of elicited leukocyte populations in inflamed peritoneum after injection with TG. Total cell, macrophage, and neutrophil numbers per mouse were analyzed in peritoneal exudates harvested 4 to 72 hours after TG injection (Figure7). At 4 hours we observed a significant increase in the number of total cells, macrophages, and neutrophils inLsp1−/− mice as compared to wt mice. At 8 hours total cell and macrophage numbers reached maximal values inLsp1−/− mice, which were significantly higher as compared to wt. Flow cytometric analysis revealed that the majority of macrophages found in the peritoneum is Mac-1hiCD5− in both genotypes, the ratio of percent CD5− to CD5+ being 10.32 ± 2.25 versus 9.39 ± 1.64 in 4 wt versus 4 Lsp1−/−mice. The high number of neutrophils were maintained at 8 hours inLsp1−/− mice. At 24 hours macrophage numbers became similar between the 2 genotypes, with wt mice reaching maximal levels of macrophages and total cells only at this time point. Interestingly at 24 hours, there was a dramatic decrease in the number of LSP1− neutrophils, whereas wt neutrophil numbers remained high. These differences between wt andLsp1−/− mice were also reflected in total cell numbers. No differences in the number of macrophages and neutrophils were observed at later time points between the 2 genotypes. These data show that during acute inflammation induced by TG, macrophage and neutrophil recruitment and clearance of neutrophils occur more efficiently in the absence of LSP1.
Acute inflammatory response in wt and
Lsp1−/− mice. Mean values (± 1 SEM) for the number of total cells, macrophages, and neutrophils per mouse at various times after TG injection were generated from the analysis of 6 to 10 mice of each genotype. Macrophage and neutrophil numbers were determined by differential counting from cytocentrifuged samples stained with May-Grunwald-Giemsa. For each specimen, 400 total cells were counted. (** P < .01; *P < .05)
Increased chemotaxis of LSP1− neutrophils
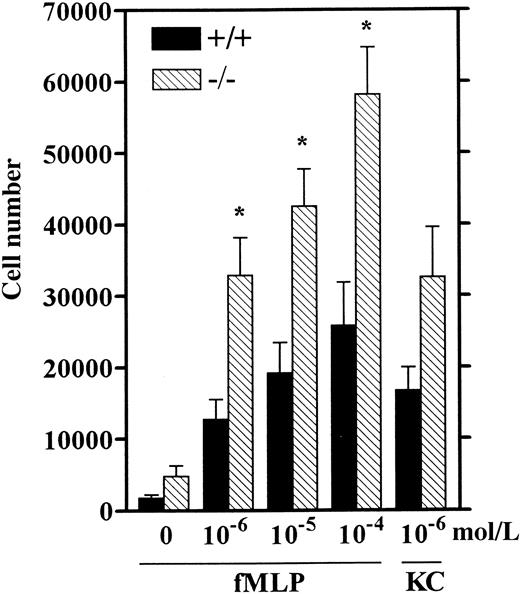
Neutrophil recruitment in response to inflammatory stimuli has been correlated with their chemotactic response in vitro.42-44 These studies showed that TG-elicited mouse neutrophils are an adequate source of neutrophils for studying in vitro chemotaxis because their response to various chemoattractants including fMLP was similar to that of unstimulated blood- or bone marrow-derived neutrophils.42,43 To test whether LSP1−TG-elicited neutrophils exhibit enhanced chemotaxis, we performed in vitro chemotaxis assays similar to previously described assays for mouse neutrophils42,43 (see “Materials and methods”) using the well-established chemoattractants, fMLP and the C-X-C chemokine KC, both specific for neutrophils.45-47Neutrophils from Lsp1−/− mice display more than 2-fold increased chemotaxis as compared to wt over a 100-fold range of concentrations for fMLP (Figure8). Although the response to KC was also increased in LSP1− neutrophils this did not reach statistical significance (P = .07). These data strongly suggest that the increase in neutrophil numbers inLsp1−/− mice as compared to wt at 4 hours after TG is due to increased chemotaxis of these cells.
Chemotaxis of wt (+/+) and LSP1 −(−/−) neutrophils.
HBSS containing Ca++ and Mg++ with 0.1% BSA in the absence (0) or presence of fMLP (10−6-10−4 mol/L) or KC (10−6mol/L) was placed in the bottom chambers and calcein-am-labeled cells (4 × 10⁶/mL) were loaded in the upper wells and chemotaxis assay was performed as described in “Materials and methods.” The number of cells migrating across polycarbonate filters ± 1 SEM of 6 mice per genotype is represented. *, P < .01.
Normal lymphocyte development in Lsp1−/−mice
Single-cell suspensions of bone marrow, thymus, spleen, blood, and lymph nodes from wt and Lsp1−/− mice were analyzed for B- and T-cell development. Cumulative data summarized in Table 2 show that the proportion of B-cell precursors (pro- and pre-B cells) and immature and mature B cells of the bone marrow and the thymocyte subsets in thymus are normal inLsp1−/− animals. In the periphery, the proportions of immature splenic B cells and mature splenic, blood and lymph node B and T cells from Lsp1−/− mice appear normal. These data show that LSP1 deficiency does not affect the B- and T-cell compartments of the central and peripheral tissues.
Lsp1−/−mice mount a normal humoral response to OVA
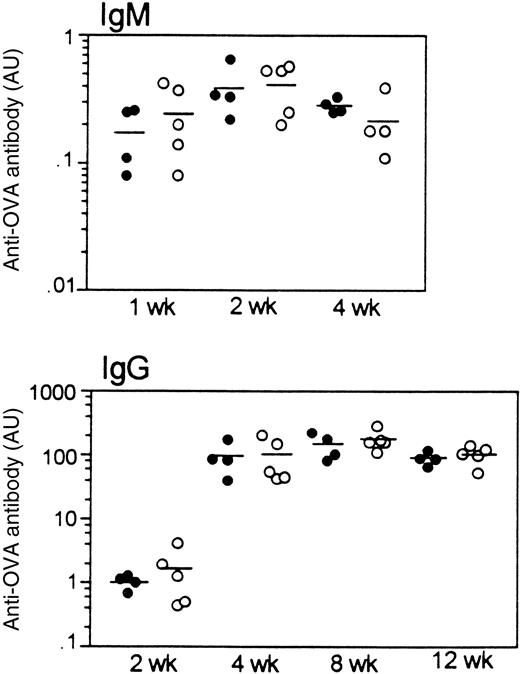
To investigate whether the T-dependent humoral immune response is affected by LSP1 deficiency, we measured antibody responses to a single injection of the T-dependent antigen, OVA. As shown in Figure9, OVA-specific IgM and IgG responses develop with the same kinetics and magnitude in wt andLsp1−/− mice. Similarly, no differences were observed in anti-OVA IgG subclasses (IgG1, IgG2a, IgG2b, and IgG3; data not shown). Nonimmune serum levels of IgM, IgG subclasses, and IgA were also similar in the 2 genotypes.
Humoral response to OVA in wt mice (filled circles) and
Lsp1−/− mice (open circles).OVA-specific IgM and IgG titers at various time points after immunization are illustrated. Each circle represents an individual mouse and horizontal lines are used to indicate means. Antibody titers are expressed as arbitrary units (AU; see “Materials and methods”). OVA-specific antibodies were not detectable in any pre-immune sera tested.
Discussion
Using Lsp1−/− mice, we observed that LSP1 deficiency does not affect the number of lymphocytes, monocytes, or neutrophils in various tissues with the exception of the peritoneum. In this latter compartment, we observed a significantly higher number of mature peritoneal macrophages in the Lsp1−/−mice as compared to wt mice (Figures 3 and 4 and Table 1). Experiments measuring adhesion (Figure 5) strongly suggest that this difference in the recovery of peritoneal macrophages does not reflect variations in adhesion to the mesothelium but rather the existence of an expanded population of macrophages residing in the peritoneal cavity of theLsp1−/− mice, in situ. This increase in the LSP1− macrophage population is accompanied by a reduction of the overall small lymphocyte population but with preservation of individual lymphocyte subsets (Figure 3, Table 2). It is unlikely that the observed increase in macrophages is secondary to a direct effect of LSP1 deficiency on lymphoid cells, because this would be expected to yield an expansion of all the peritoneal macrophage populations rather than a selective expansion of the CD5− population (Figure3 and Table 1).
In addition to an expanded peritoneal macrophage population, we observed, in the early phase of TG injection, an increased influx of LSP1− neutrophils and monocytes (Figure 7). In vitro chemotaxis experiments demonstrated an increased motility of TG-elicited neutrophils to chemoattractant gradients (Figure 8). These results show that LSP1 negatively regulates the motility of neutrophils. This is consistent with studies that showed that LSP1-overexpressing NAD 47/89 human neutrophils and LSP1-expressing transfectants of a melanoma cell line A7 displayed impaired motility.13-15 These findings suggest that LSP1 functions as a molecule coupling receptor-generated signals to the cytoskeletal rearrangements during motility. In support of this, LSP1 has the characteristics of a signaling molecule 2,8-12 and is the major substrate for MAPKAP kinase 2, a downstream kinase of the p38 MAPK pathway, in human neutrophils.12 Because chemotaxis induced by fMLP and KC depends on the activity of the p38 MAPK pathway,48-50 our future studies will examine the mechanisms whereby LSP1 regulates chemotaxis and its relation to the activation of the p38 MAPK pathway.
In view of previous findings that resident macrophages disappear from the inflamed site within the first hour of TG injection into the peritoneum,51 elevated LSP1− monocyte numbers likely result from the increased recruitment of these cells to the inflamed peritoneum and not from a larger pool of existing resident macrophages in Lsp1−/− mice. The increased influx of LSP1− neutrophils into the peritoneum may contribute to the increased recruitment of monocytes.52,53Additionally, as for neutrophils, LSP1 deficiency may lead to enhanced motility of monocytes. This would contribute to enhanced influx of monocytes into the peritoneum of TG-treated mice and could explain the preferential accumulation of CD5− macrophages in the peritoneum of unchallenged Lsp1−/− mice. The CD5− population of peritoneal macrophages is derived from blood monocytes that migrate into the peritoneum, whereas the CD5+ macrophages, which derive from bipotential precursors that generate CD5+ B-1 cells or macrophages, are produced locally in the peritoneum, milky spots of the ommentum, and other tissues.31,54 Also, of note is that 8 hours after TG injection, the ratio of CD5−/CD5+ macrophages recruited to the peritoneum are similar in both genotypes (see “Results”) indicating that during acute inflammation, both macrophage subsets are increased in Lsp1−/−animals. Thus, although the CD5+ macrophages may also exhibit a greater motility in the absence of LSP1, this may only be relevant under conditions of mobilization and not in steady state where they are locally generated. The increased influx of CD5−LSP1− monocytes due to increased motility may not necessarily change the monocyte levels in blood due to their high turnover rate in circulation.55 Indeed, blood CD5− and CD5+ monocyte levels in LSP1− and wt mice were similar before or after TG (not shown). It is noteworthy that the observed differences in the homeostasis of the CD5− and CD5+ macrophages in LSP1-deficient mice is likely not due to the differential expression of CD5 on these cells because the proportion of the peritoneal B1 and B2 subsets of B cells, which are also distinguished by CD5 expression, is not different between Lsp1−/−and wt mice.
In addition to increased recruitment, we also observed a significantly increased clearance of neutrophils at 24 hours after TG injection inLsp1−/− mice indicating that LSP1 may also be critical for the regulation of neutrophil apoptosis or their phagocytosis by macrophages in the inflamed peritoneum. Apoptosis of neutrophils and their phagocytic clearance by macrophages are considered major mechanisms regulating resolution of inflammation.56,57 In vitro phagocytosis experiments58 using apoptotic thymocytes or neutrophils and TG-elicited macrophages from Lsp1−/− and wt mice did not show any differences in the degree of phagocytosis (C. Wang, unpublished results). Therefore, the increased clearance of the neutrophils in Lsp1−/− mice likely reflects the involvement of LSP1 in the regulation of neutrophil apoptosis.
Our studies indicate that LSP1 does not play a major role in B- or T-lymphocyte development. Lsp1−/− mice mount a normal immune response to OVA (Figure 9) suggesting that internalization and presentation of OVA by B cells, T-B collaboration, germinal center formation, isotype switching, and Ig secretion occur normally in these animals. In addition, LSP1 is not essential for priming naı̈ve T cells by professional antigen-presenting cells such as macrophages or dendritic cells. We do not know whether splenic macrophages from Lsp1−/− mice are in larger numbers than wt because only monocytes are recovered in splenic single-cell suspensions59 (and based on FSC/SSC profiles; data not shown) and our analysis of alveolar macrophages indicate that not all macrophages are affected by LSP1 deficiency. Macrophage levels in the spleen may not, however, be critical for the priming of naı̈ve T cells because dendritic cells are likely the major population of primary antigen-presenting cells initiating an immune response to OVA.60 In support of this, op/opmice, which are severely deficient in peritoneal macrophages and have reduced numbers of splenic macrophages, mount a normal T-dependent immune response.61 62
In conclusion, our results demonstrate that LSP1 modulates the homeostasis of leukocytes in the peritoneum and the course of acute peritonitis. The absence of LSP1 in myeloid leukocytes results in a more rapid influx of these cells and clearance of neutrophils from this compartment. Based on this functional significance and the expression pattern of LSP1, we agree with the recent suggestion63 to change the full name of LSP1 from lymphocyte-specific protein 1 to leukocyte-specific protein 1.
Acknowledgments
We thank Drs David Hackam, Ian McGilvray, and Sergio Grinstein for valuable advice; Dr Yuri Moltyaner for teaching how to harvest alveolar macrophages; Mr Andrzej Wielowieyski and Ms Vera Cherepanov for excellent technical help; and Ms Deborah Hyam and Dr Norman Iscove for their help and advice at the initial stages of this work. G.P.D. holds the Fraser Eliott Chair in Transplantation Research, V.L.M. is a recipient of a Studentship Award from the Medical Research Council of Canada and C.W. is a recipient of a Postdoctoral Fellowship Award from the University of Toronto Arthritis Centre of Excellence.
Supported by a grant from the National Cancer Institute of Canada with funds from Canadian Cancer Society (J.J.), by funds from the University of Toronto Arthritis Centre of Excellence (J.J.-B. and J.J.), and by a grant from the Medical Research Council of Canada (G.P.D.).
J.J.-B. and V.L.M. contributed equally to this report.
The publication costs of this article were defrayed in part by page charge payment. Therefore, and solely to indicate this fact, this article is hereby marked “advertisement” in accordance with 18 U.S.C. section 1734.
References
Author notes
Jenny Jongstra-Bilen, Toronto Western Hospital, Main Pavilion, Room 13-312A, 399 Bathurst St, Toronto, Ontario M5T 2S8, Canada; e-mail: jbilen@uhnres.utoronto.ca.

This feature is available to Subscribers Only
Sign In or Create an Account Close Modal