Abstract
By using rapid flow cytometric techniques capable of detecting one leukemic cell in 104 normal cells, we prospectively studied minimal residual disease (MRD) in 195 children with newly diagnosed acute lymphoblastic leukemia (ALL) in clinical remission. Bone marrow aspirates (n = 629) were collected at the end of remission induction therapy and at 3 intervals thereafter. Detectable MRD (ie, ≥0.01% leukemic mononuclear cells) at each time point was associated with a higher relapse rate (P < .001); patients with high levels of MRD at the end of the induction phase (≥1%) or at week 14 of continuation therapy (≥0.1%) had a particularly poor outcome. The predictive strength of MRD remained significant even after adjusting for adverse presenting features, excluding patients at very high or very low risk of relapse from the analysis, and considering levels of peripheral blood lymphoblasts at day 7 and day 10 of induction therapy. The incidence of relapse among patients with MRD at the end of the induction phase was 68% ± 16% (SE) if they remained with MRD through week 14 of continuation therapy, compared with 7% ± 7% if MRD became undetectable (P = .035). The persistence of MRD until week 32 was highly predictive of relapse (all 4 MRD+patients relapsed vs 2 of the 8 who converted to undetectable MRD status; P = .021). Sequential monitoring of MRD by the method described here provides highly significant, independent prognostic information in children with ALL. Recent improvements in this flow cytometric assay have made it applicable to more than 90% of all new patients.
Introduction
Leukemic relapse occurs in at least 20% of children with acute lymphoblastic leukemia (ALL) who are treated in contemporary programs of chemotherapy.1 A number of clinical and biologic presenting features can be used to estimate the relapse hazard in such patients, but none is completely reliable.1 Sequential monitoring of the cellular response to chemotherapy in vivo promises to be an important strategy for determining the prognosis of individual patients. However, morphologic examination of peripheral blood or bone marrow cells, the traditional approach to identifying residual disease, is subjective and quite limited in sensitivity. To be detected with certainty, the leukemic blast cells must constitute at least 5% of the total nucleated cell population.2 Thus, a patient declared to be in complete clinical remission may, in fact, harbor as many as 1010leukemic cells.
A variety of methods to detect submicroscopic levels of leukemia in patients with ALL have been developed.2 The most promising are flow cytometric detection of aberrant immunophenotypes and polymerase chain reaction (PCR) analysis of clonal antigen-receptor gene rearrangements.3,4 Detection of minimal residual disease (MRD) with these methods during clinical remission appears to be independently associated with treatment outcome.5-11Nevertheless, before using MRD findings to guide therapy, further analysis is required to establish (1) the relative prognostic strength of different levels of MRD at various times during therapy, (2) the clinical significance of MRD fluctuations during clinical remission, (3) the relation of MRD findings to presenting clinical and biologic features of ALL, and (4) the predictive value of MRD findings in relation to other measurements of early response to therapy.
To determine the utility of sequential measurements of MRD relative to other prognostic parameters and to clarify the significance of MRD findings in clinical remission, we analyzed the results of a prospective MRD study of 629 bone marrow aspirates collected from 195 children with ALL in first clinical remission. The mononuclear cells were studied by a rapid and highly sensitive flow cytometric method that can detect one leukemic cell per 104 normal bone marrow cells or greater.3
Patients, materials, and methods
Patients
From December 1991 to February 1998, 389 children with newly diagnosed ALL were enrolled in Total Therapy studies XIIIA (n = 165) and XIIIB (n = 224) at our institution. At diagnosis, an immunophenotype suitable for flow cytometric studies of MRD was identified in 204 (58.3%) of the 350 patients with adequate immunophenotypic studies. Of these 204 patients, 195 (95.6%) participated in the MRD monitoring study (early results of MRD studies in 158 of the patients, followed up to July 1997, were previously reported).5 The 9 ineligible patients failed to attain a complete clinical remission within the planned 6-week period of induction chemotherapy. Patients with suitable immunophenotypes were more likely to have T-cell ALL than the remaining patients (27.0% vs 3.6%; P < .001). Hence, the first subgroup had a higher prevalence of boys (63.8% vs 48.5%; P = .003), leukocytes greater than 100 × 109/L (20.4% vs 9.8%;P < .004), and mediastinal masses (16.3% vs 1.0%;P < .001). The 4-year cumulative incidence of relapse (SE) for patients with MRD studies was 16.3% ± 3.5%, compared with 5.6% ± 2.3% for all others (P = .004). These studies were approved by the St Jude Institutional Review Board, with informed consent obtained from the parents or guardians of each child.
Diagnostic immunophenotyping and chromosomal and genetic analyses were performed by standard techniques.
Treatment protocol
Initial treatment consisted of methotrexate alone, followed 3 to 4 days later by 6 weeks of remission induction therapy with prednisone, vincristine, daunorubicin, asparaginase, and etoposide plus cytarabine.12 Once they attained a complete clinical remission, all patients received 2 weeks of consolidation therapy with high-dose methotrexate and mercaptopurine, followed by risk-directed continuation therapy. For higher-risk cases, this consisted of multiple drug pairs administered in weekly rotation and for lower-risk cases daily mercaptopurine and weekly methotrexate with prednisone plus vincristine pulse every 4 weeks. High-dose methotrexate was given every 8 weeks to all patients in the first year. Reinduction therapy (similar to that used initially) was administered from weeks 32 to 37. All patients received intrathecal therapy with methotrexate, hydrocortisone, and cytarabine for 1 year; cranial irradiation was reserved for those at very high risk of relapse (18 Gy) or those with central nervous system (CNS) status 3 at diagnosis (24 Gy) at 1 year of continuation therapy.12 Twenty patients who were judged to have very high-risk ALL underwent allogeneic bone marrow transplantation.
Flow cytometric assessment of minimal residual disease
Bone marrow aspirates were collected in preservative-free heparin at the end of remission induction (6 weeks after diagnosis) and during weeks 14, 32, and 56 of continuation therapy. Leukemia-associated immunophenotypes (found on leukemic cells but not on normal bone marrow cells) were determined by multiparameter flow cytometry, with various combinations of monoclonal antibodies and/or heterologous antisera conjugated to fluorescein isothiocyanate, phycoerythrin, peridinin chlorophyll protein, and allophycocyanin.3 The marker combinations currently used in our laboratory allow monitoring of MRD in more than 90% of patients and are shown in Table 1. Matched nonreactive fluorochrome-conjugated antibodies served as controls. The staining procedure has been described.3 For each case, marker combinations allowing the identification of one leukemic cell per 104 normal nucleated bone marrow cells or greater were selected at diagnosis and then applied during clinical remission.3 13 In the early part of the study, we used a FACScan flow cytometer with Lysis II or Cell Quest software, switching later to a dual laser-FACScalibur flow cytometer with Cell Quest software (cytometers and softwares were from Becton Dickinson, San Jose, CA).
Immunophenotypic markers currently used to study MRD in children with ALL
| ALL lineage . | Phenotype . | Frequency (%)* . |
|---|---|---|
| B-lineage | CD19/CD34/CD10/TdT† | 30-50 |
| CD19/CD34/CD10/CD22† | 20-30 | |
| CD19/CD34/CD10/CD38† | 30-50 | |
| CD19/CD34/CD10/CD45† | 30-50 | |
| CD19/CD34/CD10/CD13 | 10-20 | |
| CD19/CD34/CD10/CD15 | 5-10 | |
| CD19/CD34/CD10/CD33 | 5-10 | |
| CD19/CD34/CD10/CD65 | 5-10 | |
| CD19/CD34/CD10/CD21 | 5-10 | |
| CD19/CD34/CD10/CD56 | 5-10 | |
| CD19/CD34/CD10/CD66c | 10-20 | |
| CD19/CD34/TdT/cytoplasmic† | 10-20 | |
| CD19/7.1 | 3-5 | |
| CD19/p53 | 3-5 | |
| T-lineage | TdT/CD3 | 90-95 |
| CD34/CD3 | 30-50 |
MRD, minimal residual disease; ALL, acute lymphoblastic leukemia.
Proportion of childhood ALL cases in which one leukemic cell in 104 normal bone marrow cells can be detected with the listed immunophenotypic combination. Most cases express more than one combination suitable for MRD studies.3
The use of these immunophenotypes for MRD studies relies mainly on differences in intensities of expression between leukemic lymphoblasts and normal lymphoid progenitor cells. The remaining combinations rely mainly on the aberrant expression of one of the markers.3
The flow cytometry protocol used for MRD detection has been described in detail previously.3 In all samples, we acquired data from all mononuclear cells in each test tube (more than 1 × 10⁵). Flow cytometric data were recorded within 24 hours after sample collection and processing, with no observer knowledge of a patient's clinical status or diagnostic features (excluding immunophenotype).
Statistical analysis
Differences in the distribution of clinicobiologic presenting features by level of residual disease at the end of remission induction were compared by the exact chi-square test. The cumulative incidence of ALL relapse, was estimated, with other competing risks (ie, second malignancy and death while in remission), as described by Kalbfleisch and Prentice,14 and compared by Gray's test, applied to follow-up observations through November 1999; 98.7% of patients had complete follow-up information within 1 year of the analysis. To assess the prognostic value of different levels of MRD after adjustment for competing prognostic factors, we stratified the data by treatment, and then separately for each of age, leukocyte count, and adverse genetic features. For these cumulative incidence analyses, missing residual disease determinations during continuation therapy (4.38% of all tests) were imputed when the immediately preceding and following measurements were identical. Patients who underwent bone marrow transplantation were followed until they experienced a relapse, competing event, or until their last follow-up date.
Results
Levels of residual leukemia as a predictor of clinical outcome
We identified cells with leukemia-associated immunophenotypes in 75 (11.9%) of the 629 remission marrow samples studied. MRD was most prevalent in bone marrow collected at the end of remission induction (25.5%; Table 2). The percentage of samples with residual disease decreased to 13.8%, 3.8%, and 4.3% at weeks 14, 32, and 56 of continuation chemotherapy, respectively. At each sampling interval, the detection of MRD was significantly associated with a greater likelihood of leukemic relapse (P < .001; Table 2). Among patients with positive findings at the end of induction therapy, the 5-year cumulative incidence of relapse (± SE) was 43% ± 11%, compared with 10% ± 3% for those with negative findings. In the latter group, 2 of the 9 patients who relapsed had detectable leukemic cells in subsequent testing, whereas in another patient, resurgent blast cells lacked the leukemia-specific markers observed at diagnosis, providing an explanation for the persistently negative MRD findings. By contrast, in the positive group, all relapses could be attributed to cells with the same leukemia-specific immunophenotype seen at diagnosis and at the end of induction therapy. Detection of MRD during continuation chemotherapy was also strongly predictive of leukemic relapse (P < .001; Table 2).
Detection of MRD in children with ALL during clinical and morphologic remission and cumulative incidence of ALL relapse
| Time of testing . | No. of samples tested . | % with MRD* . | 5-year incidence of relapse (±SE)† . | |
|---|---|---|---|---|
| MRD-positive . | MRD-negative . | |||
| End of remission induction | 165 | 25.5 | 43% ± 11% | 10% ± 3% |
| Continuation therapy | ||||
| Week 14 | 145 | 13.8 | 69% ± 16% | 10% ± 3% |
| Week 32 | 156 | 3.8 | 86% ± 17% | 14% ± 4% |
| Week 56 | 163 | 4.3 | 51% ± 25% | 12% ± 4% |
MRD, minimal residual disease; ALL, acute lymphoblastic leukemia.
Median (range) percentage of bone marrow mononuclear cells expressing leukemia-associated immunophenotypes (Table 1) was 0.06% (range, 0.01% to 19%).
All comparisons, P < .001.
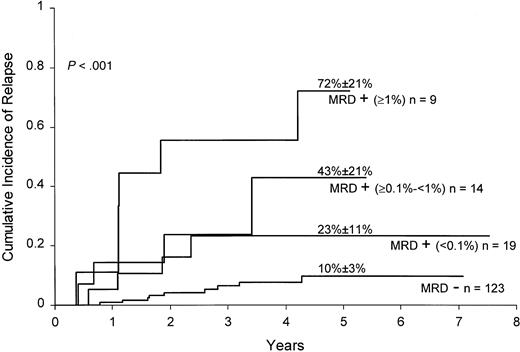
To determine whether levels of MRD were associated with relapse hazard, we segregated positive cases at the end of remission induction and at week 14 of continuation therapy into 3 groups according to levels of residual disease: 0.01% to less than 0.1%, 0.1% to less than 1%, and 1% or higher. MRD levels of 1% or higher at the end of remission induction were associated with a particularly high relapse hazard (Figure 1): only 2 of 9 patients in this group, one of whom underwent allogeneic stem cell transplantation, were alive and in remission at 2.5 and 4.5 years after diagnosis. Levels of 0.1% or higher at week 14 of continuation therapy also identified patients at high risk of relapse: 5 of 6 patients in this category have relapsed.
Cumulative incidence of relapse in children with ALL according to MRD levels at the end of remission induction.
All patients were in complete morphologic remission at the time of the MRD studies. Levels of MRD were defined by the percentage of mononuclear cells expressing leukemia-specific immunophenotypes.
Sequential determination of residual disease and treatment outcome
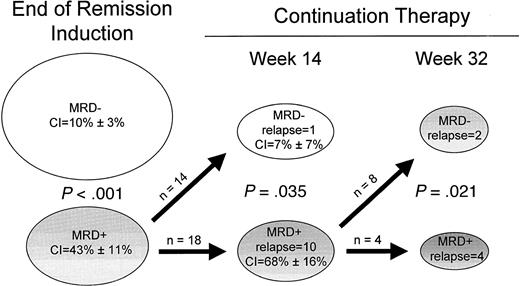
The prevalence of residual disease during clinical remission declined progressively during treatment. Samples collected sequentially from individual patients either remained positive or negative throughout the analysis or converted from positivity to negativity. The only exceptions were 2 of 123 cases that were MRD-negative cases at the end of remission induction. Both became MRD positive at weeks 56 and 67, 7 and 4 months before clinical relapse. Figure2 illustrates the prognostic significance of a progressive decline in MRD levels during clinical remission. Among patients who were MRD positive at the end of remission induction and remained positive at week 14 of continuation therapy, the 4-year cumulative incidence of relapse was 68% ± 16%. By contrast, it was only 7% ± 7% in those who became MRD negative at week 14 (P = .035). Ten of 18 patients in the positive group relapsed, compared with only one of the 14 patients who became MRD negative. A similar analysis was performed for cases that were positive at week 14. All 4 patients who remained positive through week 32 subsequently relapsed, compared with 2 patients of 8 in whom MRD became undetectable (P = .021). These results indicate relatively good treatment outcome even in patients with a slow response to therapy, providing that MRD levels decrease below the less than 0.01% threshold during the first 10 months of therapy.
Prognostic significance of sequential measurements of MRD in children with ALL.
Cumulative incidence (CI) of relapse for each subgroup is indicated. Sufficient material was not available for all patients at all time points, and only patients in whom sequential MRD measurements were available were included in this analysis.
Relation between residual disease and clinicobiologic features at diagnosis
Rates of MRD detection on completion of induction therapy were not significantly related to gender, race, leukocyte count, presence of a mediastinal mass, or CNS status (Table3). However, residual disease was significantly more frequent in infants and patients 10 years of age or older than in children of intermediate ages (P = .007). Notably, 4 of 6 infants had ≥0.01% leukemic cells at the end of remission induction. Among cellular features, rates of detection did not differ significantly in comparisons based on cell lineage. There was, however, a remarkable association between MRD detection and the Philadelphia chromosome: all 8 cases with this prognostically unfavorable abnormality15 had positive findings (P < .001). This contrasts with MRD positivity in 2 of 15 cases with a TEL gene rearrangement and 8 of 42 cases with hyperdiploid (greater than 50 chromosomes) B-lineage ALL, both considered favorable prognostic signs.16-20
Levels of MRD at the end of remission induction according to clinical and biologic features at diagnosis
| Presenting feature . | MRD-negative (<0.01%) . | MRD-positive . | P value3-150 . | ||
|---|---|---|---|---|---|
| ≥0.01%<0.1% . | ≥0.1%<1% . | ≥1% . | |||
| Age (y) | |||||
| <1 | 2 | 1 | 3 | 0 | |
| 1-9 | 84 | 10 | 7 | 3 | |
| ≥10 | 37 | 8 | 4 | 6 | .007 |
| Race | |||||
| White | 88 | 12 | 8 | 6 | |
| Other | 35 | 7 | 6 | 3 | .666 |
| Sex | |||||
| Female | 47 | 5 | 4 | 3 | |
| Male | 76 | 14 | 10 | 6 | .732 |
| WBC (109/L) | |||||
| ≤100 | 103 | 14 | 10 | 5 | |
| >100 | 20 | 5 | 4 | 4 | .127 |
| Lineage | |||||
| T-cell | 36 | 5 | 3 | 3 | |
| B-cell | 87 | 14 | 11 | 6 | .945 |
| Mediastinal mass | |||||
| Absent | 100 | 16 | 12 | 8 | |
| Present | 23 | 3 | 2 | 1 | .919 |
| DNA index | |||||
| <1.16 or >1.60 | 96 | 15 | 13 | 8 | |
| 1.16-1.60 | 27 | 4 | 1 | 1 | .550 |
| CNS3 | |||||
| No | 118 | 19 | 13 | 9 | |
| Yes | 5 | 0 | 1 | 0 | .745 |
| Ploidy3-151 | |||||
| ≤50 chromosomes | 88 | 13 | 12 | 7 | |
| >50 chromosomes | 34 | 5 | 2 | 1 | .589 |
| TEL gene3-151 | |||||
| Germline | 71 | 11 | 10 | 6 | |
| Rearranged | 13 | 1 | 1 | 0 | .708 |
| Ph chromosome | |||||
| No | 123 | 17 | 12 | 5 | |
| Yes | 0 | 2 | 2 | 4 | <.001 |
| MLL gene | |||||
| Germline | 115 | 16 | 13 | 7 | |
| Rearranged | 8 | 3 | 1 | 2 | .195 |
MRD, minimal residual disease; WBC, white blood cell; CNS, central nervous system; Ph, Philadelphia.
By exact chi-square test for independence.
Data not available in all cases.
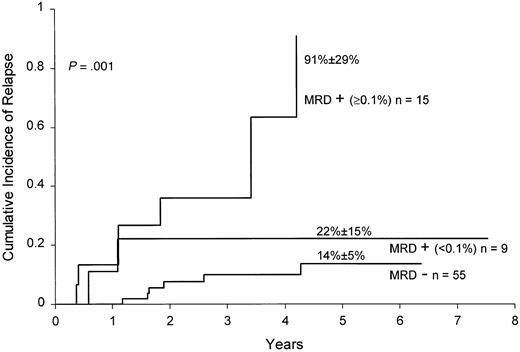
The prognostic value of MRD detection by flow cytometric assay remained significant after adjustment for competing covariates, including age (P < .001), leukocyte count (P < .001), and adverse genetic features (Philadelphia chromosome:P < .001; MLL gene rearrangement:P < .001; or either: P = .004). This result was confirmed by an analysis that excluded patients with known unfavorable (Philadelphia chromosome and leukocyte counts more than 25 × 109/L; MLL gene rearrangement and less than 1 year of age) and favorable (B-lineage phenotype with DNA index more than 1.16 or TEL gene rearrangement, or leukocyte counts less than 50 × 109/L and 1 to 9 years of age, without CNS or testicular involvement, and without Philadelphia chromosome, E2A-PBX1 or MLL rearrangement) presenting prognostic features.1 In this “standard-risk” group, MRD levels ≥0.1% at the end of remission induction strongly correlated with the risk of leukemic relapse (P = .001; Figure 3).
Cumulative incidence of relapse in children with standard-risk ALL according to MRD levels at the end of remission induction.
All patients were in complete morphologic remission at the time of the MRD studies. Levels of MRD were defined by the percentage of mononuclear cells expressing leukemia-specific immunophenotypes.
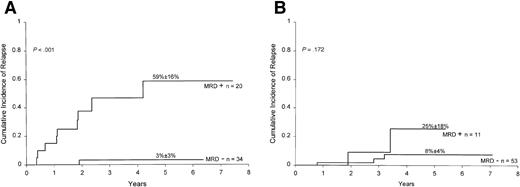
Finally, we determined the prognostic significance of MRD detection in B-lineage ALL patients stratified by the National Cancer Institute (NCI)/Rome criteria.21 As shown in Figure4A, results of MRD at the end of remission induction correlated well with treatment outcome within the NCI high-risk group (ie, patients with age less than 1 or 10 years or older, or leukocyte counts ≥50 × 109/L;P < .001). A similar trend was noted within the NCI good-risk group (1 to 9 years of age and leukocyte counts less than 50 × 109/L), but the results did not achieve statistical significance (P = .172; Figure 4B). Overall, of the 87 patients with B-lineage ALL who were MRD negative at the end of remission induction, only 4 have relapsed. Thus, relatively rapid elimination of MRD in patients with this subtype of leukemia identifies cases with an outstanding prognosis.
Cumulative incidence of relapse in children with high-risk (A) and low-risk (B) ALL according to MRD studies at the end of remission induction.
Risk was defined by NCI criteria (see text for definition). All patients were in complete morphologic remission at the time of the MRD studies. MRD positivity is defined as ≥0.01% of mononuclear cells expressing leukemia-specific immunophenotypes.
Relation between residual disease and clearance of circulating lymphoblasts
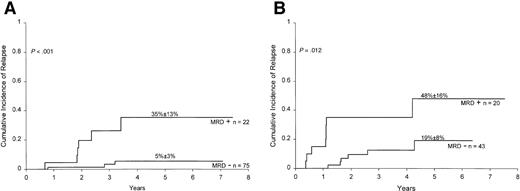
Persistence of circulating lymphoblasts after the first week of treatment identifies children with ALL at a higher risk of relapse.22-26 We therefore determined whether MRD studies at the end of remission induction would add to the prognostic information provided by the earlier morphologic assessment of circulating lymphoblasts. Data on circulating lymphoblasts after 7 days of initiation of treatment were available for 160 of the 165 patients with MRD studies at the end of the induction phase. The 5-year cumulative incidence of relapse for the 63 patients with circulating lymphoblasts was 28.6% ± 7.6% versus 11.8% ± 3.8% for the 97 patients without circulating lymphoblasts (P = .018). As shown in Figure 5, results of MRD at the end of induction correlated well with treatment outcome within either group of patients.
Relation between MRD and clearance of circulating lymphoblasts at day 7.
Cumulative incidence of relapse in children without (A) and with (B) circulating lymphoblasts after 7 days of initiation of treatment according to MRD studies at the end of remission induction. All patients were in complete morphologic remission at the time of the MRD studies. MRD positivity is defined as ≥0.01% of mononuclear cells expressing leukemia-specific immunophenotypes.
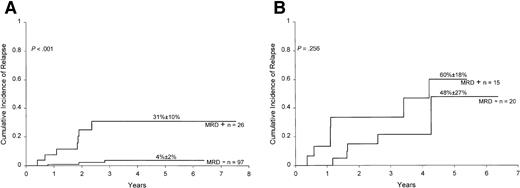
Because the treatment protocol in this study had a “window” administration of methotrexate 3 to 4 days preceding remission induction treatment, we also examined the results of circulating lymphoblasts at day 10. Of the 158 patients with available information, 35 had circulating lymphoblasts. The 5-year cumulative incidence of relapse for these patients was 51.2% ± 13.9% versus 9.2% ± 2.8% for the 123 patients without circulating blasts (P < .001). MRD findings at the end of the induction phase correlated well with treatment outcome in patients without circulating blasts (P < .001; Figure6A). No statistically significant differences were noted among the 35 patients with circulating blasts (Figure 6B).
Relation between MRD and clearance of circulating lymphoblasts at day 10.
Cumulative incidence of relapse in children without (A) and with (B) circulating lymphoblasts after 10 days of initiation of treatment according to MRD studies at the end of remission induction. All patients were in complete morphologic remission at the time of the MRD studies. MRD positivity is defined as ≥0.01% of mononuclear cells expressing leukemia-specific immunophenotypes.
Discussion
The measurement of MRD at critical intervals during the disease course is a new tool to gauge the effectiveness of therapy in children with ALL. In this study, we attempted to define criteria that might aid in clinical decision making, based on monitoring of MRD. At any point during clinical remission, the detection of MRD (ie, one or more leukemic cells among 10 000 normal bone marrow mononuclear cells) was associated with a higher risk of subsequent relapse, reinforcing our previous studies5 and those of other laboratories10,11 in which PCR assays were used to detect MRD. We found, among MRD-positive patients, that the extent of residual disease was of utmost importance in predicting treatment outcome. Levels of MRD ≥1% at the end of remission induction (or ≥0.1% for patients with presenting “standard risk” features) were associated with a particularly high relapse hazard, not unlike that reported for patients who fail to achieve morphologic remission.27Likewise, only one of the 6 patients with one or more leukemic cell in 1000 normal bone marrow mononuclear cells at week 14 of continuation therapy remains in clinical remission (but continues to be MRD positive), 42 weeks after the test. Finally, we noted that MRD detected during early clinical remission can become undetectable at later time points and that this conversion is associated with a relatively good clinical outcome. This observation underscores the importance of intensive postinduction chemotherapy as a means to eliminate residual leukemic cells and their dire prognostic consequences.
Certain presenting features of ALL, such as the patient's age and the presence or absence of adverse genetic abnormalities, are directly related to the speed and extent of initial cytoreduction.1This generalization is well supported by findings of this study. For example, MRD at the end of remission induction was most frequently detected in patients with unfavorable age or, as previously noted by Brisco et al,28 the Philadelphia chromosome. Other factors, not examined here, can also affect the cytoreductive capacity of ALL therapy. These include pharmacokinetic and pharmacogenetic variables,29 and the sensitivity of blast cells to chemotherapy.30 In vivo measurements of leukemia cytoreduction should reflect the collective effect of these variables. Indeed, the presence of circulating blasts after 1 week of therapy,22-26 and the detection of blast cells in the bone marrow by morphologic criteria during remission induction therapy31 32 predict a higher incidence of relapse. In this study, we found that MRD studies significantly enhanced the prognostic information provided by the determination of circulating blasts during the early stages of remission induction chemotherapy. Thus, detection of MRD at the end of remission induction identified patients with higher relapse hazard, despite rapid clearance of circulating blasts.
Several methods for detecting MRD in patients with ALL have been proposed,2 but flow cytometric detection of leukemia-associated immunophenotypes and PCR amplification of antigen-receptor genes appear to be the most reliable. The flow cytometric assay described in this study also fulfills the requirements for a routinely and widely applicable technique because of its speed (a reliable result can be obtained within a few hours of sample collection) and its accuracy of cell quantitation.3 We have previously shown that measurements of MRD by flow cytometry and PCR are comparable,13 so that definitions of remission by either method should be equally valid. A major limitation of our MRD assay was its lack of applicability in a substantial proportion of newly diagnosed cases (approximately 40%), including mainly cases with B-cell phenotype. We have attempted to increase the number of assessable cases by using a dual laser flow cytometer,3which allows the simultaneous detection of 4 cell markers, and by identifying new leukemia-specific immunophenotypes.33Since the introduction of 4-color analysis, for example, successful studies were achieved with marrow samples of 68 of 72 consecutive ALL patients (E. Coustan-Smith and D. Campana, unpublished data, March 2000). Because PCR may detect residual leukemic cells in cases not amenable to flow cytometric investigation, and vice versa, we advocate applying the 2 techniques in tandem. This approach has enabled us to monitor MRD in the last 96 consecutive patients (E. Coustan-Smith, G. Neale et al, unpublished data, March 2000) and should eliminate the possibility of false-negative results due to immunophenotypic shifts (flow cytometry) or oligoclonality and clonal evolution (PCR).3,34 35
One of the most important challenges in leukemia treatment is to accurately distinguish patients who require more intensive (and potentially more toxic) therapy from those in whom high cure rates can be achieved with less intensive therapy. MRD studies provide direct measurements of leukemic cell responses to chemotherapy in individual patients, reflecting the combined effects of clinical, cellular, and pharmacologic variables. This information can be used to improve strategies of risk assessment and treatment selection in the management of children with ALL. Patients with less than 0.01% leukemic cells at the end of remission induction are likely to have an excellent treatment outcome, whereas alternative treatments should be considered for patients with high levels (ie, ≥1%) of MRD at the end of the induction phase or persistent disease during early continuation therapy. We suggest that cases with ≥0.01% leukemic cells at the end of remission induction should be closely monitored for changes in residual leukemic cell infiltrate as treatment progresses.
Supported by grants CA60419, CA21765, and CA20180 from the National Cancer Institute, and by the American Lebanese Syrian Associated Charities (ALSAC).
The publication costs of this article were defrayed in part by page charge payment. Therefore, and solely to indicate this fact, this article is hereby marked “advertisement” in accordance with 18 U.S.C. section 1734.
References
Author notes
D. Campana, Department of Hematology-Oncology, St Jude Children's Research Hospital, 332 N Lauderdale, Memphis, TN 38105; e-mail: dario.campana@stjude.org.

This feature is available to Subscribers Only
Sign In or Create an Account Close Modal