Abstract
A characteristic feature of neoplastic transformation is the loss of external control by cytokines and extracellular matrix of cellular differentiation, migration, and mitogenesis. Because suppressors of cytokine signaling (SOCS) proteins are negative regulators of cytokine-induced signaling, it has been hypothesized that an aberrant SOCS expression plays a role in neoplastic transformation. This study reports on a constitutive SOCS-3 expression in cutaneous T-cell lymphoma (CTCL) cell lines. SOCS-3 protein is constitutively expressed in tumor cell lines (but not in nonmalignant T cells) obtained from affected skin from a patient with mycosis fungoides (MF) and from peripheral blood from a patient with Sezary syndrome (SS). In contrast, constitutive SOCS-3 expression is not found in the leukemic Jurkat T-cell line, the MOLT-4 acute lymphoblastic leukemia cell line, and the monocytic leukemic cell line U937. Expression of SOCS-3 coincides with a constitutive activation of STAT3 in CTCL tumor cells, and stable transfection of CTCL tumor cells with a dominant negative STAT3 strongly inhibits SOCS-3 expression, whereas transfection with wild-type STAT3 does not. Moreover, the reduced SOCS-3 expression in cells transfected with the dominant negative STAT3 is associated with an increased sensitivity to interferon-α (IFN-α). In conclusion, evidence is provided for a constitutive SOCS-3 expression in cancer cells obtained from patients with CTCL. Moreover, the findings indicate that the aberrant expression of SOCS-3 is mediated by a constitutive activation of STAT3 in CTCL cells and affects the IFN-α sensitivity of these cells.
Introduction
A characteristic feature of neoplastic transformation is the loss of external control of cellular differentiation, migration, and mitogenesis. Via an autocrine production of growth factors or a constitutive activation of intracellular signaling pathways, tumor cells can gain independence of external growth factors. Moreover, through the development of resistance to cytokines, transformed cells can evade the influence of regulatory growth and differentiation signals.1 In early stage melanoma cell lines interleukin (IL)-6 functions as a growth inhibitor, but during tumor progression melanoma cells develop resistance to IL-6, and advanced-stage melanoma cell lines are resistant to growth inhibition by IL-6.2,3 Likewise, many tumors develop resistance to interferon-γ (IFN-γ) in vivo,4 and it has been suggested that IFN-γ resistance is a way for certain tumor cells to evade detection and elimination by the immune system.4 5
The suppressors of cytokine signaling (SOCS) proteins comprise a recently identified family of negative regulators of cytokine signaling (also referred to as the CIS/JAB or SSI family).6-8 They are characterized by a central SH2 domain and a C-terminal SOCS-box, and the SOCS family currently consists of 8 members (CIS and SOCS-1 to SOCS-7).9 Among the 8 family members, SOCS-1 and SOCS-3 are the most potent inhibitors of cytokine-induced signaling. Transfection experiments with overexpression of the relevant SOCS have demonstrated that SOCS-1 and to a lesser extent SOCS-3 are able to suppress signaling induced by an array of cytokines, including among others IL-2, IL-4, IL-6, IFN-γ, IFN-α, leukemia inhibitory factor (LIF), and growth hormone (GH).6,7,10-16 In contrast, the inhibitory potential of CIS is much more limited because CIS expression has only been shown to have an effect on erythropoietin (EPO), GH, prolactin (PRL), and IL-2–induced signaling.17-20 Regarding SOCS-2 and SOCS-4 to SOCS-7 there have until now been only a few reports on signaling inhibition mediated by these SOCS proteins.21 Because CIS is able to bind to the tyrosine phosphorylated EPO receptor in the same region as STAT5,18 it has been suggested that CIS inhibits signaling by simple competition for receptor binding sites. In contrast, SOCS-1 and SOCS-3 are able to bind directly to the kinase domain of JAK kinases thus inhibiting kinase activity probably by acting as a pseudosubstrate.22 23
Normally, transcription of SOCS genes is induced after stimulation with cytokines, and the expression of SOCSs is generally short-lived.21 The finding of STAT binding sites in the CIS, SOCS-1, and SOCS-3 promoters8,18,24 as well as the discovery that transfection with dominant negative STAT3 inhibits cytokine-induced expression of SOCS-1 and SOCS-38,24 indicates that STAT transcription factors play an essential role in transcription of the SOCS genes. Aberrant STAT activation is found in many malignancies,25and recently STAT3 was identified as being an oncogene itself.26 However, only little is known about the expression and possible function of SOCS proteins in tumor cells. In this study, we addressed whether abnormal STAT3 activation mediates SOCS expression in tumor cells. We show that tumor cell lines established from patients with cutaneous T-cell lymphoma (CTCL) have a constitutive expression of SOCS-3. SOCS-3 expression in these cells correlates with a constitutive activation of STAT3 and by transfection with a dominant negative STAT3, we show that SOCS-3 expression depends on a fully functional STAT3. Moreover, we show that the decrease in SOCS-3, caused by the dominant negative STAT3, correlates with an increased IFN-α sensitivity in the tumor cells.
Materials and methods
Antibodies and other reagents
Antibodies against SOCS-3 (M-20), STAT1 (E-23), and ERK2 (K-23) were from Santa Cruz Biotechnology (Santa Cruz, CA). Antibodies against p38 mitogen-activated protein (MAP) kinase and phospho-STAT1 (Y701) were from New England Biolabs (Beverly, MA). The STAT3 phosphor-tyrosine 705 (clone 9E12) antibody was from Nanotools (Denzlingen, Germany), and the STAT3 antibody was from Transduction Laboratories (Lexington, KY). Horseradish peroxidase (HRP)-conjugated secondary antibodies against mouse-IgG, rabbit-IgG, and goat-IgG were from DAKO (Glostrup, Denmark). IL-2 (proleukin) was purchased from Chiron (Emeryville, CA), and IL-4 was from Leinco (Ballwin, MO). JAK3 inhibitor I was from Calbiochem (San Diego, CA) and AG1478 was from Alexis (Läufel-Fingen, Switzerland). Human recombinant IFN-γ (rIFN-γ) was from R&D Systems (Minneapolis, MN) and human IFNα-2b (Introna) was from Schering-Plough (Kenilworth, NJ).
Cell lines and culture
Tumor T-cell lines established from skin biopsies from a patient with mycosis fungoides (MF) and from peripheral blood from a patient with Sezary syndrome (SS), have previously been described in detail.27-29 In this study we used 2 different MF tumor cell lines: one early culture (MyLa 3675), which is IL-2 dependent, and one long-term culture (MyLa 2000), which grows independently of cytokines. MyLa 2000 was cultured in RPMI 1640 (Sigma Chemical, St Louis, MO) supplemented with 10% fetal bovine serum (Life Technologies, Roskilde, Denmark), 2 mM l-glutamine (Sigma), 100 μg/mL penicillin (Sigma), and 100 μg/mL streptomycin (Sigma). MyLa 3675 was cultured in RPMI 1640 supplemented with 10% pooled human serum (HS) (Bloodbank, State University Hospital, Copenhagen, Denmark), 2 mM l-glutamine, 100 μg/mL penicillin, 100 μg/mL streptomycin, and 1000 U/mL IL-2. MyLa 1885 is a nonmalignant T-cell line established from peripheral blood from the same MF patient.29 It was cultured in RPMI 1640 supplemented with 10% HS, 2 mM l-glutamine, 100 μg/mL penicillin, 100 μg/mL streptomycin, 1000 U/mL IL-2, and 10 ng/mL IL-4. The tumor cell line established from the SS patient (SeAx 4405) was cultured as MyLa 3675. Prior to all experiments, MyLa 3675, MyLa 1885, and SeAx 4405 cells were “starved” for 18 hours in media supplemented with 10% HS, 2 mM l-glutamine, 100 μg/mL penicillin, and 100 μg/mL streptomycin, but without cytokines. MyLa 2000 cells were stably transfected by electroporation (960 μF, 240 V) with a dominant negative STAT3 (DNA binding mutant) or wild-type STAT3, and transfectants were selected by growth in media supplemented with geneticin (Life Technologies). The plasmids used for transfection (pCAGGSneo-HA-STAT3D and pCAGGSneo-HA-STAT3WT) have been described previously.30 The stable transfectants were cultured as the parental MyLa 2000 cells. The Jurkat cell line (J76.25.20) was generously provided by Dr Med Carsten Geisler and was cultured under the same conditions as MyLa 2000. Human thymocytes, derived from thymic tissue of children (age up to 2 years) undergoing cardiovascular surgery for congenital heart disease (as described previously31), were generously provided by Dr Med Carsten Röpke. Prior to the experiment, freshly isolated thymocytes were cultured for 3 days (RPMI 1640, 10% HS, 2 mM l-glutamine, 100 μg/mL penicillin, 100 μg/mL streptomycin) in the presence of 4 μg/mL phytohemagglutinin (PHA) (Wellcome, Beckenham, UK) at a cell density of 2 × 10⁶ cells/mL. The U937 and MOLT-4 cells were purchased as cell lysates (Santa Cruz Biotechnology).
Protein extraction and Western blotting
For protein extraction, cells were rapidly pelleted and lysed in ice-cold lysis buffer as described previously.32 The Western blotting procedure is described in detail elsewhere.33 Blots were evaluated using enhanced chemiluminescence according to the manufacturer's manual (Amersham, Buckinghamshire, UK).
Analysis of messenger RNA (mRNA) levels
Total cellular RNA was isolated using the RNeasy plant mini kit (Qiagen, Hilden, Germany). The RNA samples were treated with DNase (Promega, Madison, WI), followed by reverse transcription (RT) with Superscript II (Life Technologies) performed with 1 μg RNA, 3 μg Random primer (Life Technologies), 0.25 mM dNTP (Amersham), 10 U RNasine (Promega), and DTT and reaction buffer supplied with the reverse transcriptase. RT-negative controls were run in every polymerase chain reaction (PCR) experiment and did not yield a product, indicating the absence of contaminating genomic DNA. A total of 2% of each cDNA was subjected to hot start PCR performed with DyNAzyme II DNA polymerase (Finnzymes, Espoo, Finland) for amplification of CIS, SOCS-2, and SOCS-3, or with HotStarTaq DNA polymerase (Qiagen) for amplification of SOCS-1. Hot start PCR with the DyNAzyme II DNA polymerase was carried out by initial separation of the DNA polymerase from the rest of the reaction mixture, using DyNA wax (Finnzymes). Each PCR reaction was carried out with 0.2 μM of the relevant primers, 40 μM dATP, dGTP, and dTTP, 20 μM dCTP, 1.25 μ Ci [α-33P]dCTP (Amersham), and reaction buffers supplied with the respective DNA polymerases. Preliminary PCR experiments showed that the rate of amplification was linear for CIS, SOCS-1, SOCS-2, SOCS-3, and TBP (TATA binding protein = transcription factor IID) when applying fewer than 28 cycles (data not shown), and we chose to use 24 cycles in PCR experiments with CIS, SOCS-2, and SOCS-3 primers, and 26 cycles in PCR experiments with SOCS-1 primers. The PCR experiments with DyNAzyme consisted of an initial denaturation step (95°C, 10 minutes), followed by 24 cycles (denaturation 95°C, 30 seconds; annealing 55°C, 1 minute; elongation 72°C, 1 minute) and a single elongation step at 72°C for 7 minutes, whereas the PCR experiments with HotStarTaq were carried out with an initial denaturation step (95°C, 15 minutes), followed by 26 cycles (denaturation 94°C, 1 minute; annealing 55°C, 1 minute; elongation 72°C, 1 minute) and a single elongation step at 72°C for 10 minutes. The reaction mixtures were then mixed with loading buffer (0.03% bromophenol blue and 0.03% xylene cyanole in formamide) and loaded onto a 5% urea-acrylamide sequencing gel. The gels were subsequently exposed to a Kodak biomax film (Amersham) or to33P quantification by Phosphorimager analysis. DNA marker V (Boehringer Mannheim, Mannheim, Germany) and DNA marker VI (Boehringer Mannheim) were labeled using a 5′-end labeling kit (Amersham) and [γ-33P]ATP (Amersham) according to the manufacturer's manual. TBP was used as an internal standard to correct for unequal pipeting or loading or both, and SOCS/TBP is used as the relative SOCS expression. The following primers were used for the specific amplification of CIS, SOCS-1, SOCS-2, SOCS-3, and TBP:CIS 5′-cggctggactctaactgct-3′ and 5′-aaggggtactgtcggaggta-3′ (350-bp product), SOCS-1 5′-cacgcacttccgcacattc-3′ and 5′-agcagctcgaggaggcagtc-3′ (297-bp product), SOCS-25′-caggatggtactggggaagt-3′ and 5′-tggacctgtccgcttatc-3′ (284-bp product), SOCS-3 5′-gagccccctccttcccctcgc-3′ and 5′-ggtccaggaactcccgaatg-3′ (264-bp product), TBP5′-tgacccccatcactcctg-3′ and 5′-ggttcgtggctctcttatcc-3′ (191-bp product).
Results
Constitutive expression of SOCS mRNA in CTCL cell lines
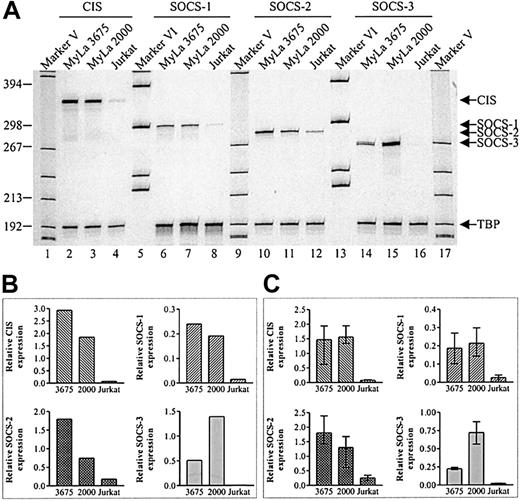
To investigate the expression of CIS, SOCS-1, SOCS-2, and SOCS-3 mRNA in CTCL tumor cell lines, total cellular RNA was subjected to RT-PCR and quantitated as described in “Materials and methods.” As shown in Figure 1, a high constitutive expression of CIS, SOCS-1, SOCS-2, and SOCS-3 mRNA was found in 2 tumor cell lines (MyLa 2000 and MyLa 3675) obtained from affected skin from a patient with MF, which is the most common form of CTCL. The late culture MF tumor cell line (MyLa 2000) expressed higher levels of SOCS-3 and lower levels of CIS and SOCS-2 as compared to the early culture cell line (MyLa 3675), whereas the relative SOCS-1 expression was comparable between the 2 cell lines (Figure 1B). Jurkat cells, which is a leukemic T-cell line, were included in the experiments to address whether a constitutive expression of SOCS mRNA is found in all malignant T-cell lines. Of the 4 SOCSs of interest, only SOCS-2 was readily detected in Jurkat cells (Figure 1A, lane 12). However, this expression of SOCS-2 is low compared to the ones found in MyLa 2000 and MyLa 3675. Essentially identical findings were obtained in 3 additional, independent experiments (Figure 1C).
Constitutive expression of SOCS mRNA in MF tumor cell lines.
(A) Total cellular RNA was isolated from unstimulated cells and subjected to RT-PCR with the indicated SOCS primers. As internal standard primers specific for TBP were used. (B) Band intensities from the gel in panel A were quantitated using a phosphor imager and SOCS expression was calculated relative to TBP expression. (C) Relative SOCS expression calculated from 3 independent experiments (mean + range).
Constitutive expression of SOCS-3 protein in CTCL tumor cell lines but not in nonmalignant cells
To address whether the constitutive SOCS expression is also evident at the protein level in the CTCL tumor cell lines, whole cell lysates from MyLa 3675 and MyLa 2000 as well as from an autologous nonmalignant T-cell line (MyLa 1885) were analyzed by Western blotting with SOCS-specific antibodies. As shown in Figure2A, SOCS-3 protein, which appears as a double band, was expressed in both tumor cell lines but not in the nonmalignant cell line. Moreover, in agreement with the differences in SOCS-3 expression, found at the mRNA level, expression of SOCS-3 protein was higher in MyLa 2000 as compared to MyLa 3675. Stripping and reprobing of the membrane with antibodies directed against the ERK1/2 and p38 MAP kinases showed that the malignant and nonmalignant cell lines express comparable amounts of these MAP kinases, suggesting that the differences in SOCS-3 expression were not caused by differences in the amount of loaded protein.
Expression of SOCS-3 protein correlates with STAT3 activation.
Unstimulated cells were lysed and whole cell lysates from 1 × 10⁶ cells (A) or 0.5 × 10⁶ cells (B) were subjected to Western blotting with the indicated antibodies.
Expression of SOCS-3 protein correlates with STAT3 activation.
Unstimulated cells were lysed and whole cell lysates from 1 × 10⁶ cells (A) or 0.5 × 10⁶ cells (B) were subjected to Western blotting with the indicated antibodies.
Because the MF tumor cell lines have a constitutive active STAT3,33 and because STAT3 is implicated in the cytokine-induced expression of SOCS-3,24 the cell lysates were also analyzed using an antibody directed against tyrosine phosphorylated (active) STAT3 (PY-STAT3). In accordance with previous findings,33 the late culture cell line (MyLa 2000) has a higher constitutive level of STAT3 phosphorylation than the early culture cell line (MyLa 3675), even though the 2 cell lines express equal amounts of STAT3 (Figure 2B). The differences in STAT3 activation correlate with the differences in SOCS-3 expression, and the constitutive SOCS-3 expression could thus be a consequence of the constitutive active STAT3.
Although CIS, SOCS-1, and SOCS-2 mRNA were detected in both MF tumor cell lines, we were unable to detect these SOCSs at the protein level when using antibodies, which were able to detect SOCS expression in 293 cells transiently transfected with the particular SOCS (data not shown).
Because serum preparations might contain cytokines/growth factors, STAT3 activation and SOCS-3 expression were also examined in serum-deprived cells. However, neither STAT3 activation nor SOCS-3 expression was decreased in these cells (data not shown), thereby confirming that the observed activation/expression is not a consequence of a serum-contained factor.
Constitutive SOCS-3 expression in CTCL cells from an SS patient but not in other hematopoietic tumor cell lines
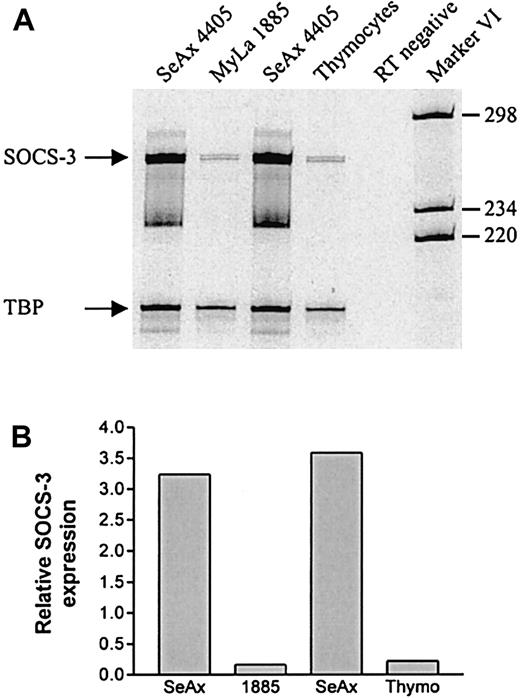
Next, we looked for SOCS-3 expression in a cell line (SeAx 4405) established from a patient with SS, which is a leukemic variant of CTCL. Like the MF tumor cell lines, the SeAx 4405 cell line also has a constitutive active STAT3 (K. Eriksen, manuscript submitted). Total cellular RNA from SeAx 4405 cells as well as from the nonmalignant T-cell line, MyLa 1885, and a bulk culture of human thymocytes, were subjected to RT-PCR and quantitated as above. As shown in Figure3, SeAx cells have a high constitutive expression of SOCS-3 mRNA. In contrast, the thymocytes and the nonmalignant MyLa 1885 cells express little SOCS-3 mRNA, the latter being in accordance with the lack of SOCS-3 protein expression in MyLa 1885, depicted in Figure 2A.
High expression of SOCS-3 mRNA in SeAx 4405 cells.
(A) Total cellular RNA was isolated from unstimulated cells and subjected to RT-PCR with SOCS-3 and TBP-specific primers. The RT-negative sample was treated as the other samples except that RT was not added in the cDNA synthesis. The RNA samples used in lanes 1 and 3, respectively, were from 2 independent experiments. (B) Band intensities from the gel in panel A were quantitated and SOCS-3 expression was calculated relative to TBP expression.
To address whether SOCS-3 is also evident at the protein level in the SeAx cells, Western blotting experiments were performed with the anti-SOCS-3 antibody as above. As shown in Figure 4, SOCS-3 protein is constitutively expressed in SeAx 4405 cells (lane 1), whereas it is not detected in other hematopoietic tumor cell lines including the Jurkat cells, an acute lymphoblastic leukemia cell line (MOLT-4), and a monocytic leukemia cell line (U937) (lanes 2-5). The membranes were also examined using the antibody directed against the active STAT3. It was hereby confirmed that the SeAx cells have a constitutive active STAT3. Furthermore, it was shown that the tumor cell lines, which have no expression of SOCS-3, also do not have an active STAT3. The amount of total STAT3 varied among the cell lines (Figure 4, middle row), but by reprobing with antibodies against the ERK1/2 and p38 MAP kinases, the loading of equal amounts of lysates was confirmed.
Constitutive SOCS-3 protein expression in CTCL tumor cell lines.
Unstimulated cells were lysed and whole cell lysates from 1 × 10⁶ cells (140 μg protein of U937 and MOLT-4 lysates) were loaded onto 2 separate sodium dodecyl sulfate-polyacrylamide gels, run separately, and analyzed separately by Western blotting with the indicated antibodies.
Activated STAT3 mediates SOCS-3 expression in CTCL cells
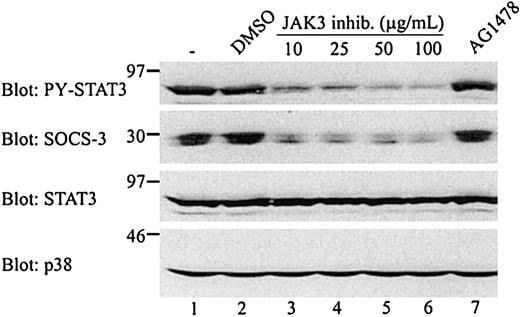
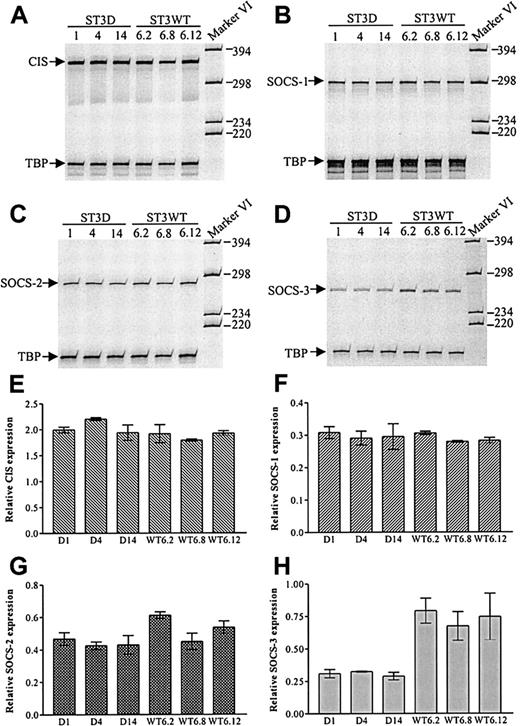
The results shown in Figures 2 and 4indicated that there is a correlation between STAT3 activation and SOCS-3 expression in CTCL tumor cells, which is in agreement with the finding that STAT3 is implicated in the LIF-induced SOCS-3 expression in AtT-20 cells.24 As shown in Figure5, inhibition of the tyrosine phosphorylation of STAT3 by a JAK3 inhibitor is associated with an inhibition of SOCS-3 expression. Indeed, the constitutive SOCS-3 expression is almost completely blocked at concentrations of 100 μg/mL, that is, at concentrations that block the constitutive tyrosine phosphorylation of STAT3. To address more directly the involvement of STAT3 in SOCS expression in CTCL tumor cells, SOCS expression was investigated in MyLa 2000 cells stably transfected with either a dominant negative STAT3 (ST3D) or wild-type STAT3 (ST3WT). SOCS mRNA expression was compared in 6 independent ST3D and ST3WT transfectant cell lines. As shown in Figure6A-D, ST3D and ST3WT cells express comparable levels of CIS, SOCS-1, and SOCS-2 mRNA, whereas ST3D cells express lower levels of SOCS-3 mRNA as compared to ST3WT cells. Essentially identical results were obtained in an additional, independent experiment, and as shown in Figure 6H, the expression of SOCS-3 mRNA is decreased in all 3 ST3D cell lines as compared to the ST3WT cell lines.
Inhibition of SOCS-3 expression and STAT3 activation by a JAK3 inhibitor.
MyLa 2000 cells were incubated with the indicated inhibitors for 1 hour at 37°C. The JAK3 inhibitor was used at 10, 25, 50, or 100 μg/mL and AG1478 was used at 200 ng/mL. Both inhibitors were diluted in DMSO and the final DMSO concentration in all samples were 1:400. One sample was treated with DMSO 1:400 alone. The cells were subsequently lysed and whole cell lysates of 1 × 10⁶ cells were subjected to Western blotting with the indicated antibodies.
Decreased SOCS-3 mRNA expression in MyLa 2000 cells stably transfected with dominant negative STAT3.
Total cellular RNA from 3 different ST3D cell lines (ST3D1, ST3D4, and ST3D14) and 3 different ST3WT cell lines (ST3WT6.2, ST3WT6.8, and ST3WT6.12) was subjected to RT-PCR with CIS (A), SOCS-1 (B), SOCS-2 (C), or SOCS-3 (D) specific primers. TBP-specific primers were used as internal standard. (E-H) Band intensities from the gels in panels A to D plus from an additional and independent experiment were quantitated and SOCS expression was calculated relative to TBP expression (shown values are mean + range).
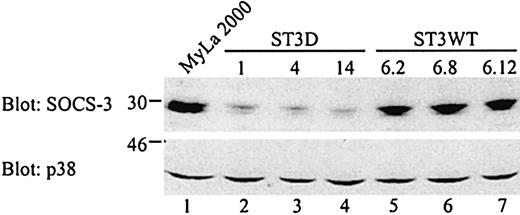
To investigate whether the effect of the dominant negative STAT3 on SOCS-3 expression is also evident at the protein level, whole cell lysates from the ST3D and ST3WT cell lines plus from untransfected MyLa 2000 cells, were analyzed. In agreement with the results obtained at the mRNA level, SOCS-3 protein expression is clearly affected in the cells expressing the defective STAT3 (Figure7). In contrast, the expression of p38 MAP kinase was comparable in all transfectant cell lines and in untransfected cells.
Decreased SOCS-3 expression in MyLa 2000 cells stably transfected with a dominant negative STAT3.
Whole cell lysates from unstimulated MyLa 2000 or transfected cells (2.5 × 10⁶ cells/sample) were subjected to Western blotting with SOCS-3 or p38 MAP kinase specific antibodies.
Decreased SOCS-3 expression in MyLa 2000 cells stably transfected with a dominant negative STAT3.
Whole cell lysates from unstimulated MyLa 2000 or transfected cells (2.5 × 10⁶ cells/sample) were subjected to Western blotting with SOCS-3 or p38 MAP kinase specific antibodies.
Correlation between SOCS-3 expression and IFN-α sensitivity
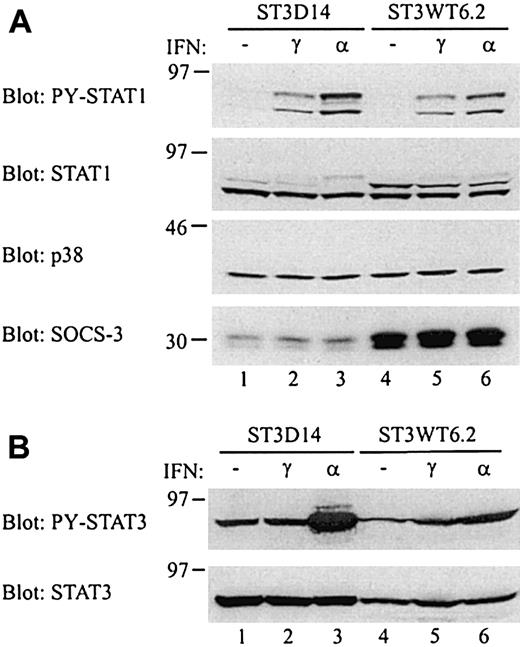
SOCS-3 is able to inhibit interferon-induced signaling,13,14 and it has been shown that cells stably transfected with SOCS-3 have a reduced sensitivity to IFN-α and also to IFN-γ, although to a lesser extent.14 If the constitutive SOCS-3 expression in CTCL tumor cells affects the IFN sensitivity of the cells, then ST3D cell lines would be more sensitive to IFNs as compared to ST3WT cell lines, due to the large difference in SOCS-3 expression. To investigate this, whole cell lysates from cells stimulated with either IFN-α or IFN-γ were analyzed by Western blotting with an antibody, which recognizes the tyrosine phosphorylated (active) STAT1 (PY-STAT1). Both IFN-α and IFN-γ induce activation of STAT1, and as can be seen from Figure8A, IFN-α induces a higher activation of STAT1 in ST3D14 cells than in ST3WT6.2 cells (upper row, compare lane 3 and 6). In contrast, the STAT1 activation in response to IFN-γ is similar in the 2 cell lines (lanes 2 and 5). Stripping and reprobing the membrane with antibodies against STAT1, p38 MAP kinase, and SOCS-3 confirmed the loading of equal amounts of lysate as well as the difference in SOCS-3 expression between the 2 cell lines (the very weak appearance of the upper STAT1 band in ST3D14 was not seen in other experiments). Besides activation of STAT1, IFN-α also induces STAT3 activation in certain cells.34 Analysis of the STAT3 activation in ST3D14 and ST3WT6.2 cells showed that IFN-α induces a markedly higher level of STAT3 activation in ST3D14 cells than in ST3WT6.2 cells (Figure 8B). Due to a higher expression of the exogenous STAT3, the ST3D14 cells express higher amounts of STAT3 as compared to ST3WT6.2 cells. However, this difference in STAT3 expression does not account for the large difference in IFN-α–induced STAT3 activation. Thus, the increased IFN-α sensitivity in ST3D14 cells is evident when looking at both STAT1 and STAT3 activation levels. To ascertain that the increased IFN-α responsiveness in the ST3D14 cells was not due to alterations in receptor expression, IFN-α receptor expression was analyzed. No differences in receptor expression were found between the ST3D14 and ST3WT6.2 cell lines (data not shown).
Increased IFN-α sensitivity in ST3D14 cells.
(A) ST3D14 and ST3WT6.2 cells were stimulated with 100 ng/mL IFN-γ or 5000 U/mL IFN-α for 10 minutes at 37°C. Whole cell lysates from 0.5 × 10⁶ cells were subjected to Western blotting with the indicated antibodies. (B) ST3D14 and ST3WT6.2 cells were stimulated as above. Whole cell lysates from 0.5 × 10⁶ cells (ST3D14) or 0.75 × 10⁶ cells (ST3WT6.2) were subjected to Western blotting with the indicated antibodies.
Discussion
In the present study, we show that CTCL lines constitutively express SOCS-3. Thus, SOCS-3 expression was detected in 3 CTCL tumor cell lines established from patients with MF and SS, whereas it was absent in autologous nonmalignant T cells as well as in tumor cell lines from other malignancies. Because SOCS-3 expression seemed to correlate with STAT3 activation, we addressed whether the constitutive SOCS-3 expression was mediated by STAT3. Indeed, inhibition of STAT3 tyrosine phosphorylation by an inhibitor of JAK kinases correlated with inhibition of SOCS-3 expression. More importantly, stable transfection of CTCL cells with a dominant negative STAT3 provided direct evidence for the implication of STAT3 in the constitutive expression of SOCS-3. This conclusion is in agreement with the recent findings that STAT3 regulates cytokine-induced SOCS-3 transcription24 as well as the present observation that SOCS-3 was not expressed in malignant and nonmalignant cell lines, which did not have a constitutive active STAT3. In a recent paper, Schuringa and colleagues35reported on constitutive expression of SOCS-1 and SOCS-3 mRNA in acute myelogenous leukemia (AML) cells, and in agreement with our observations, they were only able to detect SOCS expression in cells with a constitutive active STAT3. However, they were unable to show a direct association between STAT3 activation and SOCS expression. Moreover, they did not address whether SOCS mRNA was translated into protein and played a functional role in AML cells.
The CTCL tumor cell lines also had a high constitutive expression of CIS, SOCS-1, and SOCS-2 mRNA. We were, however, unable to detect these SOCSs at the protein level in these cell lines. Thus, CIS, SOCS-1, and SOCS-2 proteins were undetectable in Western blotting using antibodies recognizing the SOCS of interest. Although we cannot formally rule out the possibility that CIS, SOCS-1, and SOCS-2 proteins are expressed at low levels in CTCL tumor cell lines, our observations suggest that these SOCS mRNAs may not be efficiently translated into protein. It was recently shown that SOCS-1 expression, in addition to regulation at the transcriptional level, is also regulated at the translational level.36 Alternatively, posttranslational modifications might mask epitopes recognized by the CIS–, SOCS-1–, and SOCS-2–specific antibodies.
Because SOCS-3 appeared as a double band in Western blotting, it is possible that CTCL cells express 2 SOCS-3 isoforms or that SOCS-3 is subjected to posttranslational modifications such as proteolytic cleavage or phosphorylation in these cell lines. SOCS-3 becomes tyrosine phosphorylated in response to IL-2 and EPO stimulation,10,23 and it was shown that JAK1, JAK2, and Lck are able to phosphorylate SOCS-3.10 We have, however, been unable to detect tyrosine phosphorylation of SOCS-3 in the CTCL tumor cells, suggesting that posttranslational modifications other than tyrosine phosphorylation are responsible for the appearance as a double band.
Recently, STAT3 was shown to function as an oncogene in vivo26 and a constitutive activation of STAT3 has been reported in a number of hematologic and nonhematologic malignancies.25 Although STAT3 has been implicated in the regulation of several genes involved in cell cycle regulation, cell differentiation, and apoptosis,37 it is not fully understood how an aberrant STAT3 activation drives cells to undergo malignant transformation. The present finding that STAT3 mediates a constitutive expression of SOCS-3 in CTCL tumor cell lines, suggests the possibility that SOCS-3 plays a role in STAT3 mediated oncogenesis. A characteristic feature of malignant transformation is the loss of external control from cytokines or other factors,1 and experimental data show that tumors can evade the influence of regulatory growth and differentiation signals through development of resistance to cytokines.2 3 It is possible that a constitutive SOCS-3 expression changes cytokine receptor sensitivity or the balance between different cytokine responses in a way that promotes malignant transformation. In this report, we show that the decreased SOCS-3 expression in CTCL cells expressing a dominant negative STAT3 is associated with an increased IFN-α but not IFN-γ sensitivity, thus indicating that the constitutive SOCS-3 expression in CTCL tumor cells affects the IFN-α responsiveness of the cells. Our preliminary findings suggest that SOCS-3 (and PY-STAT3) might also be constitutively expressed in vivo in CTCL patients. Thus, in one of 3 patients with SS, SOCS-3 protein was expressed in cells isolated directly from peripheral blood (data not shown). Studies are now in progress to investigate whether SOCS-3 expression correlates with disease progression in CTCL.
In conclusion, we provide evidence of a high constitutive SOCS expression in cancer cell lines established from CTCL patients. Our results show that the aberrant SOCS-3 expression is mediated by STAT3, suggesting that this might be a general feature for cancer cells with a constitutive active STAT3. Furthermore, our results indicate that the aberrant SOCS-3 expression affects the IFN-α sensitivity of these cells, thereby making them less responsive. Thus, it could be hypothesized that a constitutive SOCS-3 expression, and the thereby increased IFN-α resistance, is one of the benefits that tumor cells gain from having a constitutive active STAT3.
Acknowledgment
We thank Koichi Nakajima for providing the vectors containing wild-type and dominant negative STAT3.
Supported in part by grants from the Weimann Foundation (M.N.), the Benzon Foundation, the Carlsberg Foundation, the Leo Dannin and wife legat, the Danish Medical Research Council, the Novo Nordic Foundation, the Danish Medical Associations Research Foundation, the Danish Cancer Research Foundation, the Danish Cancer Society, and the National Institute of Health (grant no. CA89194). C.B. was a recipient of a scholarship from the Danish Cancer Society.
C.B. and M.N. contributed equally to this work.
The publication costs of this article were defrayed in part by page charge payment. Therefore, and solely to indicate this fact, this article is hereby marked “advertisement” in accordance with 18 U.S.C. section 1734.
References
Author notes
Niels Ødum, Institute of Medical Microbiology and Immunology, Panum 22.5, University of Copenhagen, Blegdamsvej 3, DK2200 Copenhagen N, Denmark; e-mail: n.odum@immi.ku.dk.



This feature is available to Subscribers Only
Sign In or Create an Account Close Modal