Abstract
The most common chromosomal abnormality of infant acute lymphoblastic leukemia (ALL) is the t(4;11)(q21;q23) that gives rise to the MLL/AF4 fusion gene. Leukemic blasts expressing MLL/AF4 are arrested at an early progenitor stage with lymphoid or monocytoid characteristics. A novel B-lineage ALL cell line termedB-lineage–3 (BLIN-3) requiring human bone marrow (BM) stromal cell contact and interleukin-7 (IL-7) for optimal proliferation has been established. BLIN-3 cells have a CD19+/CD10− phenotype typical of infant ALL, and they harbor the t(4;11)(q21;q23) chromosomal translocation. Reverse transcription–polymerase chain reaction and Western blot analysis confirmed the presence of the MLL/AF4 fusion mRNA and protein in BLIN-3. Initial BLIN-3 cultures had a pro-B cell phenotype and did not express cytoplasmic or surface μ heavy chain. After approximately 5 months in culture on BM stromal cells plus IL-7, BLIN-3 sublines emerged expressing μ heavy chain and VpreB on the cell surfaces (ie, pre-B-cell receptor [BCR]+). BLIN-3 cells expressing pre-BCR had the t(4;11)(q21;q23) translocation and expressed the MLL/AF4 fusion protein. Cross-linking the BLIN-3 pre-BCR led to enhanced cell proliferation, demonstrating that BLIN-3 expressed a functional pre-BCR. Increased acquisition of surface pre-BCR in BLIN-3 sublines was associated with loss of DJ rearrangements and the appearance of VDJ rearrangements. These results indicate that expression of the MLL/AF4 fusion protein is compatible with BM stromal cell and cytokine dependency, functional immunoglobulin gene segment rearrangement, and subsequent expression of a potentially diverse antigen receptor repertoire. Thus, the expression of MLL/AF4 is compatible with the normal developmental program of human B-lineage cells.
Introduction
Mammalian B-cell development is characterized by the ordered rearrangement of heavy- and light-chain immunoglobulin gene segments that encode cell surface receptors critical for antigen-independent and antigen-dependent development (Rajewsky1 and references therein). The ordered stages of immunoglobulin gene segment rearrangement occur in human B-lineage progenitors at distinct levels of maturation (Bertrand et al2 and and LeBien3 and references therein). CD34+/CD19− bone marrow (BM) lymphoid cells harbor DJH rearrangements4,5 and express cytoplasmic immunoglobulin (Ig)α6 and VpreB proteins.7 However, the degree to which this population is committed to the B-lineage is uncertain. The well-characterized CD19+/CD34+ pro-B population includes some cells with VDJH rearrangements4 and undergoes modest survival and proliferative responses to a variety of cytokines (eg, interleukin-3 [IL-3], IL-7, FLT3-ligand) and BM stromal cell–derived molecules.3 The CD19+/CD34− pre-B population contains large and small cells expressing cytoplasmic μ heavy-chain protein. A minority of pre-B cells express cell surface μ heavy chains and Ψ light chains (ie, VpreB and λ5) to form the pre-B-cell receptor (BCR).7 The small pre-B population is enriched for cells undergoing κ/λ light-chain gene rearrangement8 and are the immediate precursors of immature B cells expressing the BCR.
Human acute lymphoblastic leukemia (ALL) frequently involves clonal expansion of a CD19+ B-lineage cell at one of several stages of B-cell development.3,9,10 Infant acute leukemia is a malignancy with distinct biologic and clinical features, and 60% to 70% of patients harbor rearrangements of the mixed-lineage leukemia (MLL) gene at 11q23.9-11 The ALL subtype of infant acute leukemia frequently includes the t(4;11)(q21;q23) cytogenetic abnormality, characterized by expression of the MLL/AF4 fusion protein.9-11 MLL is a large protein (approximately 430 kd) with a complex domain structure that includes a DNA-binding AT hook domain, a methyltransferase domain, and a trithoraxhomology (SET) domain.12-14 Mice heterozygous for anMll null allele have defects in Hox gene expression and have subtle homeotic malformations,15consonant with the role of the homologous Drosophila protein Trithorax in maintaining clustered homeotic gene expression. The AF4 protein contains nuclear localization and guanosine triphosphate (GTP)–binding domains,16,17 but little is known about its function. Homozygous disruption of the murine Af4 gene leads to severe inhibition of thymocyte development and modest inhibition of B-cell development.18 The MLL/AF4 fusion protein invariably preserves the AT hook and methyltransferase MLL domains and the GTP-binding and nuclear localization AF4 domains. The precise functional role of MLL/AF4 in the oncogenesis of infant ALL is unknown. However, studies with an MLL-lacZ fusion protein have linked neoplastic transformation to aberrant activation ofMLL target genes, and they support a general gain-of-function role for MLL independent of its fusion partner.19
Infant ALL leukemic cells generally express a CD19+/CD10− B-lineage phenotype accompanied by the coexpression of myeloid and monocytoid gene products such as myeloperoxidase.11 For this reason, infant ALL has been considered of mixed lineage. The MLL/AF4 fusion protein could therefore target a lymphohematopoietic progenitor not yet fully committed to the B-lymphoid lineage, block an early stage in B-cell development characterized by the retention of myeloid gene expression, or induce myeloid gene expression in a committed B-lineage progenitor.
We have previously established a human BM stromal cell-dependent culture system for establishing pre-B ALL cell lines that retain the ability to respond to BM stromal cell-derived signals.20Using our human BM stromal cell culture system, we herein describe the establishment and characterization of a new B-lineage ALL cell line designated B-lineage–3 (BLIN-3). Both the original BM leukemic blasts and the BLIN-3 cell line contain the t(4;11)(q21;q23) cytogenetic abnormality. Remarkably, BLIN-3 cells manifest a normal developmental program characterized by preservation of the response to BM stromal cell-derived signals and IL-7, functional immunoglobulin gene segment rearrangement, and acquisition of surface expression of the μ-Ψ light-chain pre-BCR.
Materials and methods
Cell culture and cell lines
The protocols used to establish and maintain freshly isolated human BM stromal cell cultures have been described.20,21 A cryopreserved BM aspirate from a 3-month-old girl in whom infant ALL was diagnosed, was thawed and plated onto freshly isolated human BM stromal cells20,21 or onto murine S17 stromal cells22 in the absence or presence of 10 ng/mL human recombinant IL-7. Leukemic blasts were plated at 5 × 10⁴ cells/well in X-VIVO 10 serum-free medium (Bio-Whittaker, Walkersville, MD).
BLIN-1 and BLIN-2 pre-B ALL cell lines were established in this laboratory.20,23 The t(4;11) ALL cell lines RS4;1124 and SEMK225 were kindly provided by John H. Kersey (University of Minnesota Cancer Center). RAMOS and Daudi B-lymphoma cell lines were obtained from the American Tissue Type Culture Collection (Rockville, MD). With the exception of the BM stromal cell–dependent BLIN-2 cell line, all cell lines were maintained in standard suspension culture in RPMI-1640–10% fetal bovine serum.
Flow cytometry
Flow cytometry was conducted using a FACSCalibur (Becton Dickinson, Mountain View, CA) as previously described.20,21 The VpreB-specific monoclonal antibody (mAb), VpreB8, was kindly provided by Y.-H. Wang and M. D. Cooper (University of Alabama at Birmingham).7 For cytoplasmic staining of immunoglobulin light chains, cells were permeabilized with 0.5% saponin and were stained with a 1:20 dilution of goat anti–human κ-fluorescein isothiocyanate (FITC; Southern Biotech Associates, Birmingham, AL) or were stained with a 1:20 dilution of mouse antihuman λ (Southern Biotech) revealed with goat anti–mouse immunoglobulin-FITC (Southern Biotech). TdT was detected in cells permeabilized with Fix and Perm (Caltag, Burlingame, CA) and was incubated with mouse anti–human TdT-FITC (Supertechs, Bethesda, MD).
Western blot analysis of AF4 and MLL/AF4 protein expression
Cells were lysed in RIPA buffer containing 10 mM Tris-HCl, pH 8.0, 150 mM NaCl, 1 mM EDTA, 1% NP-40, 0.5% sodium deoxycholate, and 0.1% sodium dodecyl sulfate (SDS). The following protease inhibitors were included: aprotinin (22 μg/mL), phenylmethylsulfonyl fluoride (1 μg/mL), iodoacetamide (0.01 μM), pepstatin A (1 μg/mL), and leupeptin (1 μg/mL). All protease inhibitors were purchased from Sigma Chemical (St Louis, MO). Eighty micrograms total cellular protein was electrophoresed in each lane of a 6% SDS-polyacrylamide gel electrophoresis (PAGE) gel with a 3% stacking gel, and then Western blot transfer to nitrocellulose membranes was performed. Membranes were blocked at 4°C overnight in 5% (wt/vol) nonfat milk dissolved in 1× TBST (50 mM Tris, 150 mM NaCl, 0.1% Tween-20). The blots were then incubated at room temperature with a mouse anti–human AF4 mAb (designated N5C) diluted in 5% milk–TBST. The anti-AF4 mAb was made by immunizing mice with a glutathione-S-transferase (GST)–AF4 fusion protein encompassing AF4 amino acids 507 to 607. The N5C anti-AF4 mAb recognizes AF4 and MLL/AF4 in Western blotting and exhibits a punctate nuclear staining previously observed with a rabbit anti-AF4 antiserum.26 The N5C mAb was a kind gift of Quanzhi Li and John H. Kersey (University of Minnesota Cancer Center). After a 45-minute wash in 1× TBST at room temperature, the membranes were incubated for 90 minutes at room temperature with a 1:5000 dilution of sheep anti–mouse IgG conjugated to horseradish peroxidase (Amersham Life Science, Arlington Heights, IL) in 1× TBST. Staining was revealed by chemiluminescence using SuperSignal Chemiluminescent Substrate (Pierce, Rockford, IL).
Polymerase chain reaction assay for immunoglobulin gene segment rearrangement
The polymerase chain reaction (PCR) assay for examining IgH gene segment rearrangement has been described.4 Briefly, cells were lysed directly in PCR buffer consisting of 10 mM Tris-HCl, pH 8.0, 1.5 mM MgCl2, 50 mM KCl, 0.45% NP-40, and 0.45% Tween-20 at a concentration of 1 × 10⁴ cells/50 μL buffer. Samples were treated with 10 μg/mL proteinase K (Boehringer Mannheim, Indianapolis, IN) at 56°C for 1 hour, followed by heat inactivation at 90°C for 15 minutes. PCR reactions used 20 μM 5′ and 3′ primers, 10 mM dNTP, and 2.5 U Taq polymerase (Gibco-BRL, Gaithersburg, MD). Each PCR consisted of 30 cycles of denaturation at 95°C for 1 minute, annealing at 56°C for 1 minute, and extension at 72°C for 1 minute. A final extension for 7 minutes at 72°C was performed. PCR primer sequences used to detect DJ and VDJ rearrangements have been described.4 27-29
Reverse transcription–polymerase chain reaction
RNA isolation, cDNA synthesis, and reverse transcription–polymerase chain reaction (RT-PCR) were conducted as previously described.30 Annealing temperatures and cycle conditions for each primer pair were optimized such that the PCR was in the linear range of amplification. Amplification primers for recombination activating gene 1 (RAG-1), RAG-2, TdT, VH family specific primers, Vκ, and Cκ have been published previously.4,27-29 Primers used to detect expression of the MLL/AF4 fusion gene were MLL-E5′ (5′AAGCCCGTCGAGGAAAAG3′) and AF4-D (5′CGTTCCTTGCTGAGAATTTG3′), as described by van Dongen et al.31
Ten microliters each PCR product was separated on a 1.5% agarose gel and transferred to a Nytran membrane (Schleicher and Schuell, Keene, NH). After standard prehybridization, the blots were hybridized at 42°C with oligonucleotide probes labeled with digoxigenin (DIG) using the DIG oligonucleotide 3′-end labeling kit (Boehringer Mannheim) according to the manufacturer's instructions. After washing at 42°C, hybridization signals were revealed using the DIG luminescence detection kit for nucleic acids (Boehringer Mannheim) according to the manufacturer's instructions. Internal oligonucleotide probes used to detect specific amplified products have been reported.4 27-29
Cytogenetics
Metaphase chromosomes were G-banded using Wright stain, as described.20
Results
Establishment of the BLIN-3 cell line
The regulation of leukemic cell survival and proliferation by the BM microenvironment are poorly understood. We have approached this problem by establishing B-lineage ALL cell lines that retain a dependency on normal human BM stromal cells for survival and proliferation.2,20 Using our previously described strategy,20 we now report the establishment and characterization of a new cell line designated BLIN-3. Cryopreserved leukemic blasts from a 3-month-old girl with t(4;11)(q21;q23) infant ALL were plated onto human BM stromal cells or the murine S17 stromal cell line,22 in the absence or presence of IL-7. Two weeks after initial plating, the S17 cultures showed little microscopic evidence of leukemic cell survival and were discarded. At the same time leukemic blasts plated onto human BM stromal cells alone showed no increase compared with input cell number, but BM stromal cell cultures supplemented with IL-7 supported a 3-fold increase in cell number (data not shown). The leukemic blasts could then be passaged onto fresh human BM stromal cells supplemented with IL-7. The cell line was designated BLIN-3 after successful passage. Early passages of BLIN-3 were CD10−/CD11b−/CD15+/CD19+/CD20−/CD21−/CD22±/CD33−/CD38+/CD40±(Figure 1). BLIN-3 cells were bimodal for CD34 expression (Figure 1), and CD34 expression was lost on prolonged culture (data not shown). Early passages of BLIN-3 did not express cytoplasmic or surface μ heavy chains and did not express the VpreB subunit of the Ψ light chain. Cytogenetic analysis revealed a 47,XX,+X, t(4;11)(q21;q23) karyotype, consistent with a classicalMLL/AF4 translocation.
Cell surface antigen expression by early-passage BLIN-3 cells.
The bar labeled M1 denotes staining by the isotype-matched control.
Cell surface antigen expression by early-passage BLIN-3 cells.
The bar labeled M1 denotes staining by the isotype-matched control.
BLIN-3 requires bone marrow stromal cell contact and IL-7 for optimal survival and proliferation
Figure 2 shows the survival and proliferation characteristics of BLIN-3. BLIN-3 cells cultured in medium alone underwent a kinetically slow rate of cell death and were 95% to 99% dead by day 7. Inclusion of IL-7 slowed BLIN-3 cell death, suggesting that IL-7 transduced a survival signal. BLIN-3 cells survived in the presence of BM stromal cells but failed to undergo appreciable expansion. However, consistent with the conditions used to establish the cell line, the inclusion of IL-7 facilitated proliferative expansion of BLIN-3 cells on BM stromal cells. Thus, BLIN-3 cells have preserved a response to human BM stromal cells and IL-7 that is similar to the response of normal human pro-B cells.32
BLIN-3 cells require human BM stromal cells for survival and BMSC + IL-7 for proliferation.
BLIN-3 cells were plated at 1.0 × 10⁴/well in X-VIVO 10, and cell numbers were quantified on days 7, 14, and 22. BLIN-3 cells were plated in X-VIVO 10 alone (medium), with 10 ng/mL IL-7 (IL-7), on bone marrow stromal cells BMSCs alone (BMSC) or BMSC + 10 ng/mL IL-7 (BMSC + IL-7). Each bar represents the mean ± SD of triplicate values.
BLIN-3 cells acquire surface μ
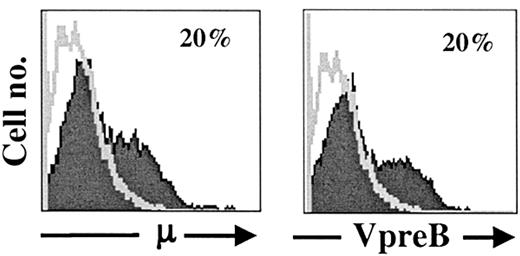
After approximately 5 months of continuous maintenance on BM stromal cells and IL-7, flow cytometric analysis revealed the emergence of surface μ+ cells in BLIN-3 cultures. Results in Figure3 show that approximately 20% of BLIN-3 cells expressed surface μ heavy chain and the VpreB subunit of the Ψ light chain, indicating that μ heavy chains were expressed as part of the pre-BCR on the surface of BLIN-3. The pre-BCR is only expressed on the cell surface when assembled as a complex composed of Igα, Igβ, VpreB, λ5, and μ.33-35 Thus, surface VpreB and surface μ expression (along with functional data presented below) are consistent with a structurally and functionally complete pre-BCR receptor complex on the surface of μ+BLIN-3.
Acquisition of VpreB and μ heavy-chain surface expression on prolonged culture of BLIN-3 cells.
Expression of cell surface μ heavy chain and the VpreB subunit of the ψ light chain on BLIN-3 after at least 20 weeks of continuous culture.
Acquisition of VpreB and μ heavy-chain surface expression on prolonged culture of BLIN-3 cells.
Expression of cell surface μ heavy chain and the VpreB subunit of the ψ light chain on BLIN-3 after at least 20 weeks of continuous culture.
BLIN-3 cells express TdT, but not immunoglobulin light chains
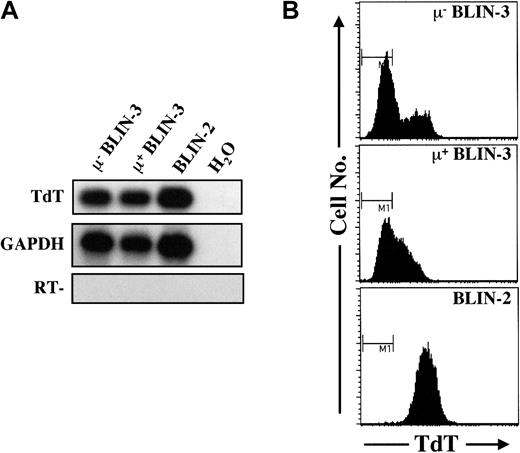
In general, pro-B cells express high levels of TdT protein, and detectable levels of TdT protein are dramatically reduced in the pre-B cell stage (LeBien3 and references therein). TdT expression, however, is often variable in B-lineage ALL cell lines. RT-PCR analysis and cytoplasmic staining revealed that both μ− and μ+ BLIN-3 cultures express TdT (Figure 4).
BLIN-3 cells express TdT.
(A) Analysis of TdT mRNA expression in μ− BLIN-3 and μ+ BLIN-3 cells by RT-PCR followed by Southern blot analysis. BLIN-2 is a TdT+ pre-B ALL line included as a positive control. H2O, no template; RT−, no reverse transcriptase. (B) Analysis of TdT protein expression in μ− BLIN-3 and μ+ BLIN-3 cells. BLIN-2 is included as a positive control. The bar labeled M1 denotes staining by the isotype-matched control. GAPDH indicates glyceraldehyde phosphate dehydrogenase.
We next examined κ light-chain expression by BLIN-3 cells. Surface κ was not detected on μ+ BLIN-3 (data not shown). RT-PCR analysis revealed that μ− and μ+BLIN-3 sublines expressed rearranged κ transcripts (Figure5A). However, when BLIN-3 cells were permeabilized and stained to detect intracellular κ light chains, none were detected (Figure 5B). This indicated that the BLIN-3 κ transcripts detected by RT-PCR are nonfunctional and that BLIN-3 does not express κ protein. A similar analysis for cytoplasmic λ protein revealed that BLIN-3 cells did not express λ light chains (Figure5B).
BLIN-3 cells do not express immunoglobulin light-chain proteins.
(A) RT-PCR analysis of rearranged kappa transcripts in μ− and μ+ BLIN-3. cDNA was PCR amplified using a Vκ consensus primer and a Cκ primer followed by Southern blot analysis, as described in “Materials and methods.” (B) Intracellular flow cytometric analysis of κ and λ protein expression in BLIN-3 sublines. DAUDI cells are included as a positive control for κ, and RAMOS cells are included as a positive control for λ. The bar labeled M1 denotes staining by the isotype-matched control. Cyto indicates cytoplasmic.
Loss of DJ rearrangements and appearance of VDJ rearrangements
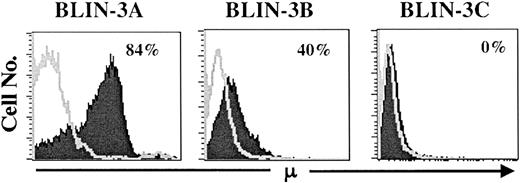
To track the emergence of μ+ cells more thoroughly, cryopreservations of BLIN-3 were thawed, cultured for varying lengths of time on BM stromal cells and IL-7, and analyzed for surface μ expression. As shown in Figure 6, older cultures (BLIN-3A) contained a higher percentage of surface μ+ cells than earlier cultures (BLIN-3B or BLIN-3C). This suggested that surface μ+ BLIN-3 were emerging as a function of length of time in culture. Importantly, surface μ+ BLIN-3 cells also harbored a 47,XX,+X, t(4;11) (q21;q23) karyotype (data not shown).
BLIN-3 cultures acquire increasing amounts of surface μ as a function of time in culture.
Individual cryopreservations of BLIN-3 were thawed, cultured for differing lengths of time, and analyzed for surface μ heavy-chain expression. Times in culture before analysis were as follows: BLIN-3A, 30 weeks; BLIN-3B, 26 weeks; and BLIN-3C, 9 weeks.
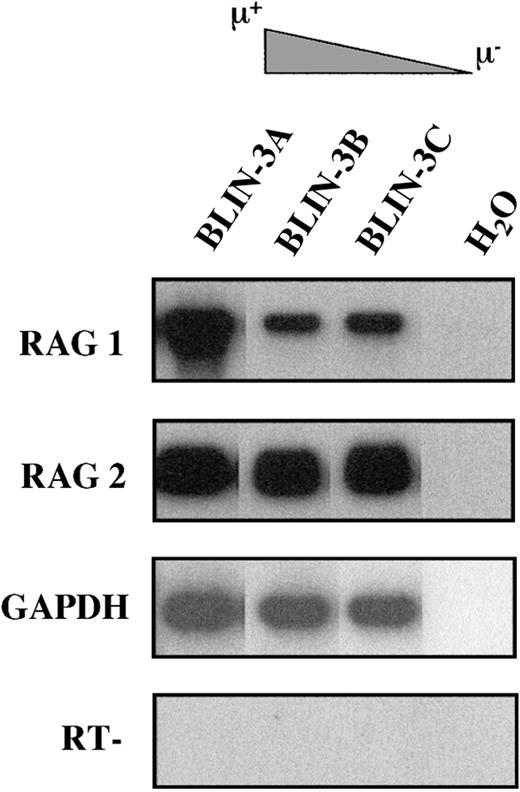
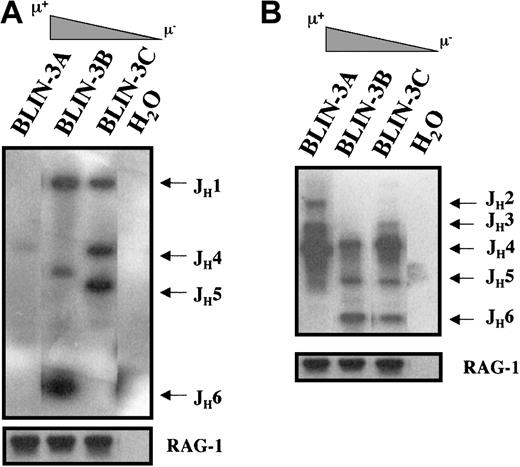
The acquisition of surface μ and VpreB expression by BLIN-3 suggested that BLIN-3 surface μ− cells were undergoing immunoglobulin heavy-chain gene segment rearrangement in culture and were differentiating into surface μ+ cells. Support for this hypothesis came from the demonstration by RT-PCR that BLIN-3 cells expressed RAG-1 and RAG-2 (Figure 7). BLIN-3 sublines expressing different levels of surface μ were analyzed by PCR for DJ and VDJ rearrangements. In this assay genomic DNA was isolated, and 5′ PCR primers for VH families or DXP-DH elements were used along with a primer 3′ of JH6. Amplification generates a ladder of bands, the size of which corresponds to a particular JHrearrangement.4 Results obtained using a 5′ DXP-DH element primer showed that the acquisition of surface μ was accompanied by the loss of DJ rearrangements (Figure8A). In contrast, when VDJ rearrangements were analyzed using a VH6 family-specific primer, the acquisition of surface μ was accompanied by the appearance of new VDJ rearrangements (Figure 8B). Similar results were obtained using a VH1 family-specific primer. These results are consistent with the well-known acquisition of surface μ after V to DJ rearrangements.
BLIN-3 sublines express RAG-1 and RAG-2.
cDNA was amplified using primers for RAG-1 and RAG-2. PCR products were separated on an agarose gel followed by Southern blot analysis. GAPDH was used as a control for cDNA integrity. H2O, no cDNA template; RT−, no reverse transcriptase.
BLIN-3 sublines express RAG-1 and RAG-2.
cDNA was amplified using primers for RAG-1 and RAG-2. PCR products were separated on an agarose gel followed by Southern blot analysis. GAPDH was used as a control for cDNA integrity. H2O, no cDNA template; RT−, no reverse transcriptase.
Acquisition of μ in BLIN-3 sublines is associated with V to DJ rearrangement.
(A) Analysis of DJ rearrangements in BLIN-3 sublines. Genomic DNA from BLIN-3 sublines expressing different levels of surface μ was amplified by PCR using a 5′ DXP-DH element primer and a 3′ JH6 primer. The JH designations on the right side of the blot define the sizes of amplified fragments representing specific JH family members. (B) Analysis of VH6-family VDJ rearrangements in BLIN-3 sublines. Genomic DNA from BLIN-3 sublines expressing different levels of surface μ was analyzed for VDJ rearrangements using a VH6 family-specific 5′ primer and a JH6 3′ primer. BLIN-3 sublines bearing higher percentages of μ+ cells exhibited more VDJ rearrangements. In panels A and B, the RAG-1 gene was amplified as a loading control. H2O, no DNA template.
We next examined VDJ transcription in BLIN-3 cells expressing various levels of surface μ (Figure 9). The transcription of multiple VH families by BLIN-3C and BLIN-3B suggested a stochastic pattern of V to DJ rearrangement. BLIN-3A, which contained the highest percentage of surface μ+ cells (Figure 6), only expressed VH1 and VH6 transcripts (Figure 9). Thus, the μ heavy-chain protein expressed in BLIN-3A represented a productive rearrangement of a VH1 or a VH6 family member, or both. These findings are consistent with those of recent studies documenting increased VH1 and VH6 family immunoglobulin rearrangements in adult and childhood ALL.36
BLIN-3 sublines express VDJ rearrangements from multiple VH families.
cDNA derived from BLIN-3 sublines expressing different levels of surface μ was analyzed by RT-PCR followed by Southern blotting for VDJ transcription using VH family-specific primers. GAPDH was used as a control for cDNA integrity. H2O, no cDNA template; RT, no reverse transcriptase.
Cross-linking the pre-BCR on BLIN-3 promotes cell proliferation
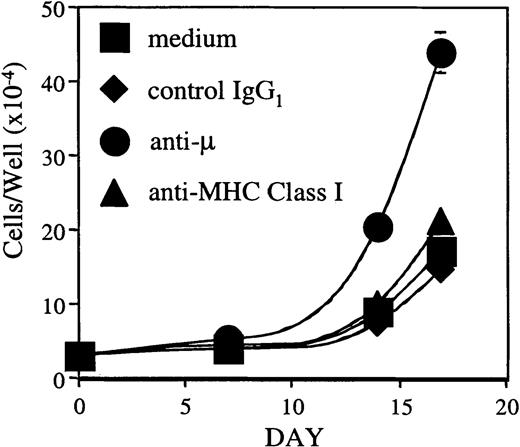
Pre-BCR signaling has been reported to influence positive selection, allelic exclusion, proliferation, differentiation, and VH-repertoire selection.33-35 37 To test whether the BLIN-3 pre-BCR is a functional complex capable of transducing a biologic signal, μ+ BLIN-3 cells were cross-linked with anti-μ heavy-chain mAb. As shown in Figure10, cross-linking the BLIN-3 pre-BCR led to an increase in cell number when BLIN-3 was maintained on BM stromal cells, whereas control IgG1 and anti–major histocompatibility complex class I had no effect. Cross-linking the BLIN-3 pre-BCR in the absence of BM stromal cells had no effect on survival (data not shown). These results indicate that cross-linking the BLIN-3 pre-BCR transduces a signal that cooperates with BM stromal cells to promote the proliferation of BLIN-3.
Cross-linking the BLIN-3 pre-BCR leads to an increase in cell number.
μ+ BLIN-3 cells (3.0 × 10⁴) were cultured on BM stromal cells supplemented with 10 ng/mL IL-7 in the presence or absence of the indicated antibodies at 10 μg/mL. BLIN-3 cell numbers were quantified on days 7, 14, and 17 using a microsphere flow cytometric assay.23 Inclusion of anti-μ resulted in a 14-fold increase in cell number by day 17 (compared to day 0). In contrast, medium alone, control IgG1, and anti–major histocompatibility class I (anti-–MHC class I) resulted in 5.5-, 4.6-, and 6.7-fold increases, respectively. Each symbol represents the mean ± SD of triplicate values.
BLIN-3 μ− and μ+ sublines express the MLL/AF4 fusion protein
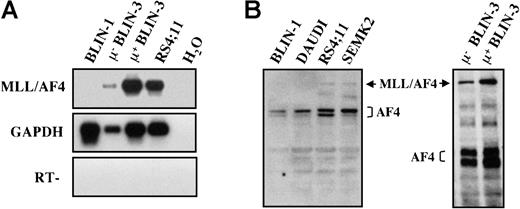
Using PCR primers specific for the MLL/AF4 fusion gene,31 BLIN-3 μ− and BLIN-3 μ+ sublines were analyzed by RT-PCR for expression of MLL/AF4 transcripts. As shown in Figure11A, both the BLIN-3 μ−and μ+ cells expressed MLL/AF4 transcripts. BLIN-1 is a pre-B ALL cell line that does not harbor the t(4;11) translocation23 and was used as a control for the specificity of the PCR primers. RS4;11 is a well-characterized, MLL/AF4-bearing cell line24 that served as a positive control. Whole-cell protein lysates from BLIN-3 μ− and μ+ cells were analyzed for the expression of AF4 protein using a mouse anti–human AF4 mAb that recognized wild-type AF4 and the MLL/AF4 fusion protein. As shown in Figure 11B, surface μ− and surface μ+ BLIN-3 cells expressed the MLL/AF4 fusion protein, similar to the previously characterized MLL/AF4-bearing cell lines RS4;11 and SEMK2.26
MLL/AF4 is expressed by μ− and μ+ BLIN-3 cells.
(A) RT-PCR analysis of MLL/AF4 expression. cDNA generated from μ− BLIN-3 and μ+ BLIN-3 sublines was amplified using primers that specifically amplify MLL/AF4 transcripts.32 PCR products were Southern blotted with an oligonucleotide probe internal to the amplified sequence. GAPDH was used as a control for cDNA integrity. H2O, no cDNA template; RT, no reverse transcriptase. (B) Western blot analysis of AF4 expression in BLIN-3 cells. Whole-cell lysates were prepared, and 80 μg protein per lane was electrophoresed on a 6% SDS-PAGE gel and subsequently transferred to nitrocellulose. Membranes were probed with mouse anti–human AF4 mAb. The 2 blots represent separate gels.
Discussion
Rearrangements involving the MLL gene occur in 60% to 70% of infant leukemias.9-11 Although MLL has more than 20 different fusion partners, infant ALL most often has theMLL/AF4 fusion gene.11 In contrast, theMLL/AF9 fusion gene is most often associated with acute myeloid leukemia.11 Recent studies have indicated that a truncated MLL fusion product (ie, MLL-lacZ) is sufficient to cause acute leukemia in chimeric mice.19 The specific MLL fusion partner might then confer some degree of lineage specificity in the development of leukemia.
Infant ALL, with the t(4;11) translocation, often displays a mixed-lineage phenotype characterized by coexpression of the B-lineage cell surface glycoprotein CD19 and myeloid–monocytoid gene products such as myeloperoxidase.11 We herein report the establishment of a novel t(4;11) cell line, BLIN-3, that expresses the MLL/AF4 fusion protein. BLIN-3 requires IL-7 and human BM stromal cells for optimal proliferation (Figure 2). This is a stable requirement of surface μ− and surface μ+BLIN-3 cells. BLIN-3 also undergoes V to DJ rearrangements (Figures 8,9) culminating in the expression of a functional cell surface pre-BCR (Figures 3, 10). These collective attributes are indistinguishable from the responses to BM stromal cells and cytokines and the patterns of immunoglobulin gene segment rearrangement that occur in normal human B-lineage cells spanning the pro-B to pre-B developmental stages.3
Stages of human B-lineage development have been historically defined on the basis of immunoglobulin gene segment rearrangement and μ heavy-chain expression.38 As a population, pro-B cells predominately bear DJH rearrangements and lack μ heavy-chain expression. The μ− BLIN-3 cells most closely resemble this stage of development. As normal human B-cell precursors progress from the pro-B cell stage through the pre-B cell stage, they lose CD34 expression, acquire VDJH rearrangements, and begin to express μ heavy chain (reviewed in Bertrand et al2 and LeBien3 and references therein). The classic defining feature of a pre-B cell is the expression of cytoplasmic μ heavy chain.38 A subset of pre-B cells also expresses μ heavy chain on the surface as part of the pre-BCR complex7,39 (and reviewed in Bertrand et al,2LeBien,3 and Meffre et al37). The μ+ BLIN-3 cells most closely resemble the pre-B cell stage of development.
The BM stromal cell culture system used to grow BLIN-3 is capable of supporting the development of IgM+ B cells from CD34+ stem cells.40 Hence, it is somewhat surprising to us that we have not seen the emergence of surface κ+ or λ+ BLIN-3 cells after prolonged culture. Our analysis revealed the presence of rearranged κ transcripts (Figure 5A), but, because there was no detectable intracellular κ protein (Figure 5B), these rearrangements were likely nonfunctional. Cytoplasmic λ light chains were also not detected (Figure 5B). BLIN-3 cells may harbor cytogenetically silent mutation(s) that prevent subsequent light-chain expression. Alternatively, the presence of the MLL/AF4 oncoprotein may suppress the expression of genetic pathways necessary for light-chain protein expression and successful transversal of the pre-B to immature B cell (IgM+) stages of development.
A review of the phenotypic and biologic characteristics of other t(4;11) cell lines24,41,42 and freshly isolated t(4;11) leukemic blasts43-50 indicates that BLIN-3 is unique in its retention of a “developmental program” that occurs in normal B-lineage cells. None of the established t(4;11) cell lines require human BM stromal cells for proliferation or undergo active V to DJ rearrangement, culminating in expression of the pre-BCR.24,41,42,51-53 Why is BLIN-3 unique? Leukemias with the t(4;11) translocation exhibit breakpoint heterogeneity.11,31 Breakpoints in the MLL gene generally cluster in a 6.5-kb region between exons 8 and 12, and breakpoints in the AF4 gene span a 40-kb region from exons 3 through 7. It is conceivable that some of the characteristics of BLIN-3 may be attributable to an MLL/AF4 fusion protein with unique functional characteristics. However, PCR analysis using primers that can distinguish between the possible MLL/AF4 fusion products31indicated that BLIN-3 contains an MLL/AF4 fusion transcript similar (if not identical) to the one expressed in RS4;11 (Figure 6A). Moreover, no correlation between the presence of a specific MLL/AF4 fusion gene and the phenotypic characteristics of MLL/AF4+ leukemic blasts has been observed.54
At the time BLIN-3 was being established, we were unaware that the original BM leukemic blasts harbored the t(4;11) chromosomal abnormality. No attempt was made to establish a parallel leukemic cell line in the absence of BM stromal cells. It is unknown whether a cell line could have been established from this patient's leukemic blasts that would have resembled other t(4;11) cell lines characterized by resistance to stress-induced cell death.55 Our human BM stromal cell culture system has been successfully used to establish B-lineage ALL cell lines that retain a dependency on BM stromal cells for optimal proliferation20 and that support normal B-cell development from lymphohematopoietic stem cells.40 56 The BLIN-3 cell line was not selected for apoptotic resistance to growth factor withdrawal and BM stromal cell independent growth, which could potentially explain its unique growth factor requirements.
The leukemogenic events that give rise to t(4;11) can be initiated in utero.57 However, it is unclear whether MLL/AF4alone is sufficient for the development of infant ALL or whether other mutations are necessary. Clinical studies have not identified a recurring chromosomal abnormality or mutation that cooperates withMLL/AF4.44,48 In one study of 173 patients with MLL/AF4+ ALL, 30% harbored additional chromosomal changes—an X chromosome gain and trisomy 8 were the most common.54 Mutations in p53 orp16INK4a have been detected in MLL/AF4+ ALL, but the clinical outcome of MLL/AF4+ ALL with or without these additional mutations was the same.58 BLIN-3 may be missing secondary mutations important for the full manifestation of the typical MLL/AF4 leukemic phenotype that culminates in arrest in a lymphoid or monocytoid progenitor. However, as discussed by DiMartino and Cleary,59 the short latency period of infant ALL with t(4;11) argues against the requirement for other significant accumulating mutations. Alternatively, the leukemic progenitor that gave rise to BLIN-3 may have acquired secondary mutation(s) that modified the role of MLL/AF4 in blocking B lymphopoiesis or conferring apoptotic resistance in the absence of BM stromal cells. It is also possible that the patient from whom the BLIN-3 cell line was established had an inherited gene product that modified the activity or function of MLL/AF4.
In conclusion, our data provide direct evidence that the expression of MLL/AF4 does not compromise the response of B-lineage cells to BM stromal cell–derived signals or their capacity to undergo V to DJ rearrangements and to express functional pre-BCR. These characteristics are in sharp contrast to the block in B-lineage differentiation that typifies infant ALL. Furthermore, recent studies60 in which the 3′ portion of human AF4 has been knocked into the murineMll locus have demonstrated an arrest in hematopoiesis in embryonic stem cells. These collective results suggest that the transcriptional effects of MLL/AF4 are cell-type dependent or are modified by other gene products.
We thank LeAnn Oseth and Betsy Hirsch (Cytogenetics Laboratory, University of Minnesota) for the cytogenetic analysis of BLIN-3. We appreciate the comments and critical input from John H. Kersey and David Largaespada (University of Minnesota Cancer Center), and we thank Sandi Sherman for assistance in preparation of the manuscript.
Supported by National Institutes of Health grants RO1 CA31685 and RO1 CA76055, the Graduate School of the University of Minnesota, the Minnesota Medical Foundation, and the Apogee Enterprises Professorship. F.E.B. is supported by The Chris P. Tkalcevic Foundation for Leukemia Research as a Special Fellow of the Leukemia and Lymphoma Society.
F.E.B. and C.V. contributed equally to this work.
The publication costs of this article were defrayed in part by page charge payment. Therefore, and solely to indicate this fact, this article is hereby marked “advertisement” in accordance with 18 U.S.C. section 1734.
References
Author notes
Fred E. Bertrand, University of Minnesota Cancer Center, Mayo Mail Code 806, 420 Delaware St SE, Minneapolis, MN 55455; e-mail: bertr010@tc.umn.edu.




This feature is available to Subscribers Only
Sign In or Create an Account Close Modal