Abstract
It was observed that interferon β (IFN-β) prevents the down-regulation of the interleukin-3 receptor α chain (IL-3Rα), which spontaneously occurs during culture of human monocytes. The functionality of IL-3R was demonstrated by the fact that IL-3 rescued IFN-β–treated monocytes from apoptosis. Monocytes cultured in the presence of IFN-β and IL-3 acquire a dendritic morphology and express high levels of HLA antigen class I and class II and costimulatory molecules. When stimulated by either lipopolysaccharide or fibroblasts expressing CD40 ligand (CD40L) transfectants, dendritic cells (DCs) generated in IFN-β and IL-3 secreted high levels of IL-6, IL-8, and tumor necrosis factor-α but low levels of IL-12 in comparison with DCs generated in IL-4 and granulocyte-macrophage colony-stimulating factor (GM-CSF). In mixed leukocyte culture, IL-3–IFN-β DCs induced a vigorous proliferative response of allogeneic cord blood T cells and elicited the production of high levels of IFN-γ and IL-5 by naive adult CD4+ T cells. Finally, IL-3–IFN-β DCs were found to produce much higher levels of IFN-α than IL-4–GM-CSF DCs in response to Poly (I:C) but not to influenza virus. It was concluded that monocytes cultured in the presence of IL-3 and IFN-β differentiate into DCs with potent helper T-cell stimulatory capacity despite their low secretion of IL-12.
Introduction
Dendritic cells (DCs) represent a major class of antigen-presenting cells characterized by their unique ability to prime naive T cells.1 Recent works demonstrated the existence of several DC subsets that differentiate from either lymphoid or myeloid bone marrow progenitors.2,3 A critical factor for myeloid DC development is granulocyte-macrophage colony-stimulating factor (GM-CSF),4,5 whereas lymphoid DCs are dependent on interleukin-3 (IL-3) for their survival.6,7 On the basis of the expression of myeloid markers (for example, CD11c) or IL-3 receptor α chain (IL-3Rα [CD123]) expression, 2 types of DC precursors have been isolated from human peripheral blood.7 One subtype displays myeloid surface markers and low levels of IL-3Rα, whereas another subtype of putative lymphoid origin expresses IL-3Rα, is exquisitely dependent on IL-3 for its survival, and is a strong producer of type 1 interferons (IFNs). Human myeloid DCs can be easily generated in vitro by culturing monocytes in the presence of GM-CSF and IL-4,4,5 whereas the so-called lymphoid DCs have been obtained by the isolation of precursors from blood or lymph nodes.6 7
Type 1 IFNs are produced by several cell types in response to viral, bacterial, and protozoan infections.8-13 Through their multiple effects on natural killer cells and T cells, type 1 IFNs represent a critical link between innate and acquired immunity.14 Recent studies indicate that type 1 IFNs might also influence DC differentiation and maturation.15,16Indeed, IFN-β was shown to promote monocyte differentiation into short-lived DCs rapidly undergoing apoptosis.16 Because IL-3 is a well-known survival factor for cells of the myeloid lineage, we reasoned that a combination of IL-3 and IFN-β might allow the generation of a new type of DCs. To investigate this possibility, we determined the effect of IFN-β on the expression of IL-3Rα on monocytes, and we characterized the phenotype and T-cell stimulatory capacity of cells derived from monocytes cultured in IL-3 and IFN-β.
Materials and methods
Cell preparation and culture
Peripheral blood mononuclear cells (PBMCs) were obtained from heparinized blood of healthy donors by centrifugation over Lymphoprep density gradient (Nycomed, Oslo, Norway). Monocytes were obtained either by 2-hour adhesion in 75-cm2 flasks or by centrifugation over Nycoprep density gradient (Nycomed). This was followed by magnetic cell sorting using a commercially available monocyte isolation kit that allowed cell suspensions containing more than 95% monocytes (Miltenyi Biotec, Auburn, CA) to be obtained. To generate DCs using IL-4 and GM-CSF, purified monocytes were cultured for 4 to 6 days in RPMI 1640 (BioWhittaker Europe, Verviers, Belgium) supplemented with 2 mM L-glutamine (Gibco, Paisley, Scotland), 20 μg/mL gentamicin, 50 μM 2-mercaptoethanol (Gibco), 1% nonessential amino acids (Gibco), and 10% fetal bovine serum (BioWhittaker Europe) in 75-cm2 flasks or 6-well plates (7.5 × 10⁵cells/mL) in the presence of GM-CSF (800 U/mL) and IL-4 (500 U/mL), kindly provided by Schering-Plough (Kenilworth, NJ), as described by Romani et al.4 In parallel, monocytes were cultured for 4 to 6 days in the presence of IFN-β (1000 U/mL) (Ares Serono Europe, London, United Kingdom) and IL-3 (50 U/mL) (R&D Systems Europe, Oxon, United Kingdom), alone or in combination.
Electron microscopy study
Dendritic cells were fixed with 2% glutaraldehyde and Millonig phosphate buffer for 2 hours. Cell blocks obtained after 1200g centrifugation for 10 minutes were postfixed with 2% osmium tetroxide and embedded in epoxy resin. Ultrathin sections were stained with uranyl-acetate and lead citrate. Ultrastructural study was performed using the electron microscope EMT400 (Philips, Eindhoven, Holland).
Flow cytometry analysis
For immunophenotyping, cells were washed in phosphate buffered saline supplemented with 0.5% bovine serum albumin and incubated for 15 minutes at 4°C with one of the following fluorescein isothiocyanate (FITC)– or phycoerythrin (PE)–conjugated monoclonal antibodies: FITC–anti–HLA-DR IgG2a, PE–anti-CD11c IgG2b, PE–anti-CD14 IgG2b, PE–anti-CD80 (B7-1) IgG1, and PE–anti-CD123 (IL-3Rα) IgG1, all from Becton Dickinson (Mountain View, CA), PE–anti-CD86 (B7-2) IgG2b from PharMingen (San Diego, CA), and PE–anti-CD40 IgG1 from Biosource International (Camarillo, CA), FITC–anti-CD1a IgG2a from DAKO (Glostrup, Denmark), PE–anti-CD83 IgG2b from Immunotech (Marseilles, France), and unconjugated DC-LAMP IgG1 from Beckman Coulter (Brea, CA). Cells were also stained with corresponding isotype-matched control monoclonal antibodies and then analyzed using a FACScan flow cytometer (Becton Dickinson).
Apoptosis analysis
Apoptotic cell death was measured by flow cytometry using FITC-conjugated annexin V (Becton Dickinson) and propidium iodide (Sigma-Aldrich, Bornem, Belgium) according to the manufacturer's protocol.
Endocytosis assay
FITC-dextran (Molecular Probes, Eugene, OR) was used to assess cell endocytosis, as described by Sallusto et al.17Briefly, cells were incubated with 1 mg/mL FITC-dextran at 37°C for 5, 15, or 30 minutes and then analyzed using the FACScan flow cytometer.
Dendritic cell stimulation
DCs (5 × 10⁵/mL) were stimulated by bacterial lipopolysaccharide (LPS) (1 μg/mL), formaldehyde-inactivated influenza virus strain New Caledonia (kindly provided by N. Kuehm, Aventis, Pasteur Mérieux, Val de Reuil, France), or Polyinosinic-polycytidylic acid (Poly [I:C] [20 μg/mL]) (Sigma), for 24 hours or 48 hours, respectively, and culture supernatants were then assayed for cytokine levels. In parallel, DCs (2 × 10⁵/mL) were activated by coculture with irradiated 3T6 fibroblasts transfected with the human CD40Lgene (CD40L transfectants) (5 × 10⁴/mL), and supernatants were harvested after 3 days for a determination of cytokine levels.
Mixed leukocyte cultures
DCs were cocultured in 96-well flat-bottom plates with allogeneic naive CD4+ T cells (2 × 10⁵/mL) isolated from newborn cord blood or adult PBMCs. CD4+ T cells were purified by magnetic cell sorting using a commercially available CD4 T-cell isolation kit (more than 95% purity as assessed by FACS analysis) (Miltenyi Biotec). In the case of adult CD4+ T cells, a CD45RA isolation kit (Miltenyi Biotec) was used for the enrichment in naive cells. After 5 days, cell proliferation was assessed by [3H] thymidine uptake during the last 16 hours, and culture supernatants were collected for a determination of cytokine levels.
Determination of cytokine levels
Enzyme-linked immunosorbent assay (ELISA) kits were purchased from Biosource Europe (Fleurus, Belgium) for the determination of IFN-α, IL-6, IL-8, and IL-12 (p40) levels. Determination of IL-12 (p70) levels was performed using a commercially available kit (Endogen, Woburn, MA). IFN-γ and IL-5 levels were measured by 2-site sandwich ELISA using antibodies from Chromogenix (Mölndal, Sweden) and PharMingen, respectively.
Statistical analysis
Statistical significance was determined using the 2-tailed paired Wilcoxon test.
Results
IFN-β–treated monocytes maintain IL-3Rα expression and depend on IL-3 for their survival
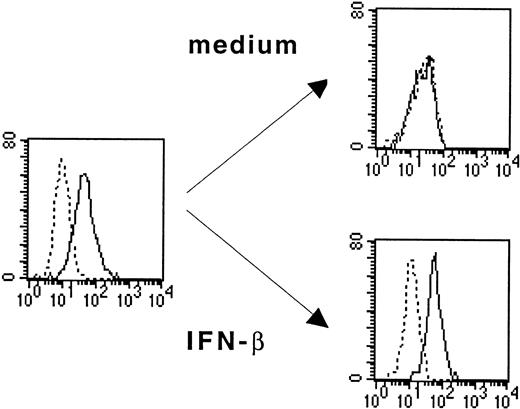
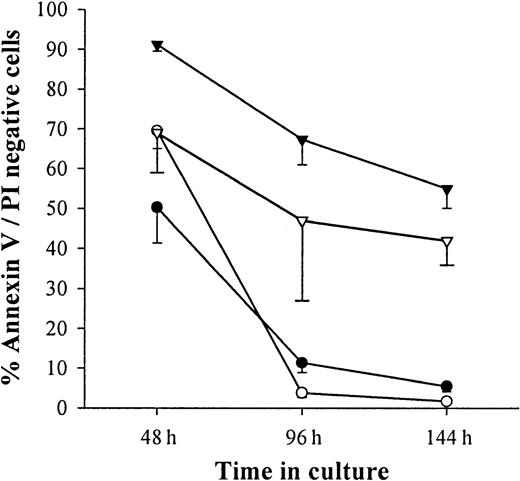
As shown in Figure 1, monocytes purified from PBMCs express IL-3Rα (CD123) but lose this expression after 6 days of culture in medium alone. The loss of IL-3Rα expression was prevented when IFN-β (1000 IU/mL) was added on the first day of culture (Figure 1). This analysis was performed on the fraction of viable cells in the culture. Indeed, more than 90% of monocytes cultured in medium alone or in the presence of 1000 IU/mL IFN-β were apoptotic, as assessed by flow cytometry using double staining with annexin V and propidium iodide (Figure2). The addition of IL-3 on the first day of culture dramatically enhanced monocyte survival. Indeed, more than 65% of cells were still alive after 6 days of culture in the presence of IL-3 and IFN-β.
IFN-β prevents IL-3Rα down-regulation on cultured monocytes.
Monocytes incubated in medium alone or with IFN-β (1000 U/mL) were analyzed by flow cytometry for the expression of IL-3Rα (CD123). Thick lines show FACS profiles after staining with PE-conjugated anti-CD123 antibodies, and dotted lines, FACS profiles after staining with isotype-matched control IgG1. Data are from 1 of 3 representative experiments on different blood donors.
IFN-β cooperates with IL-3 to promote monocyte survival.
Monocytes were cultured in medium alone (○) or in the presence of 50 U/mL IL-3 (▿) or 1000 U/mL IFN-β (●) or a combination of 1000 U/mL IFN-β and 50 U/mL IL-3 (▾). Apoptotic cells were enumerated by flow cytometry after staining for annexin V and PI). Results were expressed as mean ± SEM of percentages of cells negative for the expression of annexin V and PI.
Monocytes cultured in presence of IL-3 and IFN-β differentiate into DCs
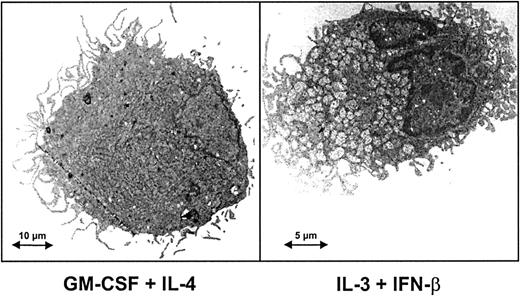
To characterize the cells obtained by monocyte culture in IL-3 and IFN-β, we first analyzed their ultrastructural morphology. As shown in Figure 3, monocytes cultured under this condition acquired cytoplasmic expansions of the dendritic type. Cells derived from monocytes cultured in IL-3 and IFN-β will, therefore, be referred to as IL-3–IFN-β DCs.
Ultrastructure of cells derived from monocytes cultured in the presence of IFN-β and IL-3.
Transmission electron microscopy of monocytes after culture for 6 days with either GM-CSF and IL-4 or IL-3 and IFN-β. IL-3–IFN-β DCs and GM-CSF–IL-4 DCs showed the typical appearance of dendritic cells, including a lobulated nucleus, long cytoplasmic processes, and tubulovesicular system. In the presence of IL-3 and IFN-β DCs appeared as smaller cells filled with mitochondria.
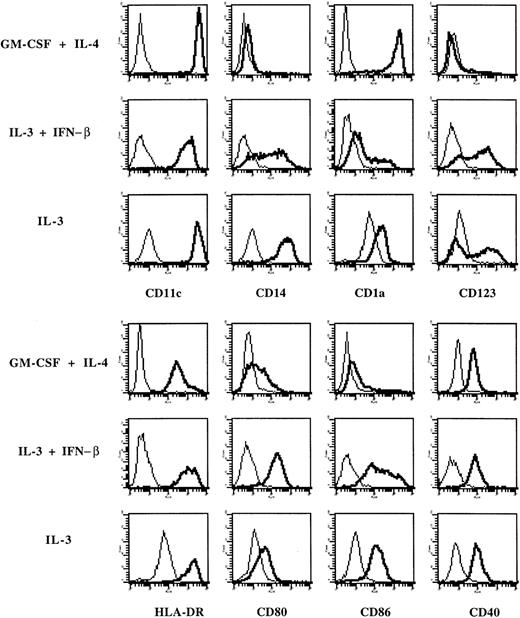
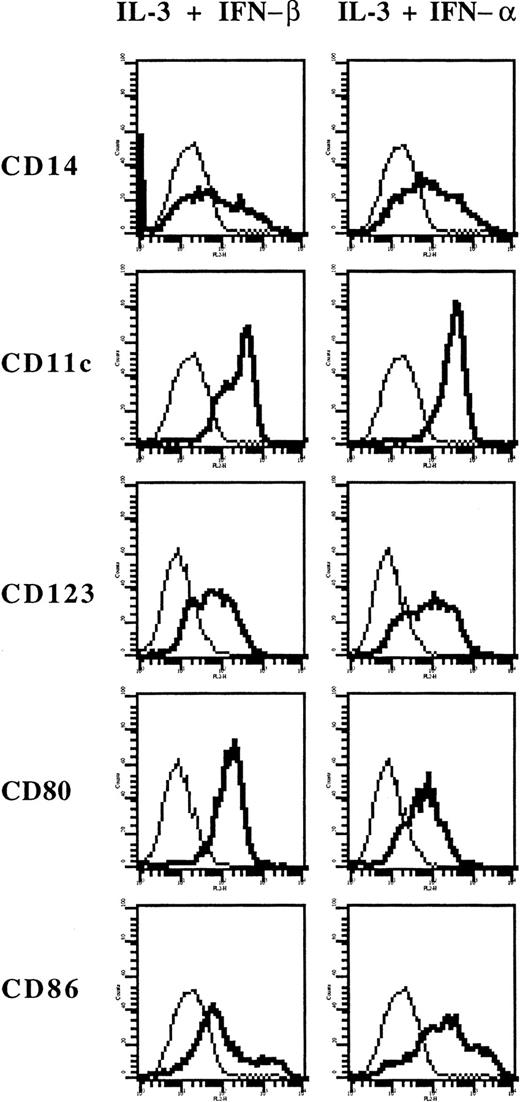
Flow cytometry analysis (Figure 4) first demonstrated that these cells expressed markers of the myeloid lineage (CD11c and CD14). Compared with DCs generated in IL-4 and GM-CSF, they expressed lower levels of CD1a but higher levels of IL-3Rα (CD123), HLA-DR, CD80, and CD86. Both types of DCs lack surface expression of CD3, CD8, CD16, CD19, CD45RA, and CD154 (CD40L) (data not shown). When monocytes were cultured in IL-3 alone, they strongly adhered to plastic, so that only limited numbers of such cells could be collected for further analysis. By flow cytometry, they expressed lower levels of CD80 and CD86 and higher levels of CD14 than IL-3–IFN-β DCs (Figure4), suggesting that they are closer to macrophages. In additional experiments, we found that IFN-α exerts a similar effect as IFN-β because the IL-3+IFN-α combination also resulted in the generation of myeloid IL-3Rα-positive DCs expressing CD80 and CD86 (Figure5).
Expression of surface markers on cells derived from monocytes cultured in IL-3 and IFN-β.
Phenotype of monocytes cultured with GM-CSF and IL-4, or IL-3 and IFN-β or IL-3 alone. Thick lines show FACS profiles after staining with specific antibodies, and thin lines, FACS profiles after staining with isotype-matched control antibodies. Data are from 1 of 6 representative experiments on different blood donors.
Expression of surface markers on cells derived from monocytes cultured in IL-3 and IFN-α.
Phenotype of monocytes cultured with IL-3 and IFN-β or with IL-3 and IFN-α. Thick lines show FACS profiles after staining with specific antibodies, and thin lines, FACS profiles after staining with isotype-matched control antibodies.
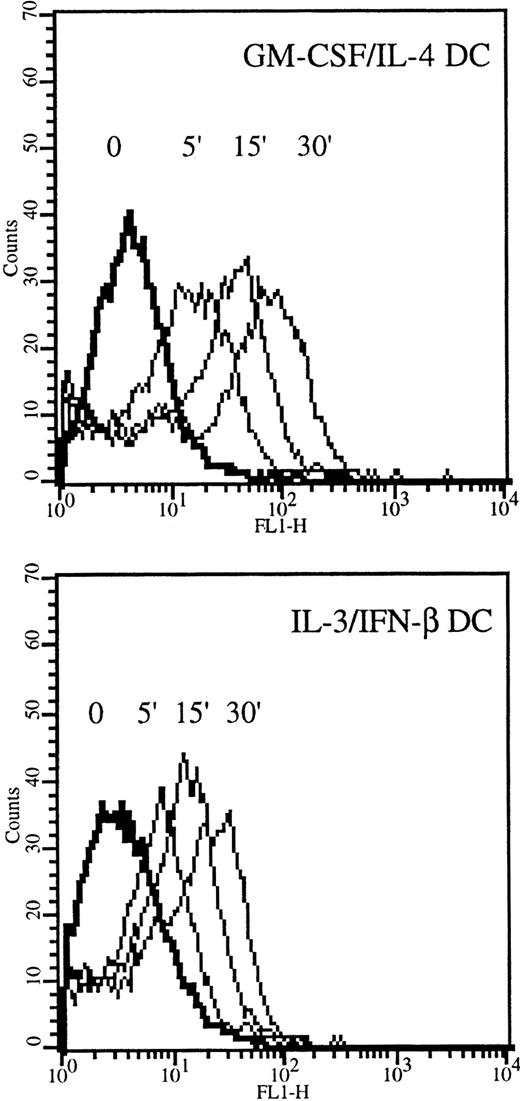
The endocytosis capacity of IL-3–IFN-β DCs was studied by fluid phase uptake of FITC-dextran. As shown in Figure6, IL-3–IFN-β DCs actively captured dextran, though they were less potent than IL-4–GM-CSF DCs in doing so.
Internalization of FITC-dextran in IL-3–IFN-β DCs.
DCs grown in GM-CSF and IL-4 or in IL-3 and IFN-β were incubated in medium containing 1 mg/mL FITC-dextran for the indicated times and were analyzed by flow cytometry. Results are from 1 of 3 representative experiments on different blood donors.
Internalization of FITC-dextran in IL-3–IFN-β DCs.
DCs grown in GM-CSF and IL-4 or in IL-3 and IFN-β were incubated in medium containing 1 mg/mL FITC-dextran for the indicated times and were analyzed by flow cytometry. Results are from 1 of 3 representative experiments on different blood donors.
To further study the maturation status of IL-3–IFN-β DCs, we analyzed their expression of CD83 and DC-LAMP, which are established markers of mature DCs. As shown in Figure 6, each marker was absent on resting IL-3–IFN-β DCs but was clearly up-regulated on LPS stimulation (Figure 7).
DC-LAMP and CD83 are expressed on LPS-stimulated IL-3–IFN-β DCs.
Monocytes were cultured with GM-CSF and IL-4 or IL-3 and IFN-β. DCs were then stimulated or not stimulated with LPS (1 μg/mL) for 24 hours. Thick lines show FACS profiles after staining with specific antibodies, and thin lines, FACS profiles after staining with isotype-matched control antibodies. Data from 1 of 2 representative experiments on different blood donors.
Production of cytokines by IL-3–IFN-β DCs
IL-3–IFN-β DCs spontaneously secreted IL-6, IL-8, IL-12 (p40), and tumor necrosis factor (TNF-α). In comparison with GM-CSF–IL-4 DCs, IL-3–IFN-β DCs produced less IL-12 (p40) whereas their secretion of IL-8 was slightly higher (Table1). As in IL-4–GM-CSF DCs, LPS and CD40 ligation induced by CD40L transfectants up-regulated the synthesis of cytokines by IL-3–IFN-β DCs. Compared with GM-CSF–IL-4 DCs, IL-3–IFN-β DCs produced lower levels of TNF-α in response to LPS, higher levels of IL-6 and IL-8 in response to CD40L, and much lower levels of IL-12 (p40) and IL-12 (p70) regardless of the stimulus considered.
Cytokine production by monocyte-derived DCs
| Stimulation . | Cells . | Cytokine levels (ng/mL) . | ||||
|---|---|---|---|---|---|---|
| TNF-α . | IL-6 . | IL-8 . | IL-12 (p40) . | IL-12 (p70) . | ||
| None | GM-CSF-IL-4 | 0.59 ± 0.26 | 0.31 ± 0.16 | 1.73 ± 0.75 | < 0.02 | < 0.01 |
| IL-3-IFN-β | 0.81 ± 0.21 | 0.86 ± 0.17 | 6.40 ± 2.95* | 0.29 ± 0.13 | < 0.01 | |
| LPS | GM-CSF-IL-4 | 32.9 ± 7.13 | 16.6 ± 4.97 | 88.0 ± 14.3 | 68.7 ± 20.0 | 0.04 ± 0.01 |
| IL-3-IFN-β | 18.1 ± 3.22* | 11.6 ± 2.59 | 69.6 ± 13.3 | 3.8 ± 1.53* | < 0.01* | |
| 3T6 | GM-CSF-IL-4 | 0.56 ± 0.55 | 0.45 ± 0.25 | 3.45 ± 1.27 | 0.12 ± 0.05 | < 0.01 |
| IL-3-IFN-β | 1.08 ± 1.08 | 0.12 ± 0.10 | 12.0 ± 2.88* | 0.03 ± 0.02 | < 0.01 | |
| 3T6-40L | GM-CSF-IL-4 | 2.86 ± 0.80 | 2.55 ± 0.45 | 15.0 ± 2.79 | 43.0 ± 19.0 | 0.38 ± 0.14 |
| IL-3-IFN-β | 4.06 ± 0.81 | 7.46 ± 2.17* | 117.2 ± 41.1* | 7.41 ± 1.50* | 0.03 ± 0.01* | |
DCs were generated in the presence of GM-CSF and IL-4 or IL-3 and IFN-β and were activated with LPS (1 μg/mL) for 24 hours or with 3T6-CD40L transfectants for 3 days. Cytokine levels in supernatants were measured by ELISA, and results were expressed as means ± SEM of 6 independent experiments on different blood donors.
P < .05 compared with DCs generated in GM-CSF and IL-4 (Wilcoxon test).
To analyze the production of IFN-α, we included as additional stimuli formaldehyde-inactivated influenza virus and Poly (I:C), which mimics viral double-stranded RNA. As shown in Table2, Poly (I:C) was the only stimulus inducing IFN-α production by IL-3–IFN-β DCs. Under this condition, IFN-α levels secreted by IL-3–IFN-β DCs were more than 10-fold higher than those produced by IL-4–GM-CSF DCs (128 ± 24 pg/mL;P < .05).
Poly (I:C) induces IFN-α production by IL-3-IFN-β DCs
| Stimulation . | n . | IFN-α level (pg/mL) . |
|---|---|---|
| None | 11 | < 12 |
| 3T6-CD40L | 11 | < 12 |
| LPS | 11 | 41 ± 9 |
| Influenza virus | 6 | 90 ± 48 |
| Poly (I:C) | 11 | 1873 ± 236 |
| Stimulation . | n . | IFN-α level (pg/mL) . |
|---|---|---|
| None | 11 | < 12 |
| 3T6-CD40L | 11 | < 12 |
| LPS | 11 | 41 ± 9 |
| Influenza virus | 6 | 90 ± 48 |
| Poly (I:C) | 11 | 1873 ± 236 |
DCs were generated in the presence of IL-3 and IFN-β and were activated with 3T6-CD40L transfectants for 3 days or LPS (1 μg/mL) for 24 hours or with influenza virus for 24 hours or Poly (I:C) for 48 hours. IFN-α levels in supernatants were measured by ELISA, and results were expressed as means ± SEM of independent experiments on different blood donors.
T-cell activation induced by IL-3–IFN-β DCs
To evaluate the ability of IL-3–IFN-β DCs to elicit naive T-cell responses, mixed leukocyte cultures were first prepared between cord blood CD4+ T cells and either IL-4–GM-CSF or IL-3–IFN-β DCs. At all stimulator-responder ratios, IL-3–IFN-β DCs were as efficient as GM-CSF–IL-4 DCs to induce CD4+T-cell proliferation (Figure 8A). In subsequent experiments designed to analyze the profile of cytokines secreted by T cells upon exposure to allogeneic DCs, mixed leukocyte cultures were prepared using adult naive CD45RA+CD4+ T cells as responder cells. As shown in Figure 8B, IL-3–IFN-β DCs induced the production of large amounts of IFN-γ, greater than those elicited by IL-4–GM-CSF DCs. To determine whether IL-12 was involved in the induction of IFN-γ production, we added a neutralizing anti–IL-12 antibody to the mixed leukocyte cultures. IL-12 neutralization inhibits more than 60% of IFN-γ production, whatever the DC type considered (data not shown), indicating that the low levels of IL-12 secreted by IL-3–IFN-β DCs contribute to their ability to elicit IFN-γ production by T cells. Similarly, IL-3–IFN-β DCs also induced IL-5 production in mixed leukocyte culture and were more efficient than IL-4–GM-CSF DCs in that respect (Figure 8B).
Helper T-cell stimulatory activity of IL-3–IFN-β DCs.
(A) IL-3–IFN-β DCs induce proliferation of naive CD4+ T cells. Cord blood CD4+ T cells were cultured with allogeneic IL-3–IFN-β DCs (○) or GM-CSF–IL-4 DCs (●) prepared from the same donors. After 5 days, T-cell proliferation was quantified by [3H] thymidine incorporation. Data are shown as mean ± SEM of 6 independent experiments. (B) Production of cytokines in mixed leukocyte cultures. Peripheral blood naive CD4+ T cells were cultured with allogeneic IL-3–IFN-β DCs (▨) or GM-CSF–IL-4 DCs (■) at a DC/T ratio of 1:10. After 6 days, culture supernatants were assayed using ELISA for a determination of cytokine levels. Data are shown as mean ± SEM of 6 experiments. *P < .05 compared with DCs generated in GM-CSF and IL-4 (Wilcoxon test).
Discussion
Among DC populations, distinct lineages were defined according to the expression of surface molecules. CD11c+CD123− DCs display features of myeloid lineage and depend on GM-CSF for their survival.5,18 IL-3–dependent CD11c− CD123+ DCs are thought to belong to lymphoid lineage,7 though Olweus et al19showed that in T-cell–dependent areas of human lymphoid organs, a large subset of DCs expressing high levels of IL-3Rα belong to a myeloid lineage. The experiments described in this article demonstrate that monocytes cultured in IL-3 and IFN-β give rise to a distinct type of DCs expressing high levels of CD11c and CD123 surface molecules. Interestingly, IL-3 was previously shown to cooperate with tumor necrosis factor in the generation of dendritic/Langerhans cells from CD34+ hematopoietic progenitor cells.20Because our starting population consisted of purified monocytes and the IL-3–IFN-β DCs differed from the dendritic/Langerhans cells in terms of CD1a and CD14 expression, it appeared that IL-3 could promote the differentiation of distinct DC populations.
Recently, it was shown that IFN-β has the ability to enhance the maturation of monocyte-derived DCs.21 Compared with classical DCs generated in GM-CSF and IL-4, IL-3–IFN-β DCs are at a higher stage of maturation, as indicated by their increased surface expression of costimulatory and HLA molecules. Decreased endocytic capacity of IL-3–IFN-β DCs may also reflect their higher maturation level.22 As far as cytokine production is concerned, IL-3–IFN-β DCs secrete lower levels of IL-12 than GM-CSF/IL-4 DCs. This could be related to their higher stage of maturation; DC maturation was previously shown to result in lower production of IL-12.23 Moreover, IFN-β might directly inhibit IL-12 synthesis by DCs.24 Although they display several features suggestive of a higher degree of maturation than IL-4–GM-CSF DCs, IL-3–IFN-β DCs should not be considered fully mature because they do not express CD83 and DC-LAMP. However, these markers clearly appeared with LPS stimulation, as in the case of IL-4–GM-CSF DCs.
A previous study observed that DCs differentiated from monocytes cultured in the presence of IFN-β and GM-CSF are short-lived.16 In this report, we demonstrate that IL-3 rescues monocytes cultured in the presence of IFN-β from apoptosis and allows them to differentiate into mature DCs. These observations demonstrate a cooperative effect of IL-3 and IFN-β on cell survival and differentiation. Little is known about the effect of type 1 and type 2 IFNs on IL-3R expression. The effect of type 1 IFNs on IL-3Rα expression has never been assessed to our knowledge, but IFN-γ proved to up-regulate IL-3Rα expression in human endothelial cells.25 Moreover, IFN-γ has been shown to have a synergistic effect with IL-3 on the growth of immature human hematopoietic progenitors,26 though this effect was not correlated with the up-regulation of IL-3Rα expression.27 Nevertheless, IL-3 is known to stimulate monocyte differentiation from myeloid progenitors and their activation.28-30 More recently, IL-3 proved to be a critical survival factor for IL-3Rα+ precursors of DCs isolated from human blood, lymph nodes, and bone marrow.6,7 19
Despite their low IL-12 production, IL-3–IFN-β DCs stimulate high levels of IFN-γ production from adult CD4+ T cells, suggesting that they use other factors or membrane molecules to elicit the synthesis of Th1 cytokines. In fact, IL-12–independent pathways of IFN-γ production were recently described.13,14 31-33 However, the reduced IFN-γ levels measured on IL-12 neutralization indicate that IL-12 contributes to the function of IL-3–IFN-β DCs.
The capacity of IL-3–IFN-β DCs to produce high levels of IFN-α on Poly (I:C) stimulation might be relevant to their effects in the setting of viral infections.34 This response to Poly (I:C) is consistent with their myeloid origin.35 Interestingly, IL-3–IFN-β DCs do not significantly respond to influenza virus, perhaps in relation to the induction of MxA by IFN-β.36Indeed, the differential responsiveness to influenza virus and Poly (I:C) is consistent with the fact that Poly (I:C) acts on the protein kinase R expressed in the cytoplasm, whereas surface receptors are involved in response to whole viruses.37
Monocyte-derived IL-4–GM-CSF DCs are now used clinically as tools to induce antitumor immunity.38-40 Herein, we show that IL-3–IFN-β DCs are more efficient than IL-4–GM-CSF at eliciting IFN-γ and IL-5 production by helper T cells. This might be relevant to cancer vaccination because both cytokines were found to synergize in tumor rejection.41 Because of their ability to induce the production of IFN-γ and IL-5 and their easy generation from peripheral blood monocytes, we suggest that IFN-β–IL-3 DCs might be of interest for the development of new cancer therapies based on DCs.
We thank Dr Muriel Moser for critically reading the manuscript, and we thank Dr Olivier Pradier and Dr Robert Kiss for helpful assistance.
Supported by the Centre de Recherche Inter-Universitaire en Vaccinologie sponsored by SmithKline Beecham Biologicals and the Région Wallonne, the Charcot Foundation, and the CELLO project of the Brussels region. E.J.B. is a recipient of a SmithKline Beecham fellowship from the National Fund for Scientific Research (FNRS). C.B. is a postdoctoral researcher of the FNRS.
C.B. and E.J.B. contributed equally to the data presented in this manuscript.
The publication costs of this article were defrayed in part by page charge payment. Therefore, and solely to indicate this fact, this article is hereby marked “advertisement” in accordance with 18 U.S.C. section 1734.
References
Author notes
Michel Goldman, Department of Immunology, Hôpital Erasme, route de Lennik, 808, B-1070 Brussels, Belgium; e-mail: mgoldman@ulb.ac.be.


![Fig. 8. Helper T-cell stimulatory activity of IL-3–IFN-β DCs. / (A) IL-3–IFN-β DCs induce proliferation of naive CD4+ T cells. Cord blood CD4+ T cells were cultured with allogeneic IL-3–IFN-β DCs (○) or GM-CSF–IL-4 DCs (●) prepared from the same donors. After 5 days, T-cell proliferation was quantified by [3H] thymidine incorporation. Data are shown as mean ± SEM of 6 independent experiments. (B) Production of cytokines in mixed leukocyte cultures. Peripheral blood naive CD4+ T cells were cultured with allogeneic IL-3–IFN-β DCs (▨) or GM-CSF–IL-4 DCs (■) at a DC/T ratio of 1:10. After 6 days, culture supernatants were assayed using ELISA for a determination of cytokine levels. Data are shown as mean ± SEM of 6 experiments. *P < .05 compared with DCs generated in GM-CSF and IL-4 (Wilcoxon test).](https://ash.silverchair-cdn.com/ash/content_public/journal/blood/99/3/10.1182_blood.v99.3.993/5/m_h80322052008.jpeg?Expires=1769096903&Signature=Mn-ncCA6DhUFCRVouXYVBspJsWV~qjD4lvP4S2BduTWs0jNGE8GOBQ6URd~eM9GKiQ5nnPE4OVM6tF1Yi~JhMCw6xo90ubE2Z4nvAOaZ0d~PX5HglGXkrAyW0tW~ZTTtpwcXw4d2epPtkHB6qPBFQIgEB3MJS5C-0X64cR3HFh-I23a1lPGulJuqgBnZTu2zb6Dx0lqkbKpa5PUZtHJp0phP5OTu32e00~~QoSg0B8UcHTmDdKniMw5nPfLgLXjzJ1WiLCf9F-iVcAwo41IRxxYTl1EyWQprVldoY0AX7vGdFd4cBFUGH96tqdFcUtIddYr6K6k34K85A8QCsput5g__&Key-Pair-Id=APKAIE5G5CRDK6RD3PGA)
This feature is available to Subscribers Only
Sign In or Create an Account Close Modal