Constitutive activation of the BCR-ABL tyrosine kinase is fundamental to the pathogenesis of chronic myeloid leukemia (CML). STI571 inhibits this activity and modulates the transcription of several genes. It was shown by differential display that the suppressor of cytokine signaling-2 (SOCS-2) gene was down-regulated by STI571 treatment in 14 of 16 BCR-ABL–positive cell lines and in 2 BCR-ABL–transfected murine lines, but not inBCR-ABL–negative counterparts. The effect was maximal at 2 hours and persisted for at least 24 hours after exposure to 1 μM STI571, whereas SOCS-1 and SOCS-3 expression were unaffected. Baseline levels of SOCS-2 were significantly higher in BCR-ABL–positive as compared withBCR-ABL–negative cell lines. It was similar in leukocytes and CD34+ cells from healthy persons (n = 44) and patients with CML in chronic phase (CP; n = 60) but significantly increased in patients with CML in blast crisis (BC; n = 20) (P < .0001). Mononuclear cells (MNCs) from 3 of 4 patients with CML in BC showed a 2-fold to 12-fold down-regulation ofSOCS-2 levels on in vitro exposure to STI571; moreover, a 2-fold to 11-fold decrease in SOCS-2 was observed in MNCs from 7 of 8 patients with CML in BC who responded to treatment with STI571. Refractoriness to STI571 or relapse after initial response was accompanied by augmentation of SOCS-2 expression. Ectopic overexpression of SOCS-2 in 32Dp210 cells slowed growth, inhibited clonogenicity, and increased their motility and sensitivity to STI571. Overall, the results suggest that SOCS-2 is a component of a negative feedback mechanism; it is induced by Bcr-Abl but cannot reverse its overall growth-promoting effects in blastic transformation.
Introduction
Chronic myeloid leukemia (CML) is a neoplastic disease of the hematopoietic stem cell that evolves in 3 clinical stages: chronic phase (CP), accelerated phase (AP), and blast crisis (BC). It is characterized by a t(9;22)(q34;q11) reciprocal translocation which gives rise to a 22q-, or Philadelphia (Ph) chromosome and a derivative 9q+. The translocation results in a chimeric BCR-ABL gene on the Ph chromosome, which is expressed as a 210-kd protein.1 This protein exhibits deregulated tyrosine kinase activity as compared with the normal p145Abl, and has been shown to be both transforming in vitro and leukemogenic in vivo. The most compelling evidence that the p210Bcr-Abl protein is the main causal mechanism of CML is the demonstration that a CML-like disease can be produced in mice that received transplants of stem cells transduced with aBCR-ABL gene.2
It is known that p210Bcr-Abl interferes with a variety of intracellular signaling pathways, partly via protein-protein interactions and partly via tyrosine phosphorylation of target substrates.3 The common endpoint of all these pathways is the regulation of transcription. The phenotypic expression of the Bcr-Abl–induced changes is mainly represented by uncontrolled proliferation, impaired apoptosis, and reduced cell adhesion. The first 2 aspects could explain the clinical observation that during the chronic phase of CML, expansion of the myeloid compartment apparently escapes physiologic control while cells still retain the capacity to differentiate and to function normally. The adhesion defect of CML progenitors is likely to result from deregulation of the normal processes that control their cytoskeletal organization, binding to bone marrow stroma and homing properties.4 5
Most of the efforts so far to define possible targets of Bcr-Abl in CML have led to the identification of proteins which are affected by a mechanism of posttranslational modification, usually in the form of constitutive phosphorylation by the Bcr-Abl tyrosine kinase. Little is known of the actual genes whose transcription is ultimately affected by this kinase activity. We have previously used the Bcr-Abl tyrosine kinase inhibitor STI571 to block Bcr-Abl and screen for transcriptional changes in a lymphoid BC cell line using the technique of differential display (DD).6 In the present study, we followed the same approach to compare the gene expression profiles of 2 myeloid BC cell lines in the presence or absence of STI571. Among the various messages detected as differentially expressed, one corresponded to the suppressor of cytokine signaling 2 (SOCS-2) gene.
SOCS-2,7 also known asSSI-28 and CIS-2,9 is part of a family of at least 8 SOCS proteins, all characterized by an N-terminal region of great variability, a central SH2 domain and a C-terminal conserved motif of about 40 amino acids, named the SC-motif, CH domain, or SOCS box.9,10 Its physiologic role in the hematopoietic system has not been investigated so far.SOCS-2–deficient mice were reported to suffer from gigantism due to growth hormone and insulinlike growth factor-1 (IGF-1) deregulated signaling.11 These mice, however, did not have any detectable hematologic abnormality when examined at 2 months of age. In transfected murine fibroblasts and human embryonic kidney cells, SOCS-2 was shown to bind to the IGF-1 receptor,12 which is known to act as an antiapoptotic molecule via the phosphoinositol 3 (PI-3) kinase and MAPK pathways. IGF-1 is also reported to phosphorylate insulin receptor substrate 1 (IRS-1), which interacts with the Ras protein via Grb2 and SOS.13 Since Ras and PI-3 kinase are both signaling molecules closely linked to BCR-ABL–mediated malignant transformation,14 15 it is possible that SOCS-2is involved in the signal transduction cascades in CML cells.
In the present study we show that SOCS-2 is overexpressed inBCR-ABL–positive blasts and that this overexpression is abrogated by inhibition of Bcr-Abl. Furthermore, we demonstrate thatSOCS-2 is down-regulated in vivo upon Bcr-Abl tyrosine kinase inhibition, as shown by an inverse correlation between its level of expression and the hematologic response of patients with CML treated with STI571. Ectopic overexpression of SOCS-2 inBCR-ABL–positive cell lines increased their sensitivity to STI571 and inhibited their proliferative capacity. The data suggest that Bcr-Abl–induced SOCS-2 up-regulation is part of a defective negative feedback loop that is unable to control the growth-promoting effects of Bcr-Abl in blast crisis.
Materials and methods
Cell cultures
Cell lines were grown in RPMI-1640 medium (Gibco/Life Technologies, Paisley, United Kingdom) supplemented with 10% fetal calf serum, 2% L-glutamine, and 2% penicillin/streptomycin (here referred to as RF-10). The 32D cells were additionally supplemented with 10% WEHI-conditioned medium as a source of murine interleukin-3 (IL-3), and M07e cells with 10 ng/mL human recombinant IL-3 (FirstLink, Brierley Hill, United Kingdom). The Baf/tsBCR-ABL thermosensitive cells were grown at 32°C, the permissive temperature for Bcr-Abl kinase activity, and transferred to 39°C (restrictive temperature) in the presence of 10% WEHI-conditioned medium for certain experiments. All cell lines were either purchased from cell repository banks (American Type Culture Collection, Rockville, MD; European Collection of Cell Cultures, Winchester, United Kingdom; or German Collection of Microorganisms and Cell Cultures, Braunschweig, Germany), kindly donated by their originators or created in our laboratory (JVM13, JVM23, JVM36, K562-r, AR230-r). STI571 was provided by Dr Elisabeth Buchdunger (Novartis Pharma, Basel, Switzerland). LY294002, AG940, and manumycin A were purchased from Calbiochem (Nottingham, United Kingdom) and U0126 from Promega (Southampton, United Kingdom).
Primary cells
Peripheral blood specimens were obtained from patients with CML and Ph-positive acute lymphocytic leukemia (ALL) treated at the Hammersmith Hospital, London, United Kingdom or at the III. Medizinische Universitätsklinik, Mannheim, Germany. A subgroup of these patients were participating in the STI571 clinical trials 0102, 0109, and 0110, designed by Novartis Pharma. Control samples were obtained from healthy volunteers among the laboratory staff or from buffy coats (byproducts of platelet-rich plasma separation) from voluntary blood donors. Informed consent was obtained from all patients and healthy individuals included in this study. White blood cells (WBCs) were isolated by red-cell lysis,16 mononuclear cells (MNCs) were obtained after Ficoll-Hypaque centrifugation, and CD34+ cells were purified using magnetic separation columns (MiniMACS and MidiMACS; Miltenyi Biotec, Bergisch Gladbach, Germany) according to the manufacturer's instructions.
Differential display
The differential display (DD) assay was performed using the RNAimage kit (GenHunter, Nashville, TN) with minor modifications as previously reported.6 All polymerase chain reactions (PCRs) were set up in duplicate, and only bands differentially expressed in both reactions were further processed. Candidate bands were excised from the gel, the DNA was reamplified by PCR with the original primers, subcloned in the TOPO-TA vector (Invitrogen, Groningen, The Netherlands) following the manufacturer's protocol and used as probes for Northern blotting. Sequence analysis was performed using an ABI377 sequencer (Applied Biosystems, Warrington, United Kingdom) and M13 standard primers; the results were analyzed by the BLAST Search program.17
Northern blotting
Between 5 μg and 20 μg of total RNA was electrophoresed on a 0.8% agarose gel, blotted onto an uncharged nylon membrane (Hybond N, Amersham, Little Chalfont, United Kingdom) and hybridized with32P-labeled probes as described.6 A multiple tissue Northern (MTN) blot was purchased from Clontech (Basingstroke, United Kingdom) and hybridized according to the company's instructions. Probes were either isolated from the original DD gel, cloned PCR products, or derived from IMAGE consortium cDNA clones18 (provided by the MRC Human Genome Mapping Project Biological Resources, Hinxton, Cambridge, United Kingdom). A human β-actin cDNA probe was used as control for RNA loading (kindly provided by Dr Philip Mason, Imperial College School of Medicine, London, United Kingdom). Densitometric analysis of the autoradiographs was performed using the GelBlotPro software (Ultra-Violet Products, Cambridge, United Kingdom).
Western blotting
Protein lysates were prepared according to Kabarowski et al,19 and Western blots of 12% sodium dodecyl sulfate–polyacrylamide gel electrophoresis (SDS-PAGE) gels were immunostained with a SOCS-2 or a c-myc (9E10) antisera (sc-7007 and sc-40; Santa Cruz, Autogen Bioclear, Calne, United Kingdom) using the enhanced chemiluminescence (ECL) system (Amersham). To control for protein loading, the blots were stripped and restained with an actin antibody (A-2066, Sigma).
End-point (qualitative) reverse transcriptase–polymerase chain reaction
RNA from 105 to 2 × 10⁷ cells was isolated by the protocol of Chomczynski and Sacchi20 or using the RNeasy Kit (Qiagen, Crawley, United Kingdom), and reverse-transcribed as described.21 The following primers were used for single-step PCR amplifications of SOCS-2: exon 1a, sense 5′-GGGTGCACAGCCTCAGGATA; exon 1b, sense 5′-TCGAGGCGATCAGTGGGTGA-3′; exon 3, antisense 5′-TTTCTCTTTGGCTTCATTAACAGTCAT-3′. Separate amplifications of a 342–base pair (bp) fragment of the normal G6PD gene were used as control for cDNA quality as previously published.22
Real-time PCR (TaqMan)
Primers and probes were designed using the Primer Express 1.0 program (Applied Biosystems). The PCR reactions for SOCS-2and CIS contained 300 nmol/L of each forward and reverse primer and 150 nmol/L fluorescently labeled probe in a 25 μL reaction. The glyceraldehyde phosphate dehydrogenase(GAPDH) probe was used as a 20× concentrate according to the manufacturer's recommendation. The amplification was performed in an ABI Prism 7700 thermocycler (Applied Biosystems) for 2 minutes at 50°C, 10 minutes at 95°C, followed by 40 cycles of 15 seconds at 95°C and 1 minute at 60°C. Each sample was analyzed forSOCS-2, CIS, and GAPDH expression, and values were expressed as ratios: SOCS-2/GAPDH orCIS/GAPDH. The primer and probe sequences for the amplification of human SOCS-2 were as follows: forward primer, 5′-TGGCGAAGGCCCTGC-3′; reverse primer, 5′-TTTCTCTTTGGCTTCATTAACAGTCAT-3′; probe (on the reverse strand), 5′-TTCCCCAGTACCATCCTGTCTGACCGA-3′. The sequences for the amplification of human CIS were as follows: forward primer, 5′-CCTACCTTCGGGAATCTGGCT-3′; reverse primer, TGGCATCTTCTGCAGGTGTT-3′; probe, 5′-TCCATTACGGCCAGCGAGGCC-3′. The SOCS-2 andCIS probes were labeled at the 5′ end with the reporter dye molecule FAM (OSWEL, Southampton, United Kingdom) and theGAPDH probe (Applied Biosystems, cat.no 4310884E) with VIC. Both probes were 3′-labeled with the quencher dye molecule TAMRA. Amplification of genomic DNA was not observed for either gene, and strict precautions were taken to prevent contamination. Ten identical cell suspension aliquots from one control sample were separately lysed, reverse-transcribed, and tested for amplification of both genes. Since the maximum variation between these 10 replicates was 1.97 (mean ± 1 SD), we considered all changes of target gene/GAPDHratios more than 2 as significant. A semilogarithmic dilution of KYO1 cDNA was included in each plate to be used as a standard for quantification.
Flow cytometry and determination of apoptotic cells
Samples of 1 × 10⁶ to 2 × 10⁶cells were permeabilized by fixation in 50% ethanol for 30 minutes on ice, washed in phosphate buffered saline (PBS) and stained with 100 μg/mL propidium iodide (PI). RNase (Boehringer Mannheim, Mannheim, Germany) was added at a concentration of 100 μg/mL. Stained cells were analyzed on a FACscan with the aid of the CellQuest software (Becton Dickinson, Oxford, United Kingdom).
Stable transfection
The myeloid murine cell line 32Dp210 was cotransfected by electroporation with the myc-tagged pcDNA3 vector carrying the full-length coding sequence of SOCS-2 cDNA (kindly provided by Dr A. Yoshimura, Kurume, Japan) and with pBabe-puro.23 Clones were selected in methylcellulose (H4230, Stem Cell Laboratories, Vancouver, BC, Canada) supplemented with 2 μg/mL puromycin (Sigma), and the expression ofSOCS-2 was confirmed by immunoblotting for c-mycand SOCS-2.
Clonogenic assays
The parental 32Dp210 cells and their transfected counterparts were plated in triplicate in methylcellulose at a concentration of 102/mL to 106/mL with or without 1 μM STI571, and without additional cytokines. The BCR-ABL–negative cell line 32D served as a control for these experiments. The number of colonies was assessed after 7 days incubation at 37°C.
Adhesion and migration assays
For measurement of adhesion to plastic, cells were plated in quadruplicate in a 96-well flat-bottom tissue culture plate and incubated for 24 hours at 37°C. Due to different proliferative capacities of the cell lines used, a wide range of plating concentrations from 8 × 10² to 2 × 10⁵cells/100 μL was required. Test wells were then washed twice with PBS to remove the nonadherent cells, the number of remaining cells was assessed by [3-(4,5-dimethylthiazol-2-yl)-5-(3-carboxymethoxyphenyl)-2-(4-sulphenyl)-2H-tetrazolium, inner salt] (MTS tetrazolium) staining as described elsewhere,24 and expressed as a ratio of adherent/total number of cells. Adhesion to fibronectin was measured by plating 5 × 10⁴ cells/50 μL in a 48-well tissue culture plate (Corning Costar, High Wycombe, Bucks, United Kingdom) coated with the CH-296 fibronectin fragment (RetroNectin; kindly donated by Takara Shuzo, Shiga, Japan).25 The plate was tilted at 80° for 1 hour and then lowered to 30° to 45° for overnight incubation at 37°C. The number of migrating cells was assessed as described.26 Results were normalized against the cells kept in wells under the same conditions with PBS/2% bovine serum albumin (BSA). To further analyze the migratory abilities of transfected versus parental cells, 5 × 10⁴ cells were plated in 100 μL RF-10 in the top chamber of a 5.0 μm Transwell plate (Costar). After 24 hours, the numbers of cells that had migrated to the lower chamber and those that remained in the Transwell were determined by hemocytometer counting of trypan-blue stained cells (modified after Adelsman et al27).
Statistical analysis
The Mann-Whitney test was used to assess differences between samples.
Results
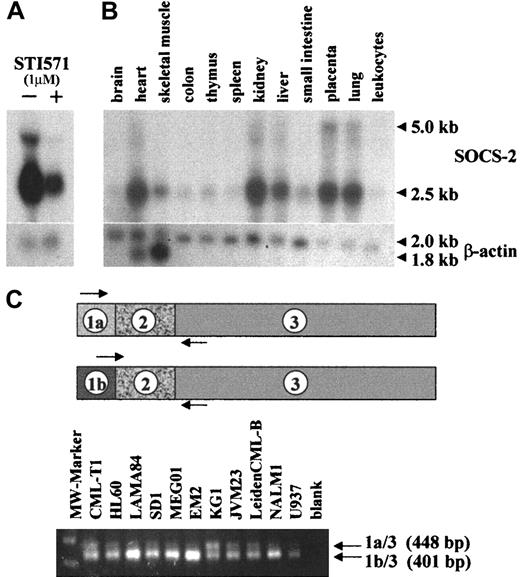
The human CML cell line KYO1 was treated with 1 μM STI571 for 10 hours. At this time-point, no signs of cell death as determined by trypan blue exclusion, DNA apoptotic laddering, or propidium iodide staining were observed (data not shown). DD analysis of cells treated with STI571 as compared with the nonexposed control culture yielded, among others, a DNA fragment of approximately 1 kb which appeared stronger in the nonexposed KYO1 cells. Northern hybridization with the candidate band confirmed differential expression of a predominant 2.5-kb message (Figure 1A). Sequence of the DD isolate matched the 3′ untranslated region of the humanSOCS-2 gene (GenBank accession no. AF037989).
SOCS-2 expression in human tissue and cell lines.
(A) Northern blot of KYO1 cells exposed (+) or not (−) to 1 μM STI571 for 10 hours. (B) Multiple-tissue Northern blot (Clontech) probed with SOCS-2. (C) Primer design and RT-PCR amplification of alternatively spliced variants ofSOCS-2.
SOCS-2 expression in human tissue and cell lines.
(A) Northern blot of KYO1 cells exposed (+) or not (−) to 1 μM STI571 for 10 hours. (B) Multiple-tissue Northern blot (Clontech) probed with SOCS-2. (C) Primer design and RT-PCR amplification of alternatively spliced variants ofSOCS-2.
Alternative splicing of the SOCS-2 gene
Northern hybridizations of cell line or primary cell RNA with the probe isolated from the DD gel, cloned PCR products, or IMAGE consortium cDNA clones always showed a predominant 2.5-kb message, whereas an earlier study12 described a major humanSOCS-2 mRNA message of approximately 5 kb in various tissues. In order to clarify this discrepancy, we hybridized a multiple-tissue Northern blot with the probe isolated from the DD gel and confirmed our original finding that the major SOCS-2message is 2.5 kb in length, with a weaker 5-kb band (Figure 1B). A search of the HTGS genomic database with the SOCS-2 cDNA sequence suggested the existence of an alternative exon 1 in addition to that previously published (GenBank accession no. AC012085). PCR amplification of cDNAs derived from 7 BCR-ABL–positive and 4 BCR-ABL–negative cell lines with 5′ primers on either exon 1a or exon 1b and a 3′ primer on exon 3 showed in both groups 2 distinct transcripts resulting from alternative splicing, with the transcript from exon 1b being the predominant one (Figure 1C). The junctions between the exons were confirmed by sequencing. Cloned PCR products from these amplifications were used as probes for Northern hybridizations and lighted up identical patterns of bands (data not shown).
SOCS-2 expression in hematopoietic cell lines
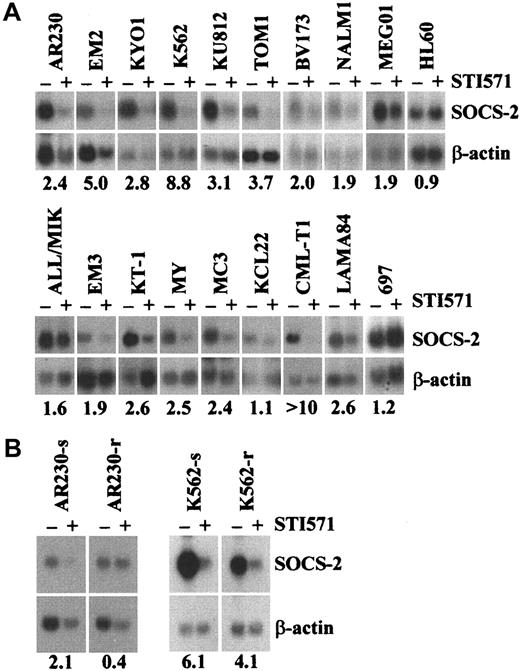
In order to determine whether the differential expression ofSOCS-2 was restricted to KYO1 cells, we tested 18 CML or Ph-positive ALL cell lines exposed or not exposed to 1 μM STI571 for up to 24 hours by Northern blotting. Sixteen lines showed a 1.5-fold to over 10-fold down-regulation of SOCS-2 levels after exposure to STI571 (Figure 2A). In 12 of these 16 lines, down-regulation was evident at the 10-hour time-point or earlier, whereas in 4 lines (BV173, ALL/MIK, KT1, LAMA84) the effect was better defined after a 24-hour exposure to STI571, possibly because of a slightly lower sensitivity of the latter cell lines to STI571 as compared with KYO1 cells (data not shown). These results were confirmed at the protein level by Western blotting, particularly in the cell lines of lymphoid origin such as BV173, NALM1, TOM1, and MY in whichSOCS-2 protein expression was apparently more abundant (data not shown). The remaining 2 BCR-ABL–positive cell lines tested, KCL22 and SD1, both previously shown to be intrinsically resistant to STI57128 either did not show differential expression of SOCS-2 after treatment with STI571 (KCL22), or failed to express SOCS-2 at the level of Northern blot detection (SD1). The 2 STI571-resistant sublines AR230-r and K562-r24 either did not show any (AR230-r) or a significantly lower (K562-r) down-regulation of SOCS-2 when exposed to the inhibitor as assessed by Northern blot and real-time PCR (Figure 2B).
Differential expression of SOCS-2 in human leukemic cell lines.
(A,B) Northern blot of human leukemic cell lines exposed (+) or not (−) to 1 μM STI571 for 3 to 24 hours. Numbers below the blots represent the densitometric analysis of SOCS-2 levels, expressed as the ratio SOCS-2/β-actin before (−) and after (+) exposure to STI571.
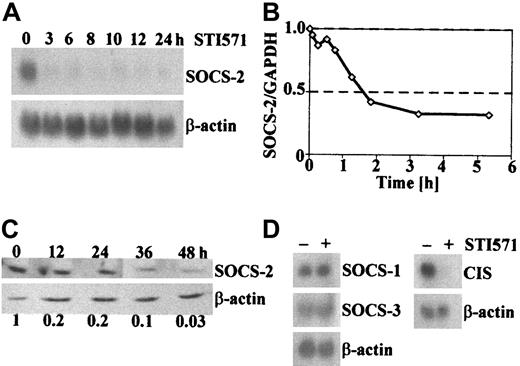
More detailed time-course experiments by RT-PCR, Northern, and Western blotting revealed that SOCS-2 down-regulation in the most responsive BCR-ABL–positive cell lines is first observed after 1 hour of STI571 treatment, peaks at approximately 2 hours and persists for at least 24 to 48 hours (Figure 3A-C).
In order to investigate whether the observed pattern of differential expression after inhibition of the Bcr-Abl tyrosine kinase was limited to SOCS-2 or represented a general phenomenon in the family of SOCS genes, we analyzed the expression of CIS,SOCS-1, and SOCS-3 in KYO1 and other cell lines treated or not treated with STI571. No difference in the RNA levels ofSOCS-1 and SOCS-3 were detected, whereasCIS proved to be differentially expressed (Figure 3D).
Expression of SOCS-2 and related SOCS proteins after short-term exposure to STI571.
(A) Northern blot of KYO1 cells exposed to 1 μM STI571 for the indicated lengths of time. (B) Real-time RT-PCR from KYO1 cells exposed to 1 μM STI571 for various lengths of time. Results are expressed as ratios SOCS-2/GAPDH as compared with cells not exposed to STI571. (C) Immunoblot from BV173 cells exposed to 1 μM STI571 for the indicated time. Numbers below the blots represent the densitometric ratios SOCS-2/actin as compared with the nonexposed cells. (D) Northern blot of KYO1 cells exposed (+) or not (−) to 1 μM STI571 for 10 hours, probed with SOCS-1, SOCS-3, and CIS.
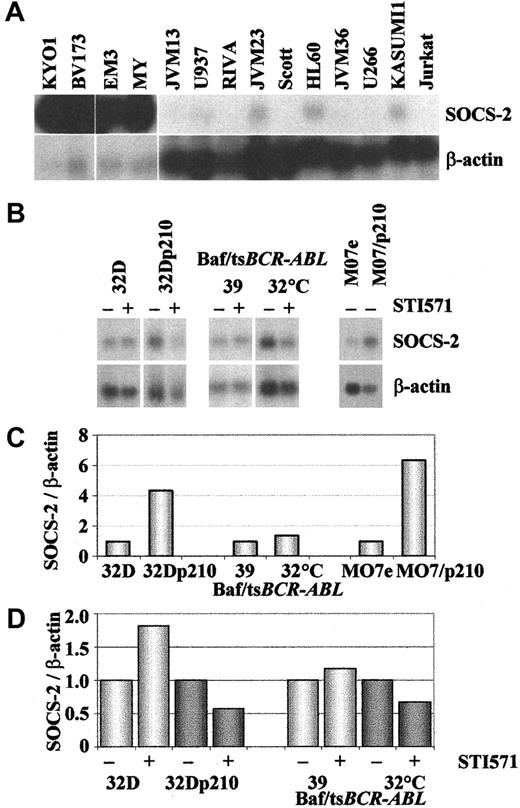
Comparison of the basal level of SOCS-2 expression in 17BCR-ABL–positive and 13 BCR-ABL–negative cell lines confirmed that this was much higher in the former group, withBCR-ABL–negative cell lines exhibiting either no signals or only hardly detectable signals (Figure4A).
SOCS-2 expression in
BCR-ABL–positive as compared withBCR-ABL–negative cell lines. The upper 2 panels show Northern blots hybridized with SOCS-2 and β-actin of (A) human hematopoietic cell lines, (B) human and murineBCR-ABL–transfected cell lines and their parental counterparts exposed (+) or not (−) to 1 μM STI571 for 10 to 24 hours. The lower 2 panels show densitometric analyses ofSOCS-2/β-actin signals from the Northern blots in panel B: (C) baseline expression in cells not exposed to STI571, demonstrating up-regulation of SOCS-2 in BCR-ABL–positive cells (for comparative purposes, the SOCS-2 signals inBCR-ABL–negative lines were normalized to 1); (D)SOCS-2 down-regulation upon STI571 treatment (for comparative purposes, SOCS-2 levels in nonexposed cells were normalized to 1).
Finally, we tested whether ectopic expression of BCR-ABL in human or murine cell lines affected the levels of SOCS-2. The experimental models were represented by the paired MO7e and MO7/p210, the 32D and 32Dp210 cell line,29 and the Baf/tsBCR-ABL thermosensitive cells at the permissive (32°C) and restrictive (39°C) temperatures for activity of the oncoprotein. Baseline expression of SOCS-2 was higher in theBCR-ABL–expressing cell lines (Figure 4B,C). Like the human Ph-positive lines, the murine BCR-ABL–expressing cells showed down-regulation of SOCS-2 after inhibition of the Bcr-Abl tyrosine kinase with STI571, in contrast to 32D and Baf/tsBCR-ABL at 39°C (Figure 4B,D). Addition of IL-3 to the BCR-ABL–positive cell lines resulted in partial (32Dp210) or complete (Baf/tsBCR-ABL) abolition of the STI571 effect, with no difference in the SOCS-2 baseline expression (data not shown).
Primary cells
SOCS-2 expression in cells from patients with CML and healthy individuals.
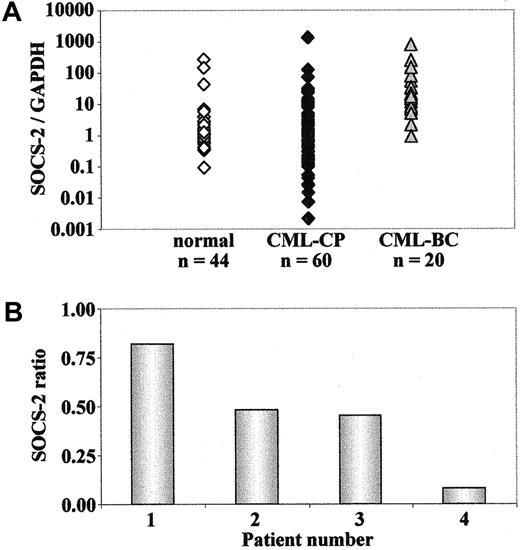
cDNA samples from 44 healthy individuals, 60 patients with CML in CP and 20 patients with CML in BC were analyzed for SOCS-2 mRNA expression by real-time RT-PCR. The patients with CML in BC showed a significantly higher level of SOCS-2expression as compared with healthy individuals or patients with CML in CP (P < .0001), whereas no significant difference between the latter 2 groups could be detected (P = .26) (Figure5A). This was further investigated in purified CD34+ cells from 5 patients with CML in CP and 8 healthy individuals. The results confirmed that no significant differences could be detected between these 2 groups (P = .77). Similarly, comparison of the level ofSOCS-2 mRNA between total WBCs and CD34+ cells in patients with CML and in healthy individuals showed that the 2 populations of cells have a similar level of SOCS-2expression, with no significant difference in either of the 2 groups (P = .35 for patients with CML, P = .20 for healthy individuals) (data not shown). All in all, the data indicate that SOCS-2 is overexpressed in patients with CML at the BC stage, as compared with the CP stage of the disease.
SOCS-2 expression in primary CML blast cells.
Real-time RT-PCR for SOCS-2 of cDNA samples from patients with CML in CP or BC or from healthy individuals. Results have been normalized by comparison to their GAPDH mRNA expression. (A) cDNA samples from patients with CML in CP or BC and from healthy individuals. (B) cDNA samples from 4 patients with CML in BC during treatment with STI571. Data are compared with the gene expression levels before initiation of therapy.
SOCS-2 expression after in vitro exposure to STI571.
Next, we examined the levels of SOCS-2 mRNA in MNCs from 4 patients with CML in myeloid BC, and in CD34+ cells from 4 patients with CML in CP and 8 healthy adults, after culture in RF-10 medium for 24 hours and in the presence or absence of 1 μM STI571 for another 24 hours. No significant modulation ofSOCS-2 expression after treatment with the kinase inhibitor was detected in either patients with CML in CP or healthy individuals. In contrast, 3 out of 4 patients with CML in BC showed a 2-fold to 12-fold down-regulation of SOCS-2 levels in response to in vitro exposure to STI571 (Figure 5B). Taken together, these results suggest that SOCS-2 overexpression in CML-BC cells can be reduced when the Bcr-Abl tyrosine kinase activity is inhibited.
SOCS-2 expression in patients with CML treated with STI571.
In order to investigate whether SOCS-2 expression in patients with CML could be also modulated in vivo by STI571, we examined the levels of SOCS-2 mRNA in MNCs from patients before and at various intervals during the first 4 to 5 weeks of treatment with the drug. Pilot analyses by both Northern blot and real-time RT-PCR in samples from myeloid BC showed a 2-fold to 14-foldSOCS-2 down-regulation in 4 of 5 patients, starting from day 4 to day 8 of treatment, and persisting for 2 to 4 weeks (Figure6). In the fifth patient, the levels ofSOCS-2 decreased 2.5-fold within the first week, but returned to the high pretreatment values at around day 14, when the patient was reported to be suffering from nausea and severe vomiting, suggesting that the intake/absorption of the drug might have been significantly impaired.
SOCS-2 mRNA expression in patients with CML in BC responding to STI571 therapy.
Northern blots of RNA from 5 patients with CML in myeloid BC before and during STI571 therapy, probed with SOCS-2 andβ-actin. The numbers below the blots refer to the densitometric calculation of SOCS-2 levels, normalized toβ-actin. For interindividual comparison of samples, levels before therapy were defined as being 1, and levels under therapy were compared with that value.
Having confirmed a close linear regression (r2 = 0.97) between the Northern and the real-time RT-PCR assays, we used the latter method to extend the investigation to patients in all stages of the disease. We studied 16 patients with CML in CP refractory or intolerant to interferon alpha (IFN-α), 9 in AP, 12 in BC, and 3 with Ph-positive ALL in relapse for up to 16 weeks of treatment with STI571. Although there was a trend for a higher frequency of patients exhibiting SOCS-2 down-regulation after treatment in the BC, AP, and Ph-positive ALL groups as compared with those in the CP cohort, the difference was not statistically significant (data not shown). However, taking the clinical course of the patients into account, a direct correlation was observed between the change in SOCS-2mRNA expression and the response to treatment as assessed by the percentage of blasts in the peripheral blood and bone marrow. In 7 out of 8 patients in BC a reduction of blasts under STI571 treatment was accompanied by a reduction in SOCS-2 levels; the remaining patient showed a decrease in the number of blasts, but stable levels ofSOCS-2. In contrast, all 3 patients in BC not responding to STI571 had persistent or increasing levels of SOCS-2. A similar phenomenon was observed in the 3 patients with Ph-positive ALL, in whom a reduction in the number of blasts during treatment with STI571 was accompanied by decreasing levels of SOCS-2. Furthermore, when one of these patients relapsed while on STI571, a 6-fold increase in SOCS-2 expression was detected in the peripheral blood MNCs (Table 1).
SOCS-2 expression in patients with chronic myeloid leukemia in blast crisis or Ph-positive acute lymphocytic leukemia under STI571 therapy
| Patient no. . | Diagnosis . | Days on STI571 . | % of blasts . | SOCS-2/GAPDH ratio . | |
|---|---|---|---|---|---|
| PB . | BM . | ||||
| 1 | CML-BC | 0 | 42 | 40 | 3.2 |
| (myeloid) | 8 | 12 | nd | 0.2 | |
| 2 | CML-BC | 0 | 23 | 60 | 7.2 |
| (myeloid) | 7 | 4 | nd | 2.7 | |
| 14 | 0 | nd | 1.4 | ||
| 3 | CML-BC | 0 | 25 | 50 | 3.7 |
| (myeloid) | 4 | 42 | nd | 3.0 | |
| 11 | 11 | nd | 5.9 | ||
| 20 | 15 | 35 | 0.9 | ||
| 49 | 4 | nd | 0.8 | ||
| 84 | 4 | 15 | 0.7 | ||
| 4 | CML-BC | 0 | 9 | 70 | 20.5 |
| (myeloid) | 21 | 4 | nd | 5.0 | |
| 28 | 0 | nd | 6.4 | ||
| 113 | 0 | 6 | 5.8 | ||
| 5 | CML-BC | 0 | 44 | 25 | 6.1 |
| (myeloid) | 36 | nd | 2 | 4.4 | |
| 43 | 0 | nd | 4.1 | ||
| 50 | 0 | nd | 5.2 | ||
| 85 | 0 | 1 | 0.3 | ||
| 6 | CML-BC | 0 | 34 | 100 | 16.4 |
| (myeloid) | 35 | 5 | 10 | 5.3 | |
| 56 | nd | 0 | 2.2 | ||
| 7 | CML-BC | 0 | 6 | 30 | 4.4 |
| (myeloid) | 26 | nd | 10 | 5.6 | |
| 8 | CML-BC | 0 | 66 | 50 | 6.0 |
| (myeloid) | 5 | 79 | nd | 5.9 | |
| 9 | CML-BC | 0 | 48 | 80 | 7.8 |
| (myeloid) | 26 | 62 | 70 | 29.6 | |
| 82 | nd | 80 | 23.3 | ||
| 10 | CML-BC | 0 | 16 | 32 | 5.0 |
| (myeloid) | 25 | nd | 32 | 4.5 | |
| 11 | CML-BC | 0 | 15 | 90 | 30.1 |
| (lymphoid) | 113 | 0 | 20 | 8.2 | |
| 12 | Ph+ ALL | 0 | 19 | 95 | 15.5 |
| 28 | nd | 20 | 2.9 | ||
| 63 | 0 | 36 | 3.1 | ||
| 13 | Ph+ ALL | 0 | 8 | 90 | 2.4 |
| 7 | nd | nd | 1.0 | ||
| 35 | nd | 18 | 1.8 | ||
| 58 | nd | 80 | 15.1 | ||
| 14 | Ph+ ALL | 0 | 78 | 80 | 0.3 |
| 71 | nd | 2 | 0.1 | ||
Levels of SOCS-2, expressed as a ratio ofSOCS-2/GAPDH, are correlated with the duration of treatment and the response to STI571 therapy as assessed by the percentage of blasts in the peripheral blood or bone marrow.
GAPDH indicates glyceraldehyde phosphate dehydrogenase; CML-BC, chronic myeloid leukemia in blast crisis; PB, peripheral blood; BM, bone marrow; nd, not determined; and Ph+ ALL, PH-positive acute lymphocytic leukemia.
No differences in baseline (pretreatment) expression ofSOCS-2 between STI571-responders and nonresponders was observed (P = .87). Interestingly, patients in CP seemed to segregate into 3 groups characterized by increasing (n = 5), decreasing (n = 6), and unaltered (n = 5) levels ofSOCS-2 during STI571 treatment. Since the follow-up period for these patients is still rather short, it is not yet possible to test whether these findings are of prognostic value in terms of cytogenetic response or overall survival.
SOCS-2 expression upon inhibition of downstreamBCR-ABL effectors
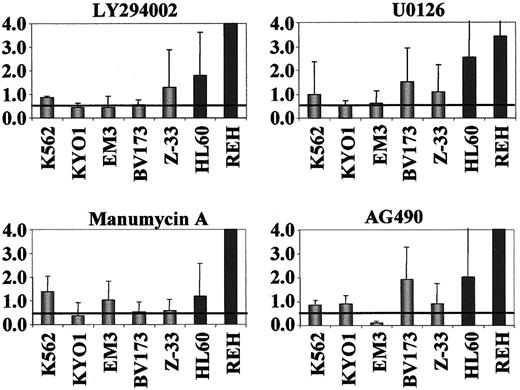
In order to identify the signal transduction pathways through which STI571 down-regulates SOCS-2 inBCR-ABL–positive cells, we exposed 5 of these lines to a series of signal transduction inhibitors (STIs). TheBCR-ABL–negative cell lines HL60 and REH were used as controls for these experiments. A dose-response curve was initially generated for each STI by flow cytometric analysis of PI-stained cells. Triplicate fresh cultures were then treated with the maximum dose of each compound found to induce less than 5% apoptotic death within a maximum 24-hour exposure, and harvested at the appropriate time-points for real-time RT-PCR. In comparison with theBCR-ABL–negative cells, the BCR-ABL–positive lines had on average a significant down-regulation of SOCS-2after exposure to the PI3 kinase (LY294002) inhibitor (P = .007), but not after treatment with the Ras (manumycin A), MEK (U0126), and Jak2 (AG490) inhibitors. None of the compounds induced SOCS-2 down-regulation in theBCR-ABL–negative cell lines tested (Figure7). Similar analyses in primary blast cells from 2 patients with CML in myeloid BC showed a marked reduction in SOCS-2 levels after exposure to U0126, but not consistently to the other inhibitors (not shown). Limitation in the number of available cells prevented the establishment of preliminary dose-response curves by fluorescence activated cell sorting (FACS) in these patients, and it is possible that the STI doses used to treat these samples were not optimal.
SOCS-2 expression inBCR-ABL–positive andBCR-ABL–negative cell lines after exposure to inhibitors of signal transduction pathways.
We exposed 3-5 × 10⁵ cells to 25 μM LY294002 for 1 hour, 10 μM U0126 for 1 hour, 10 μM manumycin A for 2.5 to 4 hours, or 10 μM AG490 for 24 hours. SOCS-2 expression was determined by real-time RT-PCR and normalized for GAPDH levels. Results represent the SOCS-2 levels as compared to nonexposed control cells. BCR-ABL–positive, gray bars;BCR-ABL–negative, black bars.
CIS expression in BCR-ABL–positive andBCR-ABL–negative leukemic cell lines
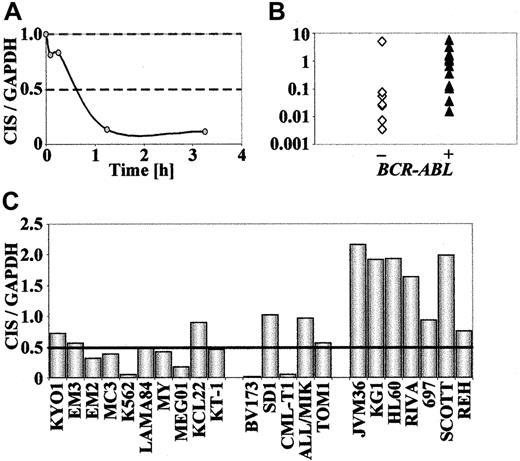
Having shown a differential expression of CIS in KYO1 cells after exposure to STI571, with a time response similar to that observed for SOCS-2 (Figure8A), we wondered whether the expression pattern of the CIS gene was similar to that ofSOCS-2. Because only a minority ofBCR-ABL–positive and BCR-ABL–negative cell lines (KYO1, CML-T1, BV173, and NALM1) exhibited CIS signals by Northern blotting, we performed these studies by real-time PCR. The baseline expression in the BCR-ABL–positive cell lines proved to be significantly higher than in theBCR-ABL–negative cells (P = .02) (Figure 8B), confirming a more than 2-fold down-regulation of CIS levels after STI571 exposure in 10 out of 15 BCR-ABL–positive cell lines tested. The remaining 5 cell lines, including 2 (KCL22, SD1) that are resistant to STI571, showed no significant differences inCIS expression levels. Likewise, no STI571-inducedCIS modulation was observed in 7BCR-ABL–negative cell lines studied (Figure 8C). In primary cells, however, we have so far been unable to detect any correlation between the expression pattern of CIS and the stage of disease or the response to STI571 treatment (data not shown).
CIS expression inBCR-ABL–positive and BCR-ABL–negative cell lines.
Real-time RT-PCR amplification of CIS from human hematopoietic cell lines, shown as ratios of CIS/GAPDHexpression. For STI571-exposed cells, results are expressed in comparison to cells not exposed to the compound. (A) Time-course ofCIS expression in KYO1 cells exposed to 1 μM STI571. (B) Baseline expression of CIS in human hematopoietic cell lines. (C) CIS expression after exposure to 1 μM STI571 for 10 to 24 hours.
Ectopic induction of SOCS-2 overexpression
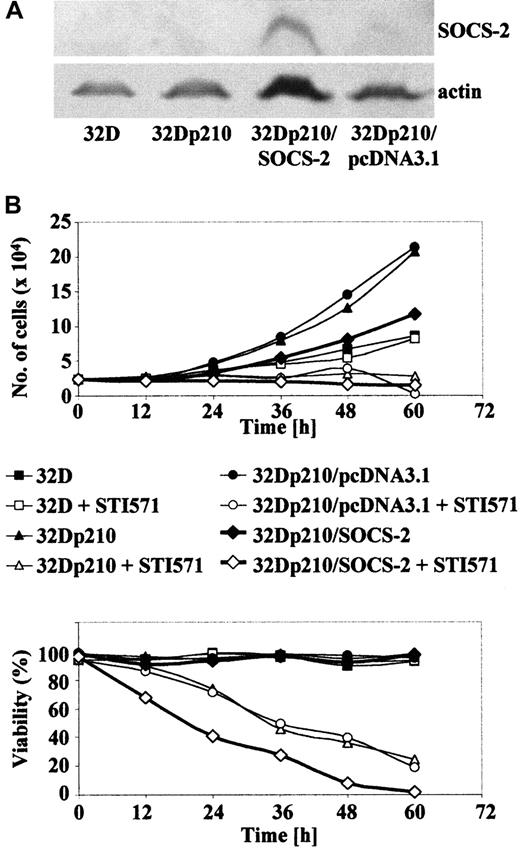
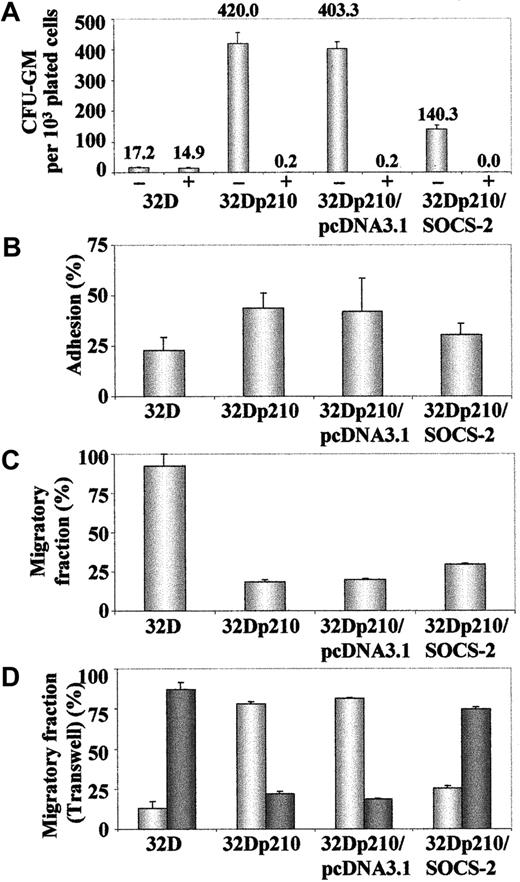
A Myc-tagged SOCS-2 cDNA was stably transfected into 32Dp210 cells, clones were selected in semisolid medium, and the overexpression of SOCS-2 was confirmed by Western blotting (Figure 9A). Similar attempts to generateSOCS-2–transfected 32D cells were unsuccessful, as the antibiotic-selected clones did not survive beyond a few passages in liquid culture. The 32Dp210/SOCS-2 cells showed an impaired growth in liquid culture when compared with their parental 32Dp210 counterparts or cells transfected with pcDNA3.1 only. Moreover, 32Dp210/SOCS-2 cells died more rapidly than 32Dp210 upon exposure to 1 μM STI571 (Figure 9B). These findings were confirmed by plating the cells in methylcellulose, where 32Dp210/SOCS-2cells were significantly less clonogenic than 32D cells transfected with BCR-ABL alone (P = .05), but still showed a higher clonogenicity than 32D cells (P = .05) (Figure10A). We also observed a small though nonsignificant trend for 32Dp210/SOCS-2 cells to adhere less to plastic than the vector-only transfected control cells. However, 32Dp210/SOCS-2 cells were still more adherent than 32D cells, which are hardly adherent to either plastic or fibronectin at all, suggesting that overexpression of SOCS-2 does not completely counteract the effect of BCR-ABL in this system (Figure 10B). This observation was reinforced by the finding that a significantly higher proportion of 32Dp210/SOCS-2 cells could migrate in both the “tilted dish” assay (Figure 10C) and through a Transwell membrane (Figure 10D) than could the parental 32Dp210 cells (P = .05 in both assays).
SOCS-2 overexpression slows cell growth and sensitizes cells to STI571-induced death.
(A) Protein extracts from 107 cells were separated on a 12% SDS-PAGE gel and stained for SOCS-2 and actin. (B) 2.5 × 10⁴ cells/mL were seeded in tissue culture flasks with or without 1 μM STI571. Cell proliferation (top panel) and viability (bottom panel) were assessed by trypan blue staining. Cultures were fed every 48 hours as required.
SOCS-2 inhibits colony formation and decreases the adhesive capacity of 32Dp210 cells.
(A) Cells were plated in triplicate in methylcellulose with or without 1 μM STI571, and numbers of granulocyte macrophage–colony-forming unit (CFU-GM) colonies were determined after 7 days of culture. Results represent the mean plus or minus standard deviation of colony numbers, normalized to 103 plated cells. (B) Cells were plated in quadruplicate in 96-well flat bottom plates. After 24 hours and 2 washes in PBS, numbers of adherent cells were determined by MTS staining. Data are expressed as a ratio adherent–total number of cells. (C) Cells were plated in a 48-well tissue culture plate coated with the CH-296 fibronectin fragment. The number of migrating cells was assessed as described.26 Results were normalized against the cells kept in wells under the same conditions with PBS/2% BSA. (D) Cells were plated in the top chamber of a 5.0-μm Transwell plate. After 24 hours, the numbers of cells that had migrated to the lower chamber (dark bars) and those that remained in the Transwell (light bars) were determined by hemocytometer counting of trypan blue–stained cells.
Discussion
In spite of the successful use of STI571 in clinical trials30,31 and of the elucidation of its binding properties to the Abl kinase domain,32 the downstream mechanisms of STI571 action are still poorly defined. When “switching off” the tyrosine kinase activity of Bcr-Abl with STI571 we identified SOCS-2 as a differentially expressed gene. The evidence that SOCS-2 is in fact a downstream target of Bcr-Abl was provided by several observations. Thus,BCR-ABL–positive (CML and Ph-positive ALL) cell lines not only have a significantly higher level of SOCS-2 expression than BCR-ABL–negative leukemia lines, but also show a selective down-regulation of SOCS-2 mRNA and protein upon STI571 treatment. The fact that BCR-ABL–positive lines resistant to STI571 do not exhibit such down-regulation when exposed to the tyrosine kinase inhibitor strengthens the argument. Furthermore, comparisons between BCR-ABL–transfected and parental (BCR-ABL–negative) murine and human cell lines confirmed a marked higher level of SOCS-2 expression in the former, demonstrating that its induction is effected by the leukemic fusion protein.
SOCS-2 overexpression is also evident in primary cells from patients with Ph-positive ALL and CML, where it appears to be exclusive to the advanced stages of disease. This was shown by the higher basal levels of SOCS-2 in BC as compared with CP cells, and by both in vitro and in vivo responses to STI571 in blasts from advanced-stage disease only. The reasons for this association are not clear. We found that the levels of SOCS-2 expression in total WBCs and purified CD34+ cells were entirely comparable, indicating that the disparity in SOCS-2expression between CP and BC is not due to a maturation-dependent variance in SOCS-2 regulation. It could be argued that rather than being induced by Bcr-Abl itself, SOCS-2overexpression is a response to a secondary mutation that appears only at blastic transformation. This appears as highly unlikely, since no universal abnormality has so far been identified as a cause of BC. Similarly, it is possible that SOCS-2 up-regulation by Bcr-Abl in the advanced phases of CML reflects cooperative activation by the IGF-1 receptor, although there is so far no evidence that this pathway is preferentially activated in BC. Alternatively,SOCS-2 induction may be a dose-dependent event, requiring a certain threshold of Bcr-Abl expression to take place. This possibility seems more plausible, as there is some evidence that BC cells express more Bcr-Abl than CP progenitors.33
The phenomenon is not universal to all SOCS proteins, but rather specific to the most functionally related pair (SOCS-2 and CIS)34 whose protein sequences (accession nos. AAC34745 andBAA92328, respectively) are 39% identical and 52% similar. Yet, these would appear as less likely candidates for involvement in a hematopoietic disorder than, for example, SOCS-1, whose role in some aspects of hematopoiesis is better defined.35-37Thus, SOCS-2–deficient mice are notoriously abnormal in their endocrine system, suffering from gigantism due to lack of appropriate feedback control of the GH/IGF-I axis.11 Yet, no obvious hematologic abnormality was identified during their early adult life. It is possible however that in the hematopoietic system, inappropriate up-regulation rather than lack of expression is the important pathologic event. At least in leukemic cell lines, the induction of SOCS-2 by Bcr-Abl appears to be mediated via multiple pathways. However, it seems that the PI3 kinase is the main signal transduction molecule involved, whereas Ras, MEK, and Jak2 are affected in some cellular systems but not in others. In contrast,SOCS-2 expression was not inhibited inBCR-ABL–negative cell lines by any of the compounds tested, suggesting that all these cascades may be selectively utilized by Bcr-Abl for the transcriptional regulation of SOCS-2. The few data available on the mechanisms of SOCS-2 induction come again from the GH activation system which largely signals through IGF-I and this, in turn, via the PI-3K and MAPK pathways.12 13 The intermediates required by Bcr-Abl for activation of these kinases in the process of SOCS-2up-regulation are still unknown.
The main and rather intriguing question arising from our observations is obviously that of the possible function of SOCS-2 in the pathogenesis of CML. By definition, the SOCS proteins “suppress” cytokine signaling and provide a safeguard to avoid continuous stimulation of transcription of “important” genes when a receptor is engaged by its cytokine. The fact that Bcr-Abl inducesSOCS-2 and CIS expression appears paradoxical as, in this case, the net effect should be the prevention of continuous up-regulation of these proliferation-controlling genes. In reality, however, the opposite phenomenon characterizesBCR-ABL–positive leukemia, where deregulated cell growth is a key phenotypic feature. One possibility is that SOCS-2 may not be a true “suppressor” protein in all cellular systems,12,38,39 and that increased expression ofSOCS-2 (as in BCR-ABL–positive cells) restores sensitivity to cytokine signaling by overcoming the inhibitory effect of the other SOCS proteins, particularly SOCS-1.40 An alternative explanation is that in a situation analogous to that triggered by a cytokine-receptor engagement, SOCS-2 is produced in response to constitutive Bcr-Abl signaling but, by mechanisms still not known, accumulates and is not capable of closing the conventional feedback circuit.41 In such scenario, it would appear that SOCS-2 overexpression per se is not causally related to the oncogenic phenotype, but rather its inability to bind to and suppress Bcr-Abl is the contributing factor to the deregulated proliferation of CML. Our data on transduction ofSOCS-2 into BCR-ABL–positive cells suggest that the latter possibility is more likely. Thus, ectopic overexpression of the protein was able to only partially overcome the cellular effects of Bcr-Abl, by reducing the rate of proliferation, increasing the sensitivity to STI571-induced cell death, and reverting the motility properties of the transfected cells. The fact that theBCR-ABL “positive” signal is stronger thanSOCS-2 and CIS “repressive” influence is also illustrated by the inability of ourselves (data not shown) and others42 to isolate SOCS-2–overexpressing clones from BCR-ABL–negative cells (eg, 32D), which invariably stopped proliferating and died shortly after transfection. A third alternative could in fact be a combination of the first 2, that is, the possibility that within the same cellular system (BCR-ABL–positive leukemias) SOCS-2 may have dual suppressive and stimulating effects, depending on its concentration in the cell.40 Additional studies on the mechanisms of SOCS-2 activation in CML are currently under way to elucidate its possible role in disease progression.
We thank Professor A. Yoshimura (Kurume, Japan) for providingSOCS-2 constructs and Dr Elisabeth Buchdunger (Novartis, Basel, Switzerland) for STI571. We thank the following individuals for cell lines: Dr Fred Falkenburg and B. Nijmeijer (LeidenCML-B; Leiden University Medical Center, Leiden, The Netherlands), Dr S. Mizutani (AR230; National Children's Medical Research Center, Tokyo, Japan), Dr H. Yamauchi (KT1; Ehime University School of Medicine, Japan), Dr K. Inokuchi (MY; Nippon Medical School, Tokyo, Japan), Dr Brian Druker (32D and 32Dp210; Oregon Health Sciences University, Portland, OR), Dr François X. Mahon (Baf/tsBCR-ABL; Université de Bordeaux, France), Dr Felipe Prosper (MO7e and MO7/p210; Clinica Universitaria de Navarra, Pamplona, Spain).
Supported by grants from the Leukaemia Research Fund, London, United Kingdom; and the Dr Mildred Scheel-Stiftung für Krebsforschung, Bonn, Germany.
The publication costs of this article were defrayed in part by page charge payment. Therefore, and solely to indicate this fact, this article is hereby marked “advertisement” in accordance with 18 U.S.C. section 1734.
References
Author notes
Junia V. Melo, Department of Haematology, Imperial College of Science, Technology and Medicine, Hammersmith Hospital, Ducane Rd, London W12 0NN United Kingdom; e-mail: j.melo@ic.ac.uk.


This feature is available to Subscribers Only
Sign In or Create an Account Close Modal