Abstract
Mouse spleen contains CD4+, CD8α+, and CD4−/CD8α− dendritic cells (DCs) in a 2:1:1 ratio. An analysis of 70 surface and cytoplasmic antigens revealed several differences in antigen expression between the 3 subsets. Notably, the Birbeck granule–associated Langerin antigen, as well as CD103 (the mouse homologue of the rat DC marker OX62), were specifically expressed by the CD8α+ DC subset. All DC types were apparent in the T-cell areas as well as in the splenic marginal zones and showed similar migratory capacity in collagen lattices. The 3 DC subtypes stimulated allogeneic CD4+ T cells comparably. However, CD8α+ DCs were very weak stimulators of resting or activated allogeneic CD8+ T cells, even at high stimulator-to-responder ratios, although this defect could be overcome under optimal DC/T cell ratios and peptide concentrations using CD8+ F5 T-cell receptor (TCR)–transgenic T cells. CD8α− or CD8α+DCs presented alloantigens with the same efficiency for lysis by cytotoxic T lymphocytes (CTLs), and their turnover rate of class I–peptide complexes was similar, thus neither an inability to present, nor rapid loss of antigenic complexes from CD8α DCs was responsible for the low allostimulatory capacity of CD8α+ DCs in vitro. Surprisingly, both CD8α+ DCs and CD4−/CD8− DCs efficiently primed minor histocompatibility (H-Y male antigen) cytotoxicity following intravenous injection, whereas CD4+ DCs were weak inducers of CTLs. Thus, the inability of CD8α+ DCs to stimulate CD8+ T cells is limited to certain in vitro assays that must lack certain enhancing signals present during in vivo interaction between CD8α+ DCs and CD8+ T cells.
Introduction
Bone marrow–derived dendritic cells (DCs) are essential for the initiation of T-cell–based immune responses against foreign antigen. DCs are present in the interstitial spaces and in peripheral organs, including blood, skin, liver, and spleen but are absent from immunoprivileged sites such as brain and testis. In the periphery, DCs take up antigen and, under the stimulus of inflammatory signals, migrate via the afferent lymph into regional lymph nodes where they stimulate antigen-specific T-cell responses. It is now well established that the phenotype of DCs may differ depending on their tissue origin. For example, epithelial DCs in humans express CD1a, but this marker is absent from other DC populations including those circulating in blood1 and in dermis.2 More recent findings have demonstrated a heterogeneity in DC populations found within the same organ.3-8 Part of this heterogeneity may be explained by the existence of DCs in different states of maturation.4-6,9 However, it is now becoming clear that some of these DC populations do not interconvert during in vitro maturation and thus may derive from distinct hematologic precursors. For example, human blood DCs exist in at least 2 distinct populations, one expressing CD11c and the other interleukin-3 (IL-3) receptor α (IL-3Rα; CD123).10,11 CD11c+ DCs are the only blood DCs capable of differentiation into CD1a+, mature DCs under the aegis of granulocyte-macrophage colony-stimulating factor (GM-CSF) and IL-4,12,13 whereas IL-3Rα+ blood DCs are unique in their ability to secrete high levels of interferon-α (IFN-α).14 15
In mouse, a small subset of DCs in spleen, thymus, and lymph nodes express CD8α7,16-19 and work from the laboratory of Shortman has shown that CD8α+ DCs are defective in T-cell activation in vitro.20,21 In vivo, CD8α+ DCs are capable of inducing viral immunity but are several-fold less efficient as compared to CD8α− DCs.22Interestingly, CD8α− DCs are more efficient at presenting soluble antigens to CD4+ T cells, whereas CD8α+ DCs are superior in their ability to cross present soluble or cell-associated antigens.23,24CD8α+ DCs are major producers of IL-12 and some recent reports have emphasized the Th1 cell stimulatory capacity of the CD8+ subset.22 25-27
Murine splenic and lymph node DCs may also express CD4.16,18,19,28 Together with CD8α expression this allows splenic DCs to be separated into 3 subsets of CD4+DCs, CD8α+ DCs, and CD4−/CD8α− DCs in a 2:1:1 ratio.18,19 Only recently have comparative analyses of these 3 subsets been performed.18,29 30 In our study, we have further examined DC subsets defined by CD4 and CD8 expression and have identified additional differences in antigen expression between these subsets. Our in vitro experiments show that whereas CD8α+ DCs are capable of inducing allogeneic CD4+ T-cell proliferation, CD8α+ DCs do not induce significant proliferation in allogeneic naı̈ve CD8+ T cells or cytotoxic T lymphocytes (CTLs). This defect is not due to a disregulation of class I–peptide complex expression or turnover but can be overcome using optimum conditions in a peptide-specific transgenic CD8+ T-cell system, ruling out anergy or apoptosis induction in responding T cells as a mechanism for this defect. In contrast, after intravenous injection CD8α+ DCs prime very strong CTL responses to minor histocompatibility antigens. Therefore, in vitro interactions between CD8α+ DCs and CD8+ T cells may lack certain environmental or cellular enhancing cofactors that are present in vivo.
Materials and methods
Mice and media
C57Bl/6 or Balb/c mice were from M & B (Bomholtgard, Denmark) and class I (C57BL/6 β2m−/ −)–, class II (C57BL/6 Ab−/ −)–, or RAG-2 (B6.SJLrag-2−/ −)–deficient mice were purchased from Taconic (NY). Mice were normally used between the ages of 4 and 6 weeks and were housed in our animal facilities at the University of Würzburg. The F5 transgenic mouse line, on a RAG−/− background, ensures the expression of a T-cell receptor (TCR) on most CD8+ T cells that is specific for the 366-374 peptide of the influenza nucleoprotein (NP 366-374) in the context of H-2Db and has been described.31Media used throughout the study was RPMI-1640 or Iscoves modified Dulbecco medium (IMDM) supplemented (R10 and I10, respectively) with 10% heat inactivated fetal calf serum (Biowhittaker, Belgium), 50μM β-mercaptoethanol, 2 mM glutamine, 100 μg/mL penicillin, and 50μg/mL streptomycin. For DC culture, R10 was supplemented with 5% culture supernatant (csn) from the murine GM-CSF secreting Ag8653 myeloma line.32
Isolation of DCs
Low-density spleen DCs were enriched by density gradient centrifugation from fresh spleen using a modified method of Vremec et al.3 Normally, 6 spleens were teased out in Petri dishes, by tearing the splenic capsule at the thick end, keeping the rest of the capsule intact, and gently squeezing out the splenic contents. The fragmented spleens were transferred to a 50-mL polypropylene tube and incubated with 1 mg/mL type I collagenase (Worthington) and DNase I (10 μg/mL) in 20 mL 25 mM IMDM with 2% fetal calf serum (FCS) for 30 minutes at 37°C with gentle shaking. For the last 5 minutes 10 mM EDTA was added and spleen fragments were then pressed through a metal tea-sieve and collected into cold 5 mM EDTA, 10 μg/mL DNase I, 1% bovine serum albumin (BSA) in phosphate-buffered saline (PBS) in a Petri dish. Cells were filtered (70-μm cell strainers, Falcon) and washed twice in cold PBS/EDTA/BSA/DNase I. The digest from every three spleens was then resuspended in ice cold, isosmotic 5 mL 14.1% Nycodenz (Nycomed, Pharma Oslo, Oslo, Norway) in a 15-mL tube, overlaid with 2 mL mouse isosmotic buffer3 and centrifuged for 25 minutes at 600g. Typically 107 low-density cells with a CD11c+DC content of 20% to 40% were obtained from each spleen. Immunomagnetic depletion was performed in some experiments to purify DCs prior to flow cytometric analysis. Low-density spleen cells were incubated with Gr-1 (RB6-8C5), CD19 (1D3), Ly49G (4D11), and Thy-1.2 (30-H12) for 30 minutes on ice, washed twice, resuspended at 108 cells/mL in PBS/10% goat serum/5 mM EDTA and 20μL 10 times magnetically concentrated BioMag antirat IgG (Perseptive Diagnostics, Polysciences, Eppelheim, Germany) beads per 107 cells added. After 30 minutes at 6°C, the cell slurry was diluted to 5 mL with cold BSA/EDTA/PBS and the tube placed against a strong magnet for 3 minutes. Residual bead-bound cells in the supernatant were then removed by direct passage through a large cell MACS column in a VarioMACS magnet (Miltenyi-Biotec, Bergisch Gladbach, Germany). Purity of low-density DCs recovered following magnetic depletion ranged from 70% to 80%. In other experiments, DCs were positively selected to more than 96% purity using CD11c-coated MACS beads (Miltenyi-Biotec) and by retention, washing, and release steps performed in large cell columns, exactly as described by the manufacturer.
T-cell isolation, proliferation assays, and CTL killing of DCs
Total T cells were prepared from spleen or lymph node by filtration through nylon wool. CD8+ T cells were prepared by immunomagnetic depletion using CD4 (GK1.5), CD19 (1D3), LY49G (4D11), and class II (2G9; anti-IA/IE) as described above for DC isolation. No difference was noted in T cells isolated from spleen or lymph node in terms of proliferation induced by the various DC subsets (data not shown). Allogeneic CTL lines were prepared according to Matzinger.33 Briefly, stimulator spleen cells from either Balb/c or C57Bl/6 mice were treated with mitomycin C (25 μg/mL; 30 minutes) or irradiated (25 Gy) and cultured for 5 days with allogeneic Balb/c or C57BL/6 spleen cells (2 × 10⁶ stimulators with 4 × 10⁶ responders in 2 mL complete IMDM per well in 24 well plates). For CTL proliferation assays allogeneic cultures were washed once in PBS and the blasts isolated by Lympholyte-M gradient (Cederlane; 1000g; 20 minutes, room temperature). Recovered blasts were immunomagetically depleted of CD19, Gr-1, LY49G, and CD4+ cells as described above. Purified CD8+ T-cell suspensions contained no detectable CD4+ T cells as assessed by flow cytometry. For allogeneic T-cell proliferation assays, graded doses of FACS-sorted DCs were added to 5 to 10 × 104 T cells as indicated in the figure legends. To monitor sensitivity of DCs to CTL killing, MACS-purified CD11c+ DCs were labeled with 5-chloromethylfluorescein diacetate (CMFDA; 2 μM; 10 minutes at 37°C; Molecular Probes, Eugene, OR) extensively washed and then 2 × 10⁵ DCs incubated with various doses of allogeneic CTLs in 1 mL low-adhesion microtiter tubes (QSP, Biozym, Hess, Germany) with 5% GM-CSF csn, to minimize spontaneous DC apoptosis. After 4 hours, the cultures were pelleted and labeled with phycoerythrin (PE)–conjugated CD8α monoclonal antibody (mAb) for 30 minutes, washed, and resuspended in 200 μL PBS/2% FCS with 2 μg/mL propidium iodide (PI). The same volume was acquired for each tube during FACS acquisition using a constant time (30 seconds) acquisition, as previously described.34 The absolute numbers of viable DCs in the CTL/DC cultures from each subset were then determined by gating CD8α−/CMFDA+/PI− or CD8α+/CMFDA+/PI− events during analysis.
In vivo priming for H-Y antigen cytotoxicity
For determination of in vivo priming for cytotoxicity by DC subsets, 1 to 5 × 10⁵ sorted C57/BL6 male DCs were injected into the lateral tail vein of female mice in 200 μL Hanks balanced salt solution (HBSS). After 14 to 20 days, spleens were removed and 4 × 10⁶ female splenocytes restimulated with 2 × 10⁶ male splenocytes in 2 mL I10 in 24-well plates. The “Just Another Method” (JAM) 3H-thymidine–based cytotoxicity assay was performed as described by Matzinger.33 Briefly, each well of restimulated splenocytes was resuspended in 0.4 mL I10 and the effectors diluted 3-fold in V-bottom plates (651 101; Greiner, Frickenhausen, Germany). Two day concanavalin A (Con A; 2 μg/mL) blasts from male or female splenocytes were labeled for the last 16 hours (at 2.5 × 10⁶/mL) with 5 μCi (0.185 MBq)/mL3H-thymidine, washed thrice in 2% FCS/PBS, and resuspended at 2 × 10⁵/mL in I10. Each 100-μL well of effectors received 50 μL blasts. The plates were spun (2 minutes, 400g) and after 3.5 hours, DNA fragmentation in the targets was determined by liquid scintillation counting and percent cytotoxicity determined from the counts per minute as: (Spontaneous−Experimental/Spontaneous)× 100.
Cell labeling and FACS
The mAbs applied in this study are listed in Table1. All incubation steps were 30 minutes on ice followed by a wash in cold 0.2% BSA/PBS. Low-density spleen cells were labeled with 50 μL N418 (hamster antimouse CD11c) csn and the appropriate rat mAb as indicated in Table1. Washed cells were incubated with multiple species Ig-adsorbed fluorescein isothiocyanate (FITC)–antihamster Ig (Dianova) and PE-antirat Ig (Dianova). Cells were then washed and blocked in 25 μL 10% rat serum and Cy5-PE–conjugated CD4 (GK1.5), CD8 (53-6.7), or control IgG-conjugate added (Southern Biotechnology Associates, Eching, Germany). Cytoplasmic antigens were detected using the An der Grub kit (Dianova, Hamburg, Germany). For cell sorting, labeled low-density spleen cells were resuspended at 5 × 10⁷ cells/mL in PBS plus 1 mM EDTA and sorted into CD11c+/CD4−/CD8α−, CD11c+/CD4+/CD8α−, and CD11c+/CD4−/CD8α+ subsets using a FACS Vantage cell sorter (Becton Dickinson, Heidelburg, Germany). SIINFEKL (single letter amino acid codes) peptide bound to H-2Kb was detected on the surface of CD11c+MACS-purified DCs as described in Figure 9 using the 25-D1.16 mAb35 (mouse IgG1).
Intensity of expression of various surface and cytoplasmic antigens on the 3 DC subsets
| mAb . | CD4−/8− . | CD4+ . | CD8+ . | Clone . | Isotype . | Source . |
|---|---|---|---|---|---|---|
| Lineage | ||||||
| *CD1d | −↑ | +↑ | −↑ | 1B1 | Rat IgG2b | Pharmingen |
| CD3 | − | − | − | 17A2 | Rat IgG2b | Pharmingen |
| *CD4 | − | ++↓ | − | GK1.5 | Rat IgG2b | SBA |
| *CD8α | − | − | ++ | 53-6.7 | Rat IgG2a | ATCC |
| CD8β | − | − | − | 53-5-8 | Rat IgG1 | Pharmingen |
| CD13 | ++ | ++ | ++ | R3-242 | Rat IgG1 | Pharmingen |
| CD45 | ++ | ++ | ++ | 30-F11 | Rat IgG2b | Pharmingen |
| Thy 1.2 | − | − | − | 30-H12 | Rat IgG2b | ATCC |
| CD11b | + | + | − | M1/70 | Rat IgG2b | ATCC |
| CD19 | − | − | − | 1D3 | Rat IgG2a | ATCC |
| B220 | −/+ | −/+ | −/+ | RA3-6B2 | Rat IgG2a | Pharmingen |
| Ly49G | − | − | − | 4D11 | Rat IgG2b | ATCC |
| Gr-1 | − | − | − | RB6-8C5 | Rat IgG2b | ATCC |
| Dendritic cell | ||||||
| CD11c | ++ | ++ | ++ | N418 | Ham IgG | ATCC |
| *Langerin | − | − | +++ | 929F3 | rat IgG1 | S Saeland |
| 4F7 | − | − | − | 4F7 | Rat IgG1 | Knop |
| CD205 (DEC-205) | +↑ | +↑ | ++ | NLDC-145 | Rat IgG2a | G Kraal |
| 2A1 | ++ | ++ | ++ | 2A1 | Rat IgG2a | R Steinman |
| *33D1 | + | + | − | 33D1 | Rat IgG2b | ATCC |
| MIDC-8 | + | + | + | MIDC-8 | Rat IgG2a | G Kraal |
| Macrophage | ||||||
| *F4/80 (red pulp Mφ) | +/− | + | − | F4/80 | Rat IgG2b | S Gordon |
| CD68 (macrosialin) | + | + | + | FA-11 | Rat IgG2a | S Gordon |
| ERTR-9 (marginal zone Mφ) | − | − | − | ERTR-9 | Rat IgM | G Kraal |
| MOMA-1 (metallophillic Mφ) | − | − | − | MOMA-1 | Rat IgG2a | G Kraal |
| MOMA-2 | − | − | − | MOMA-2 | Rat IgG2b | G Kraal |
| MAC-3 | − | − | − | M3/84 | Rat IgG1 | Pharmingen |
| MHC | ||||||
| Class I | ++↑ | ++↑ | ++↑ | M1/42 | Rat IgG2a | ATCC |
| Class II | ++↑ | ++↑ | ++↑ | M5/114 | Rat IgG2b | ATCC |
| CD74 (inv chain) | ++ | ++ | ++ | IN-1 | Rat IgG2b | N Koch |
| Costimulator | ||||||
| *CD24 | + | + | ++ | J11d | Rat IgM | Pharmingen |
| CD40 | +↑ | +↑ | +↑ | FGK-45 | Rat IgG | A Rolink |
| CD80 | −/+↑ | −/+↑ | −/+↑ | 1G10 | Rat IgG2a | Pharmingen |
| CD86 | +↑ | +↑ | +↑ | GL-1 | Rat IgG2a | ATCC |
| OX40L | − | − | − | RM134L | Rat IgG2b | Pharmingen |
| 4-1BBL | − | − | − | 1AH2 | Rat IgG1 | Pharmingen |
| Adhesion/homing | ||||||
| CD11a | ++ | ++ | ++ | FD441.8 | Rat IgG2b | ATCC |
| CD18 | +++ | +++ | +++ | C71/16 | Rat IgG2a | Pharmingen |
| CD29 | + | + | + | 9EG7 | Rat IgG2a | Pharmingen |
| *CD43 | ++ | + | + | S7 | Rat IgG2a | Pharmingen |
| *CD44 | +↑ | +↑ | ++↑ | KM201 | Rat IgG1 | SBA |
| *CD44H | ++ | ++ | +++ | TM-1 | Ham IgG | Pharmingen |
| CD54 (ICAM-1) | +↑ | +↑ | +↑ | KAT-1 | Rat IgG2a | SBA |
| *CD62L | + | + | ++ | MEL-14 | Rat IgG2a | Pharmingen |
| *CD49a (α1integrin) | −/+ | + | −/+ | Ha31/8 | Ham IgG | Pharmingen |
| CD49d (α4 integrin) | + | + | + | PS/2 | Rat IgG2b | SBA |
| *CD49e (α5integrin) | ++ | + | ++ | 5H10-27 | Rat IgG2a | Pharmingen |
| *CD49f (α6integrin) | + | + | ++ | GoH3 | Rat IgG2a | Pharmingen |
| CD61 (β3integrin) | − | − | − | 2C9G2 | Ham IgG | Pharmingen |
| *β7 integrin | + | + | ++ | M293 | Rat IgG2a | Pharmingen |
| CD102 (ICAM-2) | + | + | + | 3C4 | Rat IgG2a | Pharmingen |
| *CD103 (αIEL-integrin) | − | − | ++ | M290 | Rat IgG2a | Pharmingen |
| *CD162 (PSGL-1) | ++ | ++ | +++ | 2PH1 | Rat IgG1 | Pharmingen |
| CLA | − | − | − | HECA-452 | Rat IgM | Pharmingen |
| *α4β7(LPAM-1) | −/+ | + | − | DATK32 | Rat IgG2a | Pharmingen |
| CD106 (VCAM-1) | −/+ | −/+ | −/+ | 429 | Rat IgG2a | Pharmingen |
| mAb | CD4−/8− | CD4+ | CD8+ | Clone | Isotype | Source |
| Heat shock proteins | ||||||
| hsp70 ind | − | − | − | C92F3A-5 | Mu IgG1 | StressGen |
| hsp70 ind/con | + | + | + | N27F3-4 | Mu IgG1 | StressGen |
| hsp70 con | ++ | ++ | ++ | 1B5 | Rat IgG2a | StressGen |
| hsp90 | + | + | + | 16F1 | Rat IgG2a | StressGen |
| grp94 | ++ | ++ | ++ | 9G10 | Rat IgG2a | StressGen |
| Cytokine receptor | ||||||
| IL-4R | −↑ | −↑ | −↑ | M1 | Rat IgG2a | Genzyme |
| c-kit (CD117) | −↑ | −↑ | −↑ | 3C1 | Rat IgG2a | Pharmingen |
| *sca-1 | +↑ | +↑ | ++↑ | E13-161.7 | Rat IgG2a | Pharmingen |
| CD25 (IL-2Rα) | −↑ | −↑ | −↑ | 7D4 | Rat IgM | ATCC |
| CD123 (IL-3R) | −↑ | −↑ | −↑ | 5B11 | Rat IgG2a | Pharmingen |
| IFN-γR β-chain | + | + | + | MOB47 | Ham IgG | Genzyme |
| Miscellaneous | ||||||
| CD16/32 | − | − | − | 2.4G2 | Rat IgG2b | ATCC |
| CD81 (TAPA) | − | − | − | 2F7 | Ham IgG | Pharmingen |
| CD95 | − | − | − | RMF2 | Rat IgG1 | Coulter-Immunotech |
| CD95L | − | − | − | MFL3 | Ham IgG | Pharmingen |
The levels of expression of various surface and cytoplasmic markers on the three DC subsets are represented on a scale from − to +++ (MFI above background staining of − = 0, −/+ = 10-50, + = 50-100, ++ =. 100-500, +++ = 500-10 000). Arrows refer to increases in antigen expression detected following overnight culture and asterisks highlight markers showing differential expression on the DC subsets. For the heat shock protein expression, ind indicates inducible, and con, constitutive.
SBA indicates Southern Biotechnology Associates; ATCC, American Type Culture Collection; ham, hamster; mu, murine; MHC, major histocompatibility complex; inv, invariant chain; ICAM-1, intercellular adhesion molecule-1; PSGL-1, P-selectin glycoprotein ligand-1; CLA, cutaneous lymphocyte antigen; LPAM-1, lymphocyte Peyer patch adhesion molecule; VCAM-1, vascular cell adhesion molecule 1; TAPA, target of antiproliferative antibody.
Immunohistochemistry
Serial frozen sections of mouse spleen samples were cut at 5 μm and placed onto slides coated with 3-amino-propyltriethoxy-silane (APES; Sigma, Deisenhofen, Germany), air-dried overnight, fixed in acetone for 10 minutes, rehydrated in Tris-buffered saline (TBS; 25 mM Tris/HCl, pH 7.4, 137 mM NaCl, 2.7 mM KCl), and blocked in a mixture of 5% BSA and 5% milk powder in TBS for 5 minutes. For double immunohistochemical staining of colocalized antigens, the sections were first incubated with the hamster mAb (N418; CD11c or control) at appropriate dilution followed by biotinylated-goat antihamster Ig antibody (107-066-142; Jackson Laboratories; 1/100) and then alkaline phosphatase (AP)–labeled streptavidin (E-2636; Sigma; 1/300) for 30 minutes each. Second, the sections were incubated with the rat-antimouse antigen-specific antibody, followed by incubation of the peroxidase-labeled rabbit antirat Ig antibody (P-0450; Dako; 1/100). Prior to substrate application, endogenous AP activity was blocked with 0.1% levamisole (Sigma) in TBS, pH 8.2. As substrates for the enzymes, first the AP-detecting APIII-Kit (blue, Vector, Burlingame, CA) and then the horseradish peroxidase (HRP)–specific 3-amino-9-ethyl carbazole (AEC; red, Dako; K3461) were applied. Sections were embedded in aqueous mounting media without prior counterstaining (Aquatex, Sigma).
Results
Surface and cytoplasmic characterization of spleen DC subsets
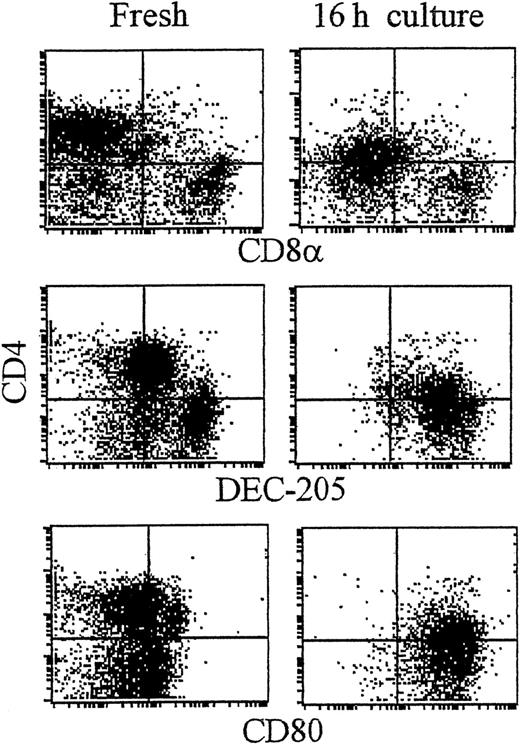
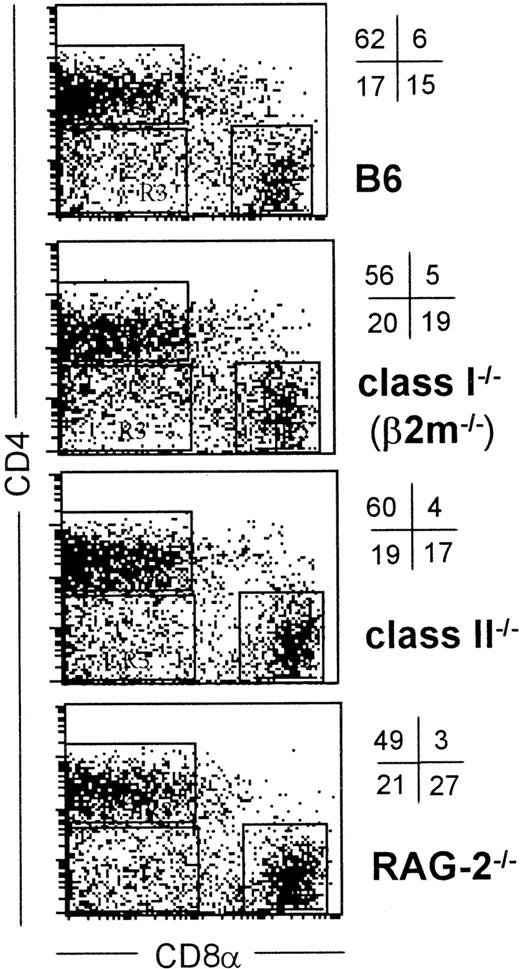
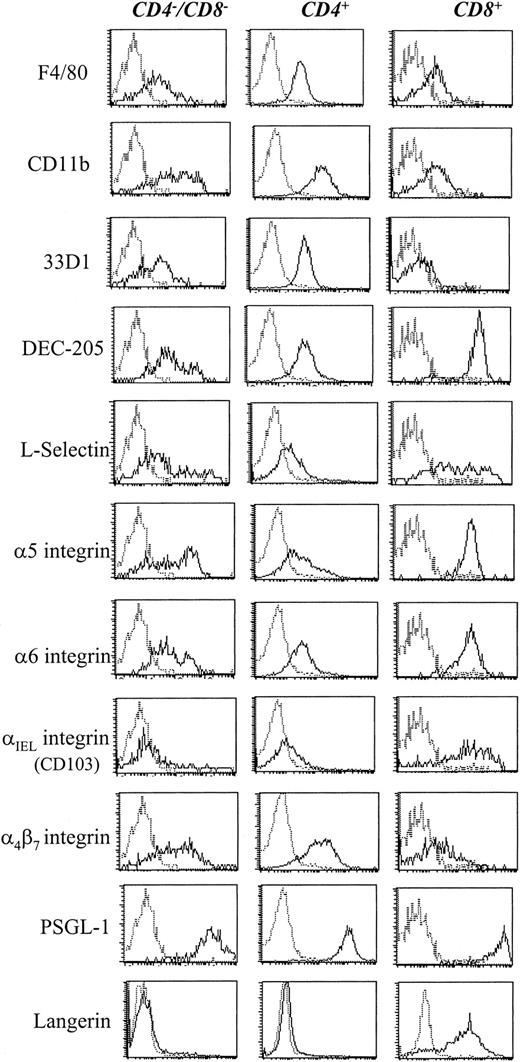
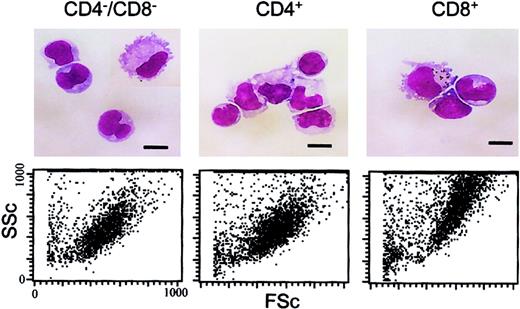
As shown recently by us and others,18,19 spleen DCs can be divided into 3 subsets, CD11c+/CD4−/CD8− (∼20%), CD11c+/CD4+/CD8− (∼60%), and CD11c+/CD4−/CD8+ (∼20%) (Figure1). Although distinct subsets of DCs expressed the CD4 and CD8 T-cell markers, neither CD3 nor Thy 1.2 was expressed (Figure 1 and Table 1). Overnight culture led to a series of changes in the phenotype of the various subsets, namely down-regulation of CD4 expression and up-regulation of costimulator molecules and DEC-205. Analysis of class I (β2m−/−) or class II–deficient mice (which lack almost all CD8+ or CD4+ T cells, respectively, due to defective thymic positive selection) or RAG−/− mice (which lack all T and B cells) showed that the expression of CD4 or CD8α on DCs was normal in these mutant mice and thus was not due to antigen pickup from T cells (Figure 2). All subsets expressed the DEC-205 antigen, but DEC-205 staining was highest on the CD8α+ population. Nevertheless, DEC-205 levels were also strongly increased on the CD8α− subsets following overnight culture (Figure 1 and Table 1). All subsets lacked the macrophage markers MOMA-1, MOMA-2, and ERTR9. In contrast, intracellular expression of FA-11, MIDC8, and 2A1 was noted on all subsets. As shown in Table 1 and Figure3, CD8α+ DCs specifically expressed the CD103 (the mouse homologue of the rat DC marker OX62) and showed the highest levels of α5 and α6integrins, CD24, CD44H molecules, sca-1, CD162 (PSGL-1), and CD62L. Interestingly, expression of the Birbeck granule–associated Langerin molecule36 was also confined to the CD8α+subset (Table 1). CD4+ DCs expressed the highest levels of CD11b and LPAM-1 (α4β7 integrin). F4/80 expression was detectable only on the CD8α− subsets and was highest on the CD4+ subset. The density of CD43 was highest on the CD4−/CD8α− DC subset. No differences in class I, class II, invariant chain, costimulator molecule, heat shock protein expression, or in their culture-induced up-regulation, was noted among the 3 subsets. To obtain information about the morphology of the DC subsets, CD11c+ spleen cells were sorted by FACS according to CD4 and CD8 expression as shown in Figure 4. Most cells in each of the 3 subsets showed similar nondendritic round morphology and high nuclear-to-cytoplasm volume ratio. The range of these features varied similarly within each of the subsets (Figure 4). Occasional dendritic morphology, consistent with the appearance of activated or mature DCs, was noted with a small number of DCs in all 3 subsets. However, as shown in Figure 4, CD8+ DCs showed higher side scatter compared to the smaller sized CD4−/CD8− and CD4+/CD8− subsets, suggesting a complex cell surface, or more granular cytoplasmic content.
CD4+ and CD8α+ DC present in fresh spleen suspensions.
Low-density spleen DCs were gradient-enriched by Nycodenz gradient centrifugation from spleen. At this stage DCs were not further purified by immunodepletion, but immediately labeled in 3 colors for CD11c (plus FITC-antihamster Ig; FL-1; not shown), the indicated monoclonal antibodies (mAb; plus PE-antirat Ig; FL-2) followed by blocking in 10% rat serum and addition of Cy5-PE–conjugated CD4 (FL-3). Plots show the expression of antigens on fresh DCs (A) or the effect of culture on the indicated antigens (B). Dot plots show DCs gated for CD11c positivity and by size and forward scatter to exclude dead cells and debris (see McLellan and Kampgen19).
Normal expression of CD4 and CD8 on DCs isolated from T cell–deficient mice.
Low-density spleen cells from the indicated strains of mice were labeled for CD11c, CD4, and CD8α as in Figure 1 and the percent and positions of the 3 DC major subsets defined by CD4 and CD8α are indicated by quadrants. Only CD11c+ events, also gated by forward/side scatter are shown.
Expression of surface antigens on DC subsets.
CD11c+ MACS-purified DCs were labeled for the indicated antigen detected with antirat-PE. The 3 DC subsets were resolved by additional labeling for CD4-Cy5-PE and CD8-FITC and electronic gating for the expression of CD4 and CD8, as indicated.
Expression of surface antigens on DC subsets.
CD11c+ MACS-purified DCs were labeled for the indicated antigen detected with antirat-PE. The 3 DC subsets were resolved by additional labeling for CD4-Cy5-PE and CD8-FITC and electronic gating for the expression of CD4 and CD8, as indicated.
Morphology of the DC subsets.
The upper panels show freshly isolated, low-density DCs that were FACS sorted into the 3 indicated DC populations, pelleted onto glass slides, air dried, and stained with May-Grünwald-Giemsa. Cells were photographed under oil immersion using a × 100 objective. Scale bars represent 10 μm. For the lower panels, the forward scatter (FSc) and side scatter (SSc) characteristics of the FACS-sorted DC subsets is shown.
Anatomic localization of the CD4+ and CD8+DC subsets
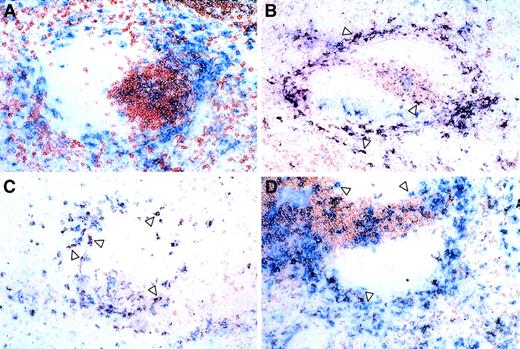
Double-labeling analysis was performed using CD11c in conjunction with CD4 and CD8 to determine the location of the various DC subsets (Figure 5). A large number of CD11c+/CD4+ DCs were identified mainly in the marginal zone and T-cell areas, with a few examples in the red pulp (Figure 5B). The bright expression of CD8α on spleen DCs allowed the detection of a clearly stained population that was more frequently present in the red pulp, marginal zone, although a minority was present in the T-cell areas (Figure 5C). CD4−/CD8α−DCs were noted in the marginal zones and red pulp, but also associated with or close to the T-cell areas (Figure 5D). No overlap of CD11c with other T-cell or macrophage antigens (such as Thy-1.2 or MOMA-1 and MOMA-2) was noted (Figure 5A and data not shown) demonstrating the specificity of the CD4 and CD8 double-labeling.
Anatomic distribution of DC subsets.
Frozen spleen sections were processed for double labeling as described in “Materials and methods.” Blue (Fast Blue) = CD11c, and the indicated markers are shown in red (AEC). Double-labeled cells are purple: (A) Thy 1.2, (B) CD4 (arrows indicate CD11c+/CD4+ cells), (C) CD8 (arrows indicate CD11c+/CD8+ cells), and (D) CD4 and CD8 combination (arrows indicate CD11c+/CD4−/CD8− cells). Asterisks indicate periarteriolar lymphoid sheath.
In vitro migratory capacity of DC subsets in collagen lattices
Two reports have demonstrated a reduced capacity of CD8α+ DCs to home to the lymph nodes following subcutaneous injection.22,27 One reason for this observed defect might be a reduced migratory capacity of the CD8α+DCs. We therefore performed migration assays to test the motility of the 3 DC subsets in 3-dimensional collagen lattices as described.37 The DC subsets were isolated by FACS, incubated in collagen lattices, and filmed, and their movement over a period of 6 to 12 hours was tracked. In 3 experiments all DC subsets showed comparable speeds (2-6 μm/min) of migration over the entire time analyzed (data not shown).
Presentation of alloantigens and nominal peptide to naı̈ve and cytotoxic T cells by DC subsets
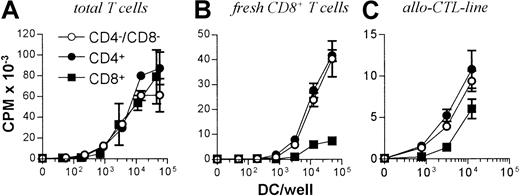
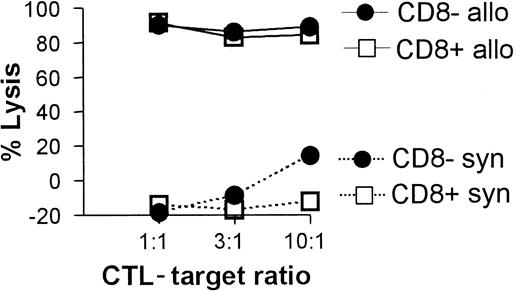
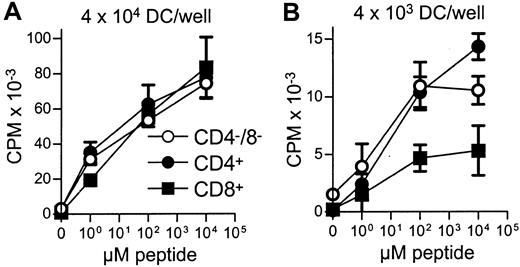
All 3 DC subsets demonstrated similar ability to stimulate unfractionated T cells in the 3-day mixed lymphocyte reaction (MLR) (Figure 6A). In contrast, CD8+ DCs were always very poor stimulators of resting or activated CD8+ T cells, even when the stimulator-to-responder ratio was increased up to 1:2 (Figure 6B,C). Interestingly, CD8α− or CD8α+ DCs appeared to be similar in their ability to present alloantigens, because they were both lysed with the same efficiency by allogeneic CTLs (Figure7). Neither lipopolysaccharide nor CD40 treatment of CD8α+ DCs overcame their inability to effectively stimulate allogeneic CD8+ T-cell responses (data not shown). Neither did the poor alloantigen presentation by CD8α+ DC appear to be due to the induction of anergy or apoptosis in responding T cells, because mixing of FACS-purified CD8α+ DCs with the other CD8α− DC subsets did not result in reduced CD8+ T-cell proliferation. In fact, addition of CD8α+ DCs to either of the other CD8α− DC subsets led to a moderate increase in CD8+ T-cell proliferation (data not shown). However, we cannot rule out that signals from the CD8α− subsets may have enhanced the allostimulatory capacity of the CD8α+DCs. We next checked if the inability of the CD8α+ DC subset to stimulate CD8+ T cells was true for the presentation of antigens other than alloantigens. For this purpose we used transgenic F5 CD8+ T cells, which recognize the influenza NP68 peptide in context of H-2Db. Surprisingly, in several experiments CD8α+ DCs were good stimulators of resting CD8+ F5 T cells, especially at higher NP68 peptide concentrations (Figure 8A). However, in experiments where the DC/T-cell ratio was low, a result more similar to the allogeneic system was observed, with only low levels of T-cell proliferation induced by the CD8α+ DCs (Figure 8B). Thus, only under certain optimal stimulation conditions do CD8α+ DCs appear capable of stimulating effective in vitro CD8+ T-cell responses.
T-cell stimulatory capacity of DC subsets.
(A) 105 Nylon wool purified, total T cells or (B) CD8+ or (C) 5d allo-CTL blasts were stimulated with the indicated numbers of FACS-sorted DCs from each subset and the levels of T-cell proliferation determined at day 3 by pulsing with3H-thymidine for 16 hours before scintillation counting. Error bars show means of triplicates ± SD.
CTL-mediated killing of DC subsets.
Fresh C57BL/6 spleen DCs (2 × 10⁵) were cultured with 5-day syngeneic (C57BL/6 CTL primed by irradiated Balb/c spleen cells) or allogeneic (Balb/c CTL primed by irradiated C57BL/6 spleen cells) CTL blasts at the indicated ratios. DC viability was determined 4 hours later for each of the CD8α− or CD8α+subsets as described in “Materials and methods” and is shown as a percent lysis of DCs cultured in the absence of CTLs.
Stimulation of peptide-specific T cells by DC subsets.
Equal numbers of FACS-sorted DCs from each of the subsets were aliquoted and pulsed with different concentrations of NP68 peptide. DCs were then used as stimulators for F5 T-cell (5 × 10⁴/well) proliferation at 4 × 10⁴(A) or 4 × 10³ (B) DCs/well. Error bars show means of triplicates ± SD. The indicated DC numbers represent only a guide because they are the input cell number, rather than those DCs present following DC loss by adherence to the tube and loss following the washing steps. Due to the low DC numbers present for each peptide concentration, recounting was not feasible.
Turnover of class I–peptide complexes on CD8α+DCs
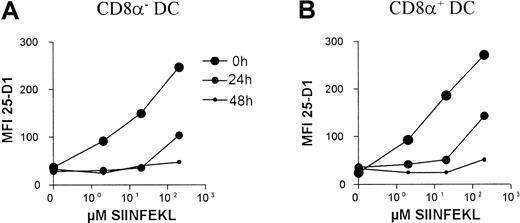
Because the CD8α+ DC subset was poor at stimulating class I–restricted T cells and this could not be explained by lack of class I or costimulator molecule expression, we reasoned this differences might be due to a differential turnover of class I–peptide complexes between the DC subsets. This might result in a faster loss of antigenic-peptide from the class I molecules on the CD8α+DC subset. To answer this question, we used the 25-D1.16 mAb, which recognizes SIINFEKL peptide in the context of H-2Kb.35 DCs were purified using CD11c-coated MACS beads and incubated with varying concentrations of SIINFEKL for 4 hours and then thoroughly washed free of uncomplexed peptide. The DCs were then chased by culture in the absence of SIINFEKL and the relative amount of class I–bound SIINFEKL determined by 25-D1.16 staining after 0, 24, and 48 hours. Such an analysis reflects the amount of peptide lost from class I complexes through class I–peptide complex shedding or endocytosis, as well as peptide loss from the class I at the cell surface. As shown in Figure 9, no major differences between the class I–peptide stability was observed between the CD8α+ and the CD8α− DC subsets. In fact in all 3 experiments, the stability of class I–peptide complexes on the surface of the CD8α+ DC subset was slightly higher compared to CD8α− DCs.
Retention of class I/SIINFEKL complexes by DC subsets.
MACS-purified CD11c+ DCs were pulsed with SIINFEKL peptide at the indicated concentrations, thrice washed, then chased for the indicated periods of time in absence of peptide. The levels of retained SIINFEKL-class I–peptide complexes on the DC subsets were determined using the 25-D1.16 mAb with antimouse-PE and by double labeling with CD8α-FITC. The mean fluorescent intensities of 25-D1.16 staining of the indicated DC subsets are plotted. The background staining of 25-D1.16 on unpulsed DCs was similar to that of an irrelevant mouse IgG1 isotype control (not shown).
In vivo priming of cytotoxic responses by the DC subsets
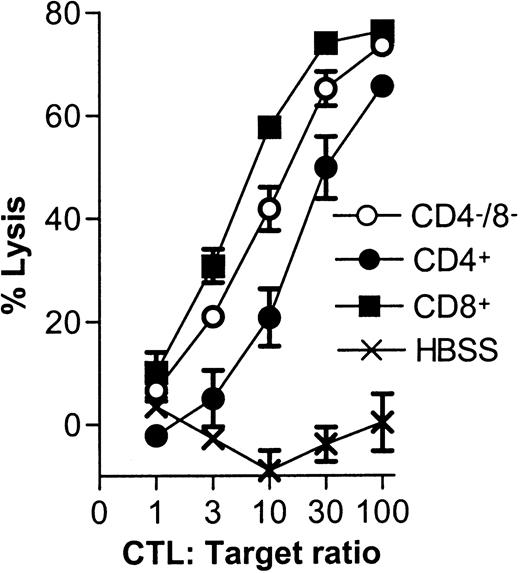
We next wished to test the ability of the various DC subsets for in vivo CTL priming. Because peptide-pulsing protocols lead to DCs that express extremely high levels of class I–peptide complexes, we reasoned this might lead to inadvertent loading of endogenous antigen-presenting cells (APCs) after injection of pulsed DCs, as has been suggested to occur in certain systems.27Instead we chose a weakly expressed antigen expression system that might reflect physiologic levels of cytoplasmic antigen expression and that would therefore be unlikely to transfer significant quantities of class I–associated peptide to endogenous host APCs. The H-Y antigens are encoded by the Y chromosome and are ubiquitously expressed by all cell types studied so far, including DCs and as few as 10 copies of the several H-Y peptides may be expressed per cell.38 For our purposes, female C57BL/6 mice were immunized intravenously with 1 to 5 × 10⁵ FACS-sorted syngeneic male DCs of the 3 DC subtypes. As shown in Figure 10, both CD8α+ DCs and CD4−/CD8− DCs were consistently able to induce potent anti–H-Y cytotoxic responses in female mice. Interestingly, CD4+ DCs were always several-fold weaker at priming CTL responses as compared to the other CD4− DC subsets and CD4+ DCs failed to prime detectable H-Y CTLs in 1 of 3 experiments. In vitro experiments confirmed that splenocytes of mice primed by all 3 DC subsets (but not from HBSS-primed mice) contained similar levels of H-Y–specific CD4+ and CD8+ T cells that had expanded on contact with male splenocytes. Thus, a lower level of H-Y presentation is unlikely to be the reason for the weaker CTL expansion by the CD4+ DC subset (data not shown).
In vivo priming of male antigen (H-Y) cytotoxicity.
Female mice were primed intravenously with 1.5 × 10⁵male DCs from each subset and 20 days later splenocytes were restimulated in vitro. After 5 days the indirect measure of DNA fragmentation was used to assess CTL-mediated apoptosis in male B6 Con A blast targets using the JAM assay.33 Immunizing populations were as follows: open circles, CD4−/CD8− DCs; closed circles, CD4+ DC; squares, CD8α+ DC; and crosses, HBSS-injected controls. Similar levels of lysis of female targets required 10- to 100-fold higher doses of CTLs induced by each subset (not shown). Error bars show means of triplicates ± SD.
Discussion
Initial work on the function of the CD8α+ DCs in mouse spleen suggested that this subset might play a role in T-cell tolerance. Our in vitro data are in agreement with these previous studies showing that the CD8α DCs lack significant CD8α+ T-cell priming ability.20,21 However, the lack of an inhibitory effect of CD8α+ DCs on the T-cell proliferation induced by the other DC subsets (data not shown) and the normal levels of CD8+ T-cell proliferation induced by CD8α+ DCs under optimal conditions in a peptide-specific transgenic T-cell system, suggest that CD8α+ DCs are not suppressive for T-cell activation. Our data also show that the experimental system is important in determining the efficiency by which DC subsets stimulate CD8+ T-cell responses. For example, in all experiments performed, CD8α+ DCs were always significantly weaker than the other 2 DC subsets in stimulating allogeneic CD8+ T-cell proliferation in vitro. However, in a peptide-specific transgenic T-cell system,31 CD8α+ DCs were relatively efficient in stimulating T-cell proliferation, though this was only observed at higher DC/T-cell ratios and at higher peptide concentrations. Our data rule out deficiencies in class I–peptide presentation and stability as a reason for this in vitro deficiency, because CD8α+ displayed similar ability to retain class I–peptide complexes on culture and allogeneic CTLs lysed CD8α− and CD8α+ DCs with similar efficiency.
Given the weak stimulation of CD8+ T cells in vitro by CD8α+ DCs (Figure 6), we were surprised to find that both CD8α+ and CD4−/CD8− DCs, but not CD4+ DCs, were consistently potent stimulators of cytotoxic responses following intravenous immunization (Figure 10). Similar to the in vivo data presented here, other studies have shown that CD8α+ DCs are capable of inducing efficient CD8+ T-cell responses23,24; however, in an experimental viral infection system, the response was several magnitudes lower than that induced by the CD8α−DCs.22 Thus the inability of CD8α+ DCs to stimulate significant CD8+ T-cell proliferation in vitro remains puzzling and may relate to undefined signals received in vivo that contribute to the high CTL-priming capacity of the CD8α+ subset. These findings may be explained in the light of recent work suggesting that the DC subsets possess a differential ability for IFN and IL-12 release. Comparable to human plasmacytoid DCs, the CD8α+ DCs were reported to release the highest levels of IFN-α/β,30 and CD8α+ DCs secrete the highest levels of IL-12, although, under certain pathogenic interactions, CD8α− may also secrete IL-12.39 Which DC group secretes IFN-γ is still controversial since Ohteki et al showed that IFN-γ was released only from the CD8α+ DC subset,40 whereas Hochrein et al have recently published that the only DC subset capable of IFN-γ secretion is the CD4−/CD8α−subset.30 Our data support the concept thatboth CD4−/CS8− DCs and CD8α+ DCs are capable of INF-γ release. Possibly the excellent ability of the CD8α+ DC subset to prime cytotoxic responses relates to the ability of this subset to release IFN-α, INF-γ, and IL-12. Interestingly, CD4+DCs lack IFN-γ expression on in vitro stimulation30 (and A.D.M., E.K, unpublished data, August 2001), which may account for their consistently weaker CTL-inducing capacity observed in our experiments.
Recent work demonstrates the heterogeneity of mouse DCs. From our analysis of the expression of surface and cytoplasmic molecules, we further emphasize the complexity of these DC subsets with the identification of several hitherto unidentified differences between the DC subsets, as well as the confirmation of other described differences. As determined here and in other laboratories (K. Inaba, C. Reis e Sousa, personal communication), CD8α+ DC alone expressed the Langerin molecule (Figure 3 and Table 1). CD8α+ DC also expressed much higher levels of many adhesion molecules (eg, the α5 integrin, α6 integrin, αIEL integrin, CD103, L-selectin, CD24, CD44H; Table 1and Figure 3) than the other subsets. In fact, the reason CD8α+ DCs may require EDTA for their efficient removal from spleen and lymph node stroma and T-cell clusters3 may reflect the functional expression of this array of adhesion molecules. Of importance, the CD103 molecule was expressed in high density on CD8α+ DCs, but was absent from the other DC subsets (Figure 3 and Table 1). Mouse CD103 is a homologue of the rat DC marker OX62, which is expressed by nearly all rat DCs and also by a subset of rat γδ T cells.41 In mice, although CD103 is expressed on intestinal CD8+ T cells and γδ T cells, only a small percent of blood or spleen T cells express CD10340 (and A.D.M., M.K., A.E., et al, unpublished data). Thus CD103 represents a new marker for CD8α+ DCs and, in fact, shows a greater specificity for this DC subset than DEC-205, which is also expressed at moderate levels and is further induced by culture on the other CD8α− DC subsets (Figure 1, Vremec et al3). Given the low level of CD103 expression on either CD4 or CD8 splenic T cells, CD103 has also a higher specificity for DCs than CD8 mAb (A.D.M., M.K., A.E., et al, unpublished data). Although CD103 expression on CD8α+ DCs is slightly more diffuse than the CD8α marker (Figure 3), this new marker should prove useful as an additional research tool, especially as a DC isolation marker to test the function of DC-expressed CD8α. Interestingly, CD103 is capable of binding E-cadherin and another unidentified epithelial cell–expressed ligand.41 Indeed, rat DCs have been shown to transport intestinal cells to draining lymph nodes showing that they possess the capability to bind and ingest epithelial cells,42 perhaps via adhesion molecule interactions such as CD103/E-cadherin. Possibly these CD8+/CD103+ DCs may be in transit from the spleen and to other sites populated by E-cadherin–expressing epithelial cells. However, we were unable to detect a CD11c+/CD8α+/CD103+ DC population in mouse blood (data not shown).
To date, the function of the high-level expression of CD8α by this DC subtype is still unknown and there exists no human CD8-expressing DC counterpart. Using DEC-205 as a surrogate marker for the isolation of this DC subset from CD8α−/− mice, Shortman and coworkers were unable to reveal any function for DC-expressed CD8α in DC/T cell interactions.43 Given that CD8α+DCs specifically express high levels of several adhesion molecules, it is possible that CD8α may also play a role in cell adhesion. Although CD8α is expressed on these DCs in absence of the CD8β chain, CD8α is in fact responsible for most of the class I binding function of the CD8αβ molecule, and homodimeric CD8α binds well to class I.44 The potent cross-priming ability of the CD8α+ DCs, especially for apoptotic cells,23 24 suggests that this subset may have a specialized role in cellular phagocytosis that is mediated by the high expression of a range of adhesion molecules peculiar to this DC subset. It is possible that a class I binding function of CD8α+DCs might allow a close binding and sampling of other cell types for DC immune functions, such as phagocytosis.
Through use of a sensitive double-labeling technique we have provided the first description of the anatomic distribution of the 3 CD11c+ DC subsets in normal spleen (Figure 5). Interestingly, although CD8α+ DCs are often referred to as T-cell area–associated DCs, our data are more similar to those from Reis and Sousa et al25,45 in which CD8α+ DCs are more frequently found in the marginal zones or red pulp rather than the T-cell areas of spleen of normal mice. Inflammatory signals do stimulate the migration of marginal zone DCs into the T-cell areas; however, this infiltrate includes both CD8α+ and CD8α− DCs.25,45 All subsets showed some degree of T-cell area–association, but our finding of normal CD4 or CD8 expression on spleen DCs in either class II−/−, class I−/−, or RAG−/− mice, together with the adoptive transfer and gene expression experiments of Shortman and coworkers18 point to a bona fide expression of CD4 or CD8 by the DCs themselves.
From population turnover studies of Shortman et al,29 the 3 DC subsets incorporated bromodeoxyuridine (BrdU) label at similar rates and thus do not appear to derive from one another. This study leaves open the question of whether these precursors are very early hematopoietic progenitors, or alternatively, a late DC precursor with a high turnover rate that seeds the spleen. For the latter model, the subsequent DC phenotype (eg, CD4 or CD8 expression) might be determined in a stochastic manner by environmental signals. The fast BrdU incorporation into DCs suggests that the precursors are rapidly dividing, although under the correct signals resident spleen DCs may also be capable of cell division.46,47 Earlier adoptive transfer experiments suggested the existence of a very early, common precursor cell for T cells and CD8α+ DCs.48 However, using common γ-chain−/− and RAG2−/− mice, Brocker and colleagues have demonstrated an independence of the CD8α+DCs from T-cell precursor development, at least at the early stage of RAG and γ-chain dependence.49 Yet other work has shown that reconstitution of irradiated mice with early myeloid or lymphoid precursors led to the development of both CD8α− and CD8α+ DC.50-52 Migration of FITC-treated skin-derived DCs may52-54 or may not7 (and A.D.M., M.K., A.E., et al, unpublished data) induce the expression of CD8α on DCs. Therefore, the developmental interrelationships of these DC subsets are still very controversial.
This study adds weight to the thesis that DCs are present as specialized subsets with distinct surface phenotype and different abilities to induce T-cell proliferation and T cell–mediated cytotoxicity. In particular, CD8α+ DCs are specialized APCs for the uptake of both soluble and cell-bound antigens for class I loading.23 24 We now show that they also possess a potent ability to stimulate in vivo cytotoxic responses to cytoplasmically expressed antigens, such as minor histocompatibility antigens.
The authors would like to thank Sonja Rotzoll for excellent technical assistance with cell sorting; Drs Sem Saeland, Ron Germain, Patrizia Stoitzner, Bjørn Henriksen, Susan Schellworth-Sherz, Thomas Hunig, Wolfgang Fischer, Manfred Lutz, Polly Matzinger, Ashraf Ab delhafez, Peter Friedl, Cathy Toben, Georg Kraal, and Ralph Steinman for assistance with antibodies, peptides, cell lines, and advice with the cytotoxicity assays. We gratefully acknowledge the reviewers' suggestions and contribution to the manuscript. The continuing support of Prof J Dietl and Dr J. C. Becker is gratefully acknowledged.
Supported by grants from the German Ministry for Education and Research (BMBF01KX9820/L, IZKF-01KS9603, and SFB 465).
The publication costs of this article were defrayed in part by page charge payment. Therefore, and solely to indicate this fact, this article is hereby marked “advertisement” in accordance with 18 U.S.C. section 1734.
References
Author notes
Alexander D. McLellan, Department of Dermatology, University of Würzburg, Joseph-Schneider Str 2, Würzburg 97080, Germany; e-mail: alex.mclellan@mail.uni-wuerzburg.de.

This feature is available to Subscribers Only
Sign In or Create an Account Close Modal