Although CD8+ T cells initially suppress human immunodeficiency virus (HIV) replication, cytotoxic T-cell precursor frequencies eventually decline and fail to prevent disease progression. In a longitudinal study including 16 individuals infected with HIV-1, we studied both the number and function of HIV-specific CD8+ T cells by comparing HLA-peptide tetramer staining and peptide-induced interferon-γ (IFN-γ) production. Numbers of IFN-γ–producing T cells declined during progression to acquired immunodeficiency syndrome (AIDS), whereas the number of tetramer+ T cells in many individuals persisted at high frequencies. Loss of IFN-γ–producing T cells correlated with declining CD4+ T-cell counts, consistent with the need of CD4+ T-cell help in maintaining adequate CD8+T-cell function. These data indicate that the loss of HIV-specific CD8+ T-cell activity is not due to physical depletion, but is mainly due to progressively impaired function of HIV-specific CD8+ T cells.
Introduction
CD8+ cytotoxic T lymphocytes (CTLs) are critical to the elimination or control of viral infections.1,2 In individuals infected with human immunodeficiency virus 1 (HIV-1), HIV-specific CD8+ T cells are frequently reported to suppress viral replication and to delay disease progression,3-8 but eventually CTL precursor frequencies decline and fail to protect the infected individuals against progression to acquired immunodeficiency syndrome (AIDS).9 10 This CTL decline may be due to physical depletion of HIV-specific CD8+ T cells or due to T-cell dysfunction.
To distinguish between these 2 mechanisms, 2 different techniques are available. Tetrameric HLA-peptide complexes allow for the detection of CD8+ T cells that express a T-cell receptor (TCR) specific for a given peptide presented by a given HLA molecule.11In addition, peptide-specific T cells can be detected by intracellular cytokine staining, where antigen-responsive T cells are detected by virtue of their cytokine production on stimulation with the peptide of interest.12 Studies using tetrameric peptide-HLA complexes have shown high frequencies of HIV-specific T cells at various stages of the natural course of infection.7,13,14 This would argue against HIV-specific CD8+ T cells being depleted. Alternatively, an increasing number of studies have reported a dissociation between numbers of hepatitis C virus (HCV)–, Epstein-Barr virus (EBV)–, HIV–, or simian immunodeficiency virus (SIV)–specific CD8+tetramer+ T cells and number of T cells that responded to functional assays with antigen-specific interferon-γ (IFN-γ) production.13-22 In other studies, including many long-term asymptomatic HIV carriers (LTA) or treated individuals, cytokine production by a relatively high percentage of HIV-specific T cells was observed.23,.24These data possibly point to clinical conditions where virus-specific CTLs may be relatively nonfunctional.
In these studies no universal stimulation protocol was used. Some studies used extensive costimulation to induce cytokine production. Although costimulation may be relevant for CD4+ T cells to show antigen induced IFN-γ production in vitro, we chose to limit the CD8+ T-cell stimulation protocol to presentation of peptide-antigen without costimulation. First, whereas costimulation is provided to CD4+ T cells by their natural antigen-presenting cells, effector CD8+ T cells should be able to respond to an infected target cell that does not provide costimulatory signals. Second, in HIV infection, most CD8+T cells lack CD28. Therefore, the effect of the CD28 monoclonal antibody is likely to be indirect. Third, subtle defects in antigen responsiveness may be masked when stimuli are too strong.
Here we studied in detail the dynamics of HIV-specific CD8+ T cells in 5 HIV-infected LTA individuals and 11 individuals progressing to AIDS. Presence and function of HIV-specific T cells was measured by simultaneous tetramer staining and peptide-induced IFN-γ production, using several well characterized HLA-A2– or HLA-B8–restricted HIV peptides. The kinetics of antigen-specific and antigen-responsive CD8+ T cells were analyzed in relation to disease progression and CD4+ T-cell numbers to elucidate the mechanism of the CTL dysfunction in HIV infection.
Patients, materials, and methods
Subjects and samples
Sixteen HIV-1 infected participants of the Amsterdam Cohort Studies were selected for HLA types corresponding to available major histocompatibility complex (MHC)–peptide tetramers (A2, B8, or B57). Furthermore, the subjects were selected on the basis of recorded21 strong responses to one or more of the tested epitopes (see below), and to include a wide range of disease progression rates. During the follow-up, 11 of the 16 subjects developed AIDS (Table 1); these are referred to as progressors. The 5 subjects who remained asymptomatic during the follow-up are referred to as asymptomatics. Peripheral blood mononuclear cells (PBMCs), cryopreserved according to a standard computerized freezing protocol, were selected to establish a longitudinal range from seroconversion to the latest sample available or to AIDS diagnosis. PBMCs from HIV−, or HLA-mismatched donors served as controls for specificity of tetramers and peptide-specific stimulation.
Clinical data of the individuals investigated
| Subject . | HLA . | Start of therapy . | Time to AIDS . | AIDS diagnosis . | Dominant response* . |
|---|---|---|---|---|---|
| 1081 | A2,3; B37,62; CW3,6 | — | 101 | Wasting syndrome | SLY |
| 57 | A2,19; B27,40; CW2 | — | — | — | SLY |
| 16 | A2,29; B44,51; CW2,5 | — | 131 | Kaposi sarcoma | SLY + ILK |
| 490 | A2,23; B44,51; CW2,4 | 120† | 128 | Cryptococcus | SLY |
| 1211 | A2,29; B44; CW4 | — | 68 | Crypt meningitis | SLY |
| 1140 | A2,11; B40,52; CW3 | 119‡ | —1-153 | — | SLY |
| 434 | A2,28; B7,27; CW2 | 134‡ | —1-153 | — | SLY |
| 433 | A2,3; B7,57; CW6,7 | — | 84 | CMV | KAF |
| 658 | A1,2; B8,61; CW2,7 | — | — | — | EIY + FLK |
| 1160 | A2; B8,27; CW1 | — | — | — | EIY + FLK |
| 341 | A24,28; B8,13, CW6,7 | 901-155 | 115 | CD4 < 200 | FLK |
| 232 | A1,3; B7,8; CW7 | 82,1-155123‡ | 127 | Tuberculosis | EIY + FLK |
| 656 | A1,11; B8,56; CW1 | 49† | 78 | Cryptosporidiasis | FLK |
| 748 | A1; B8; CW7 | 33† | 47 | CD4 < 200 | EIY + FLK |
| 424 | A1,2; B8,61; CW2,7 | — | 41 | Candidiasis | FLK |
| 159 | A1; B8; CW7 | 33† | 33 | Pneumocystis carinii | EIY |
Crypt indicates cryptococcus; CMV, cytomegalovirus.
Peptides listed in materials section are indicated with the first 3 amino acids.
Months after seroconversion at which zidovudine (AZT) treatment is initiated.
Months after seroconversion at which HAART is initiated.
Subjects 1140 and 434 did not develop AIDS but started HAART because of high viral load and decreasing CD4 T cell numbers.
Months after seroconversion at which AZT plus dideoxyinosine (DDI) treatment is initiated.
Tetrameric HLA-peptide complexes
Refolding of HLA heavy chains and tetramer formation was performed as described previously.11 HLA heavy chains and β2-microglobulin genes were constructed in pET plasmids and expressed in BL21 Escherichia coli strains. Heavy chain, β2-microglobulin, and peptides were refolded by dilution.25 Peptides derived from p17 Gag and Pol (SLYNTVATL, ILKEPVHGV, respectively; single-letter amino acid codes) were complexed with HLA-A2; p24Gag and Nef peptides (EIYKRWII, FLKEKGGL) were combined with HLA B8 proteins; the peptide KAFSPEVIPMF(p24 Gag) was combined with HLA-B57. Monomeric complexes were concentrated, biotinylated, purified by fast protein liquid chromatography (FPLC) on a Superdex 200 HR16/60 column (Amersham Pharmacia, Little Chalfont, United Kingdom), and bound to streptavidin-phycoerythrin (PE) or streptavidin-allophycocyanin (APC; Sigma, St Louis, MO). Tetrameric product was FPLC purified.
Antigen-specific stimulation
Two million PBMCs per milliliter were stimulated with the peptide used in the corresponding tetramer complexes at 37°C for 4 hours in the presence of 3 μM monensin. Stimulation protocols were tested for peptide concentrations varying from 0.1 to 10 μg peptide/mL, for 4 or 6 hours' incubation (for some experiments in the presence of CD28 and CD49d antibodies). HLA-mismatched peptide, matched irrelevant peptide, or medium alone was used as negative control, and stimulation with phorbol myristate acetate (PMA)/ionomycin was used as a positive control. After incubation, cells were washed and stained with tetramers (PE or APC) and anti-CD8 (peridinin chlorophyll protein [PerCP]; Becton Dickinson, San Jose, CA). Additional phenotyping of tetramer+ cells was performed by costaining for Ki67 fluorescein isothiocyanate (FITC; Immunotech, Marseille, France), or CD69 APC (Becton Dickinson). Cells were fixed with 4% paraformaldehyde, permeabilized (Permeabilization kit, Becton Dickinson) and stained intracellularly with IFN-γ FITC or PE (Diaclone, Amsterdam, The Netherlands, or Becton Dickinson) and tumor necrosis factor-α (TNF-α; FITC, Becton Dickinson). Cells were analyzed using Cellquest software (Becton Dickinson) and gated on live lymphocytes. The IFN-γ gate was determined by the negative and positive controls of each individual's CD8+ T cells. The percentages of tetramer+ CD8+ T cells and IFN-γ+ CD8+ T cells were back calculated to absolute numbers per volume blood by multiplication with absolute CD8+ T-cell counts/microliter blood. IFN-γ+fractions were calculated by taking the sum of IFN-γ+ T cells specific for all tested peptides divided by the sum of tetramer+ T cells for all peptides, as determined in the nonstimulated control sample.
Statistical analyses
Early and late time points were compared using Wilcoxon sign rank tests and correlations were analyzed using Spearman correlation tests.
Results
Validation of the stimulation protocol
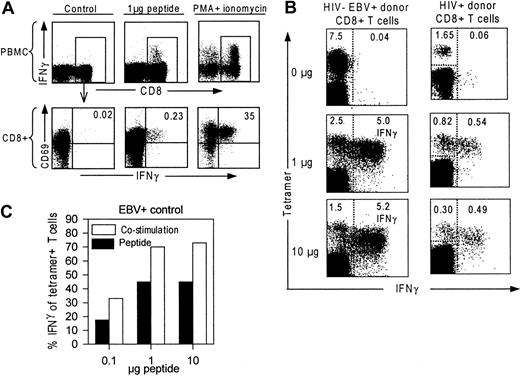
Incubation of PBMCs from an HIV+ donor with HIV-peptide or with PMA and ionomycin results in production of IFN-γ by CD8+ T cells as indicated in Figure1A.12 To establish the optimal stimulation protocol, we stimulated PBMCs from a healthy HIV− EBV+ donor and an HIV+ donor with the EBV peptide “RAKFKQLL ” or the HIV-Nef “FLKEKGGL” peptide, respectively, at varying concentrations and durations. To evaluate IFN-γ production of tetramer+ T cells, we combined intracellular IFN-γ detection and tetramer staining. In Figure 1B, tetramer binding cells and IFN-γ–producing cells are given as percentages of CD8+ T cells. Incubation with 1 μg and 10 μg peptide/mL is shown to induce equal amounts of IFN-γ+ T cells, but 10-μg peptide induced a loss of tetramer+ T cells compared to 1 μg peptide. Longer incubation periods (6, 24 hours, not shown) decreased the number of IFN-γ+ T cells.
Validation of the stimulation protocol.
(A) CD69 and IFN-γ expression of CD8+ T cells after incubation with 2 μL dimethylsulfoxide (DMSO), 1 μg HIV-peptide dissolved in 2 μL DMSO or PMA and ionomycin. Upper panels show total PBMCs stained for CD8 and IFN-γ; lower panels are gated on CD8+ T cells and show CD69 and IFN-γ expression of CD8+ T cells. (B) Response of EBV- and HIV-specific T cells to in vitro peptide stimulation. PBMCs were incubated with 0, 1, and 10 μg peptide/mL. FACS dot plots are gated on CD8+ T cells and demonstrate tetramer+ cells (y-axis), and IFN-γ production (x-axis). Percentages in the left upper corner indicate number of tetramer+ T cells of the CD8+ T-cell population. Percentages in the right upper corner indicate number of IFN-γ+ peptide-specific T cells (right from the dotted line) of the CD8+ T-cell population. (C) IFN-γ–producing antigen-specific T cells after incubation either with 1 μg peptide (“Peptide,” black bar) or with 10 μg peptide and antibodies against CD28 and CD49d (“Costimulation,” white bar). IFN-γ+ T cells are given as percentage relative to the total number of tetramer+ T cells in the nonstimulated sample.
In some studies antibodies against CD28 or CD49d were used to provide costimulation during peptide-specific stimulation assays.24,26 When costimulation was performed by adding CD28 and CD49d antibodies, the number of IFN-γ–producing T cells was further increased, but did not alter the peptide-dependent response kinetics (Figure 1C). The percentage of tetramer+ T cells producing IFN-γ reached 74% for EBV-specific T cells, which is in agreement with previous findings for virus-specific CD8+ T cells.23 24 Although costimulation may be relevant for CD4+ T cells to show antigen-induced IFN-γ production, we chose to limit the CD8+ T-cell stimulation protocol to presentation of 1 μg peptide-antigen/mL without costimulation.
HIV-specific T cells are not physically depleted during progression to AIDS
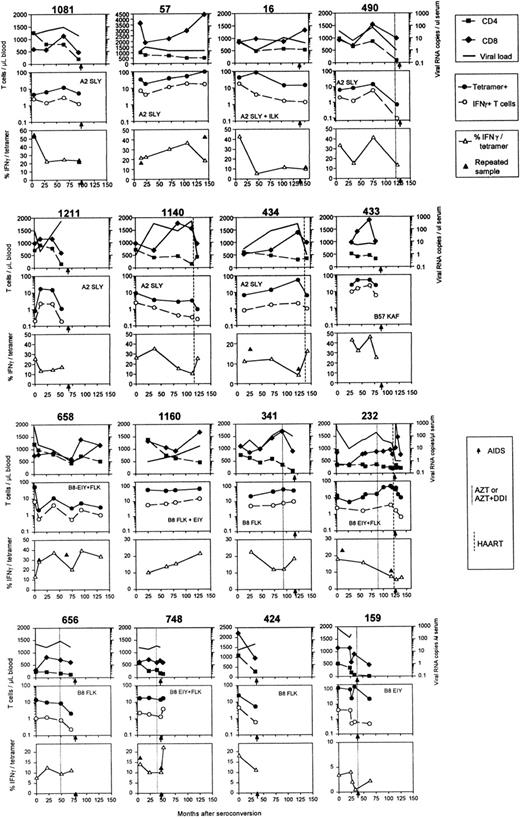
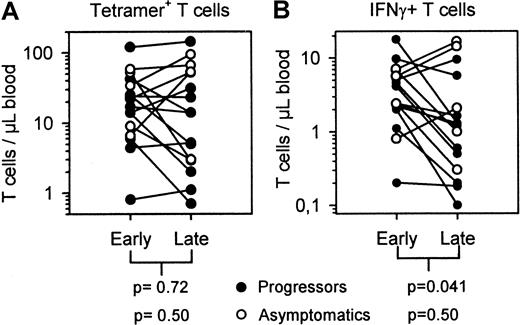
Frequencies of HIV-specific CTL precursors are reported to decline during the course of infection in most patients, which may result from physical deletion in HIV-specific T cells. By the use of HLA-peptide tetramers we investigated whether the decrease of HIV-specific T-cell numbers preceded progression to AIDS. In Figure2, data from all individuals analyzed are shown, including CD4+ and CD8+ T-cell counts and viral RNA load. Because an overall decrease in CD8+T-cell numbers could mask loss of HIV-specific T cells when these are expressed as percentages of CD8+ T cells, we evaluated absolute numbers of tetramer+ T cells per microliter blood. Subjects' PBMCs were stained with all described tetramers appropriate for individual HLA alleles. IFN-γ responses were tested for the same peptides as used in the tetramers. The middle panels in Figure 2 show the number of tetramer+ T cells in time; HLA restriction and dominant peptides recognized are indicated. Absolute numbers of HIV-specific tetramer+ T cells decreased (7 of 16 individuals) or increased (4 of 16) or remained stable (5 of 16) during the follow-up. In general, no significant decrease was observed (Figure3A). These data indicate that depletion is not the main cause for the loss of HIV-specific CTLs.
Longitudinal data of HIV-infected individuals during the course of infection.
Months are given from time of seroconversion, AIDS diagnosis is indicated with arrows on the x-axes, and HAART, dual therapy, or monotherapy is indicated with dotted lines and defined in Table 1. Upper panels show CD4+ (▪) and CD8+ (♦) T-cell numbers and viral RNA copies per milliliter serum (thick lines). Middle panels indicate absolute numbers of tetramer+ T cells (●) and IFN-γ–producing T cells (○). HLA restrictions and dominant peptide responses are indicated by the first 3 amino acids of the peptides described in “Patients, materials, and methods.” The IFN-γ+ fraction of tetramer+ T cells is plotted in the lower panels (▵). Results of replicate measurements are indicated in the lower panels (▴).
Absolute numbers of tetramer+ T cells and IFN-γ+ T cells early in infection compared to late in infection.
Numbers of HIV-specific tetramer+ T cells/μl blood (A) and numbers of antigen-specific IFN-γ–producing T cells (B) early after seroconversion compared to late in the asymptomatic state but before start of HAART (asymptomatics, open circles) or around AIDS diagnosis (filled circles).
Numbers of HIV-specific IFN-γ–producing CD8+T cells decrease during progression to AIDS
T cells were stimulated with the same peptide as complexed in the tetramers and peptide-induced IFN-γ production was evaluated in PBMC samples drawn during the follow-up period. The middle panels in Figure2 and Figure 3 show that, although numbers of tetramer+ T cells could rise or fall, the number of IFN-γ–producing T cells decreased in most individuals before AIDS diagnosis (10 of all 16 subjects, 9 of 11 progressors). We designated the data point closest to AIDS diagnosis or the last sample before start of highly active antiretroviral therapy (HAART) as clinical end point and compared this with the earliest sample tested. Figure 3B shows that IFN-γ+ T cell numbers in all 16 subjects decreased from early to late in infection (median from 3.24 to 1.07/μL blood) and this was mainly due to decreasing IFN-γ+ T-cell numbers of the 11 progressors (median from 2.42 to 0.66/μL blood). In the 5 subjects who remained asymptomatic, IFN-γ+ T cells remained stable or increased; one asymptomatic subject (1140) had severely decreased IFN-γ+ T cells, but therapy may have stopped disease progression.
Tetramer+ T cells not producing IFN-γ after peptide-specific stimulation may produce other cytokines or these cells may be in cell division. However, we and others observed that IFN-γ was the predominant cytokine produced (data not shown and Appay et al23), and TNF-α was mainly produced by T cells that also produced IFN-γ. Furthermore, the number of HIV-specific T cells in cell division was too low to explain the lack of IFN-γ production (mean 3.5% of tetramer+ T cells, n = 4) and no longitudinal correlation or complementation was observed for IFN-γ+ T cells and tetramer+ T cells expressing the cell division marker Ki67 (data not shown).
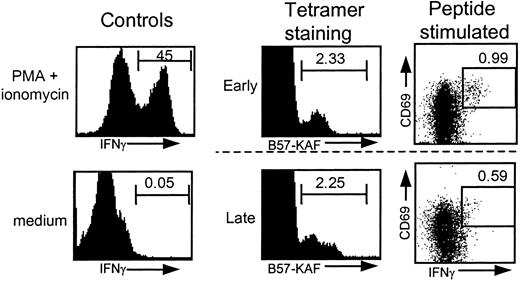
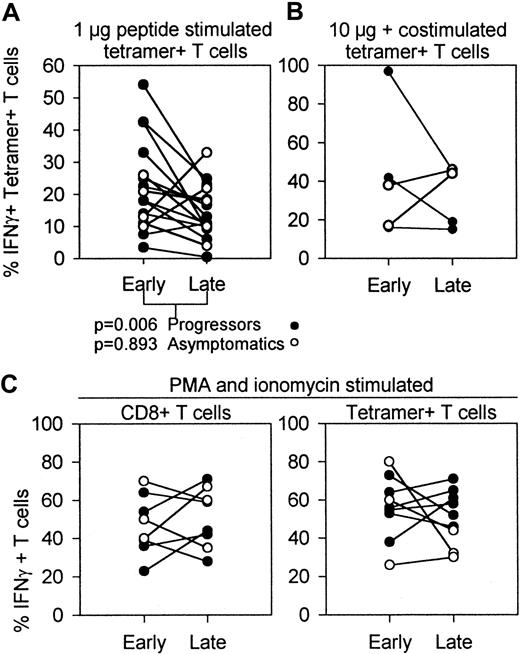
In most individuals progressing to AIDS, a relatively stable number of tetramer+ T cells was accompanied by an early or late loss of IFN-γ–producing T cells. A representative example is shown in Figure 4, in which one individual's tetramer+ T cells and IFN-γ+ T cells are shown for an early and a late time point. This discrepancy between tetramer staining and IFN-γ production increased with time. These different kinetics are illustrated by the fraction of IFN-γ+ T cells within the tetramer+ T cells (IFN-γ+/tetramer+ × 100%) in the lower panels of Figure 2. In 13 of 16 individuals a decrease of the percentage of IFN-γ+ T cells within tetramer+T cells was observed. When comparing the IFN-γ+ fraction early after seroconversion, with the IFN-γ+ fraction around AIDS diagnosis, start of HAART, or latest time point available in the asymptomatic phase, a significant decrease was observed (median from 19.3% to 12.0%, n = 16), and specifically the progressors showed a significant decrease (Figure5A). These percentages are in agreement with earlier findings in cross-sectional studies18 21 and with data obtained by combining Elispot assay and tetramer staining, which showed an average of 18% of tetramer+ T cells producing IFN-γ+ in 14 HIV-infected individuals.49 Interestingly, individuals who received HAART, but occasionally also dual therapy or monotherapy, generally showed an increase in the IFN-γ+ fraction after initiation of HAART (Figure 2, dotted vertical lines).
FACS analysis of HIV-specific tetramer+ and IFN-γ+ T cells.
FACS data from individual 433. Similar tetramer staining and differential IFN-γ production after stimulation with 1 μg peptide/mL for samples drawn early and late in HIV infection. Positive (PMA/ionomycin-stimulated T cells) and negative (no stimulus) controls for IFN-γ production are shown for one time point.
Percentages of IFN-γ–producing T cells early and late in HIV infection determined after in vitro stimulation with peptide, peptide and costimulation, or PMA and ionomycin.
Data from progressors (n = 11, (●) include early samples versus samples drawn during AIDS diagnosis. Data from asymptomatics (n = 5, ○) are early samples versus latest sample available before HAART. (A) IFN-γ+ fraction of tetramer+ HIV-specific T cells early versus late in infection, measured by stimulation of PBMCs with 1 μg peptide/mL. Thirteen of all 16 individuals showed a decrease in the fraction of antigen-induced IFN-γ production during disease progression (n = 16; P = .028, Wilcoxon). Progressors and asymptomatics had different dynamics of the IFN-γ+ fraction as shown by different Pvalues. (B) IFN-γ+ fraction of tetramer+HIV-specific T cells after stimulation with 10 μg peptide in the presence of CD28 and CD49d costimulation. (C) PBMCs of HIV-infected individuals were incubated with PMA and ionomycin to investigate the antigen-independent IFN-γ production during the course of HIV infection. Included are percentages IFN-γ–producing CD8+T cells (left panel) and tetramer+ T cells (right panel).
From 5 subjects we repeated tetramer staining and IFN-γ measurement on the early and late samples. When available the same time points were used. These second measurements showed similar IFN-γ/tetramer percentages except for one aberrant measurement of subject 57 (closed triangles in Figure 2, lower panels). Furthermore, 2 subjects (748 and 658) were simultaneously tested in Elispot assays, and Elispot results matched intracellular cytokine staining results (data not shown).
To investigate whether costimulation would result in different changes or IFN-γ+ T cells in HIV-infected patients over time, we tested early and late samples of 4 individuals in a 6-hour incubation assay including 10 μg peptide/mL, CD28, and CD49d antibodies. This resulted in higher numbers of IFN-γ+ T cells than obtained without costimulation, but similar trends in time were found (Figure 5B).
To determine whether the T cells in the samples investigated were in principle capable of IFN-γ production, we stimulated T cells with PMA and ionomycin to bypass early receptor signaling, and followed the IFN-γ production of CD8+ T cells and tetramer+ T cells in PBMCs collected during the course of HIV infection. Figure 5C shows that IFN-γ production in total CD8+ and tetramer+ T cells under these stimulation conditions did not significantly change during disease progression. This indicates that downstream from protein kinase C (PKC) activation and calcium mobilization, the signaling pathways remained intact during HIV infection.
IFN-γ–producing HIV-specific T cells correlate with CD4+ T-cell counts
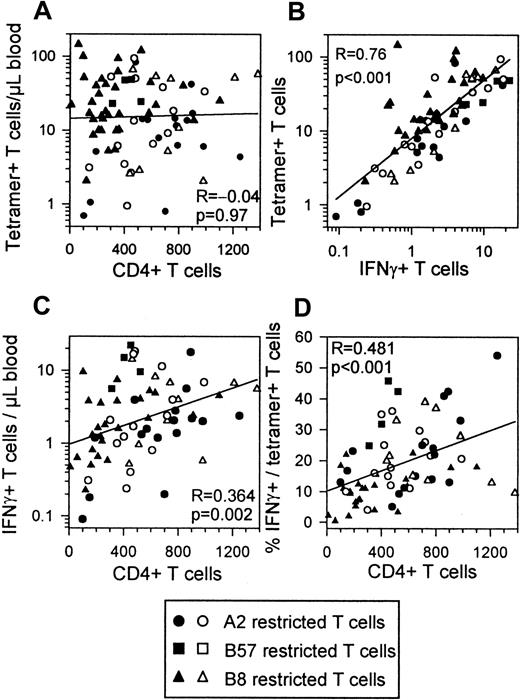
There is good evidence that CTL function is dependent on CD4+ T-cell help and that this help is reduced in HIV infection.27-29 When including all time points of the individuals investigated, numbers of tetramer+ T cells showed no correlation with CD4+ T cell counts (Figure6A). IFN-γ+ T cells and tetramer+ T cells showed a strong correlation as reported before24 (Figure 6B). In contrast to numbers of tetramer+ T cells, absolute numbers of IFN-γ–producing T cells did correlate with CD4+ T-cell counts (Figure 6C). The percentages of IFN-γ+ cells in the tetramer+ T cells and CD4+ T-cell numbers were strongly correlated (Figure 6D). CD4+ T cells and IFN-γ + T cells or IFN-γ/tetramer percentages showed best correlations within the progressors, whereas tetramer staining and IFN-γ production were best correlated within the asymptomatic group (data not shown).
Correlations between HIV-specific T cells CD4+ T cells IFN-γ+ T cells and IFN-γ+ fractions.
All time points of all subjects are included in each plot. Filled symbols indicate progressors (n = 11); open symbols, asymptomatics (n = 5). HLA restrictions are indicated. (A) Absolute numbers of tetramer+ T cells do not correlate with CD4+T-cell counts. (B) Absolute numbers of IFN-γ–producing CD8+ T cells correlate with absolute numbers of tetramer+ T cells. (C) Absolute numbers of IFN-γ–producing CD8+ T cells correlate with absolute numbers of CD4+ T cells. (D) IFN-γ+percentage of tetramer+ T cells correlates with CD4+ T cell counts.
In a multivariate stepwise regression analysis including absolute numbers and percentages of tetramer+ T cells and IFN-γ + T cells, percentage IFN-γ/tetramer and viral load, only the latter 2 variables were predictive for CD4+T-cell numbers. The percentage IFN-γ/tetramer was the strongest predictor with β = 0.614, P < .0001 compared to β = 0.42, P = .006 for viral load.
Discussion
Despite mounting evidence that HIV-specific CTLs are critical for suppressing HIV viral load, CTLs apparently decline and lose control of virus replication, resulting in progression to AIDS in almost all HIV-infected individuals.10 In this study we compared physical presence with functional responsiveness of HIV-specific CD8+ T cells, to investigate whether CTL control is lost due to physical depletion or due to impairment of function. HIV-specific T cells, as measured by tetrameric HLA-peptide complexes, were not depleted during progression to AIDS. In contrast, numbers of in vitro antigen-inducible IFN-γ–producing T cells decreased in most individuals progressing to AIDS. This study showed that progressors, in particular, had a significant drop in IFN-γ+ T cells compared to the relative stability of asymptomatic subjects.
Similar results have been found for EBV-specific T cells in individuals progressing to AIDS-related non-Hodgkin lymphoma.19 Previously, it has been observed that CTL precursor frequencies decline during progression to AIDS,9 indicating that cytolytic activity of HIV-specific T cells is impaired in the late stages of HIV infection. Here we used antigen-induced cytokine production as a readout for CD8+T-cell functionality, which was found to decrease in time, irrespective of total numbers of HIV-specific CD8+ T cells.
To compare presence and function of HIV-specific CD8+ T cells, we used the combination of HLA-peptide tetramers and peptide stimulation. Therefore, we were restricted to a limited number of epitopes. Although we selected the subjects based on recorded strong responses to the epitopes included, and the tested epitopes revealed similar dynamics, other epitopes may be involved. This may explain why the fraction of IFN-γ+ tetramer+ T cells correlated better with CD4+ T-cell numbers than absolute numbers of IFNγ+ T cells (Figure 5). The difference between IFN-γ and tetramer+ T cells may be a good indicator of the general immune function, more or less independent of the peptides investigated.21
Secretion of IFN-γ is an important effector function of viral suppression in HIV infection and other viral infections.30-32 IFN-γ production is typically induced shortly after antigenic stimulation,33 and has been shown to be a correlate for cytotoxic T-cell function.34 In healthy individuals, EBV-specific T cells could also be divided in IFN-γ+ and IFN-γ− T cells, paralleled by CD62L-selectin and CCR7 expression.17 These populations may represent functionally different subsets that can be distinguished by CCR7 expression and have different activation requirements.17,35 However, HIV-specific T cells were found to be mainly CCD7−, but also CD45RA−, indicating a skewed maturation, different from other virus-specific T cells.36
The HIV-specific T cells that do not produce IFN-γ in our assay may indeed have impaired activation kinetics whereby antigen stimulation sufficient to trigger T cells in early asymptomatic conditions may fail later in HIV infection. Our results show that costimulation increases the range of IFN-γ production, resulting in higher numbers of IFN-γ–producing T cells. Costimulation may decrease the threshold for T cells to respond and may partially compensate for decreased T-cell reactivity, as has been shown before.37Interestingly, T-cell function on antigen-independent stimulation (PMA + ionomycin) did not show the same decline as antigen-induced IFN-γ production. Apparently, the activation pathways downstream of PKC activation and Ca++ mobilization are not affected during progression to AIDS, but the T cell is not able to induce IFN-γ production on cognate TCR triggering. In this respect, the CD3ζ chain may be involved in this defect, as this component of the TCR complex is down-regulated in CD8+ T cells of HIV-infected individuals.38,39 These results are consistent with the reported loss of CD3/TCR-mediated T-cell activation during the course of HIV infection.37
The CD4+ T cell counts were correlated with the fraction of IFN-γ+ T cells, which suggests that CD4+T-cell help is required for functional CD8+ T cells. Zajac et al40 have shown that CD4 knockout mice can maintain high numbers of virus specific CD8+ T cells, but that these cells lack IFN-γ production, whereas wild-type mice had high numbers of IFN-γ+ T cells and were able to eliminate lymphocytic choriomeningitis virus infection. Several additional studies have pointed to the dependence of specific CD8+ T-cell function on CD4+ T-cell help.27,29,41 Shortly after primary infection, HIV-specific CD4+ T cells are no longer detectable28 and only in long-term asymptomatics are CD4+ T-cell responses, to some extent, preserved.42 Our results are in agreement with the need of CD4+ T cell help, but additional studies are required to show that depletion of HIV-specific CD4+ T cells precedes the CD8+ T-cell dysfunction observed here.
In conclusion, our results show that the decrease in CTL activity is not invariably caused by a physical depletion of the number of HIV-specific T cells but that antigen-induced IFN-γ production of HIV-specific CD8+ T cells gradually deteriorates during disease progression. This provides an explanation for the failure to prevent progression to AIDS despite initially strong HIV-specific CD8+ T-cell responses. Attempts have been made to restore T-cell immunity to HIV by autologous CTL transfusion; however, no long-term improvement has been observed.43,44 To improve T-cell function, various immunogenic45,46 or immunotherapeutic drugs have been used,47 48 with varying success. Our results show that immune-based therapies should focus primarily on improving T-cell quality above quantity, to enhance efficient HIV-specific CD8+ T-cell responses.
This study was performed as part of the Amsterdam Cohort Studies on AIDS, a collaboration between the Municipal Health Service, the Academic Medical Center and the CLB Sanquin. We thank E. Piriou for assistance with Elispot assays; M. Toebes and Dr T. Schumacher for assistance with generation of the tetramers; Dr M. Roos for immunophenotyping; and Drs H. Schuitemaker, R. van Lier, and M. Throsby for critically reading the manuscript.
Supported by the Dutch AIDS fund grant 2164, and the Dutch Organization for Scientific Research (NWO).
The publication costs of this article were defrayed in part by page charge payment. Therefore, and solely to indicate this fact, this article is hereby marked “advertisement” in accordance with 18 U.S.C. section 1734.
References
Author notes
Frank Miedema, Department of Clinical Viro-Immunology, CLB Sanquin Blood Supply Foundation, Plesmanlaan 125, 1066 CX Amsterdam, The Netherlands; email: f_miedema@clb.nl.

This feature is available to Subscribers Only
Sign In or Create an Account Close Modal