Abstract
Studies on purified blood dendritic cells (DCs) are hampered by poor viability in tissue culture. We, therefore, attempted to study some of the interactions/relationships between DCs and other blood cells by culturing unseparated peripheral blood mononuclear cell (PBMC) preparations in vitro. Flow cytometric techniques were used to undertake a phenotypic and functional analysis of DCs within the cultured PBMC population. We discovered that both the CD11c+ and CD11c− CD123hi DC subsets maintained their viability throughout the 3-day culture period, without the addition of exogenous cytokines. This viability was accompanied by progressive up-regulation of the surface costimulatory (CD40, CD80, CD86) and activation (CMRF-44, CMRF-56, CD83) molecules. The survival and apparent production of DCs in PBMC culture (without exogenous cytokines) and that of sorted DCs (with cytokines) were evaluated and compared by using TruCOUNT analysis. Absolute DC counts increased (for CD123hi and CD11c+ subsets) after overnight culture of PBMCs. Single-cell lineage depletion experiments demonstrated the rapid and spontaneous emergence of “new” in vitro generated DCs from CD14+/CD16+ PBMC radioresistant precursors, additional to the preexisting ex vivo DC population. Unlike monocyte-derived DCs, blood DCs increased dextran uptake with culture and activation. Finally, DCs obtained after culture of PBMCs for 3 days were as effective as freshly isolated DCs in stimulating an allogeneic mixed leukocyte reaction.
Introduction
Dendritic cells (DCs) are a unique leukocyte population, which control the primary immune response.1They are extremely potent antigen-presenting cells (APCs), distinguished by their exceptional ability to prime naive T cells. They lack the expression of CD3, CD14, CD16, and CD19 molecules but characteristically express high levels of major histocompatibility and costimulatory antigens. Two subsets of blood DCs have been described according to the differential expression of CD11c and CD123 antigens and peanut agglutinin binding.2-4 They appear to have distinctive characteristics and functions, including differential regulation by cytokines such as granulocyte colony-stimulating factor and Flt3 ligand.2 The classical CD11c+ myeloid DCs traffic into tissues and mucosal surfaces to act as immune sentinel cells and, after activation by pathogens or appropriate inflammatory stimuli, migrate by lymphatics to secondary lymphoid organs, where they initiate immune responses. The CD11c− DCs, often referred to as plasmacytoid or lymphoid DCs, express high levels of the CD123 antigen (interleukin [IL]-3 receptor α chain) on their surface. They are postulated to enter lymph nodes directly through the high endothelial venule to participate in immune responses.5
Although there is general agreement that blood DCs are derived from hematopoietic stem cells, the concept that the different DC subsets may represent the progeny of different lineages remains controversial. The CD11c+ myeloid blood DCs, express the CD13 and CD33 myeloid differentiation antigens and include precursors for both epithelial and deep tissue (eg, dermal) DCs. They depend on granulocyte-macrophage colony-stimulating factor (GM-CSF) for survival in vitro2,6but apparently not in vivo, as DC populations are unchanged in GM-CSF–deleted mice.7 In contrast, the CD11c− CD123hi DCs lack expression of CD13 and CD33 but express CD4 in greater amounts. Their survival in vitro is improved by the presence of IL-3.2,8 Functionally, the CD11c+ DCs have the greater antigen uptake and immunostimulatory capacity,3 whereas the CD11c− CD123hi DCs have the ability to produce substantial amounts of interferon-α on stimulation with pathogens.9 The ability to produce DC-like cells from monocytes cultured in GM-CSF plus IL-4 (and other mixtures) in vitro has introduced yet another potential DC precursor population into our considerations. There is some evidence that monocytes may differentiate into DCs in tissue,10 and we have postulated that this process provides a nascent boost to the APC populations in sites of significant infection or inflammation, rather than a primary route of differentiation for the myeloid DCs. In vitro studies on human DC differentiation plus studies using various relevant transcription factor–deleted mice are beginning to investigate some of these complexities in DC differentiation.
Blood DCs are commonly purified for functional studies, and similar preparations are also used in some clinical DC immunotherapy protocols.11 We showed previously that activated blood DCs were superior to freshly isolated DCs in processing, presenting, and stimulating antigen-specific T-lymphocyte responses.12However, as described, the ex vivo survival of isolated blood DCs, both CD11c+ and CD123hi, is highly dependent on the support of cytokines, without which in vitro activation and culture would result in substantial loss of numbers. We reasoned that it might be preferable to culture peripheral blood mononuclear cells (PBMCs) as a whole, before isolating the blood DCs for functional and/or immunotherapeutic protocols. We found that culturing DCs as part of the whole PBMC preparation not only provided the required DC activation but also afforded greater survival and, thus, recovery of functional blood DCs.
Materials and methods
Monoclonal antibodies and reagents
The following monoclonal antibodies (mAbs) were used. Phycoerythrin (PE)-conjugated CD3, CD14, CD16, CD19, CD34, CD7, CD80, and CD11c were obtained from Becton Dickinson (San Jose, CA); CD86, CD123, immunoglobulin (Ig)G1, and IgG2b isotype control were purchased from PharMingen (San Diego, CA); CD20, CD56, CD40, and CD83 were purchased from Coulter-Immunotech (Marseille, France); and CD64 was purchased from Serotec (Oxford, United Kingdom). Fluorescein isothiocyanate (FITC)–conjugated CD11c was purchased from Serotec, CD2 from Coulter-Immunotech, and cutaneous leukocyte antigen (CLA) from PharMingen. PE.Cyanin5 (PE.Cy5)-conjugated HLA-DR was purchased from Coulter-Immunotech and IgG1 isotype control from PharMingen; APC-conjugated CD11c and IgG1 isotype control from Becton Dickinson; unconjugated mAbs CD3 (OKT3) and CD11b (OKM1) were obtained from the American Type Tissue Collection (Rockville, MD); CD16 (HuNK2), CD19 (FMC63) were gifts from H. Zola (Adelaide, Australia); CD34 from Becton Dickinson, CD14 (CMRF-31), CMRF-44 (IgM), CMRF-56 (IgG1), as well as IgG1 (401.21), IgG2a (CMRF-84), and IgM (CMRF-50) isotype controls were produced at the Mater Medical Research Institute (Brisbane, Australia).13
FITC-conjugated sheep antimouse immunoglobulin (SAM) was purchased from Amrad Biotech (Victoria, Australia); PE.Cy5-conjugated streptavidin from DAKO (Carpinteria, CA); mouse serum, 7-amino-actinomycin-D (7-AAD), propidium iodide (PI), and lipopolysaccharide (LPS) were purchased from Sigma-Aldrich (St Louis, MO). FITC-Dextran (F-Dx, Mr = 42 000) and Lucifer yellow (LY) from Sigma-Aldrich were obtained as lyophilized powder and freshly reconstituted in medium before use. Tetanus toxoid (TT) was obtained from Commonwealth Serum Laboratories (Melbourne, Australia). TT was labeled with FITC (Sigma-Aldrich) in 0.5 M bicarbonate buffer (pH 9.5), dialyzed in phosphate-buffered saline (PBS) for 48 hours, and the FITC-to-TT molar ratio was determined to be 9.6:1.
Recombinant human GM-CSF (rhGM-CSF) was obtained from Sandoz-Pharma (Sydney, Australia), rh interleukin-3 (IL-3) from Gibco Life Technologies (Melbourne, Australia), rhIL-4 (Sigma-Aldrich), and rh tumor necrosis factor-α (TNF-α) from Hoffman-La Roche (Basel, Switzerland).
Complete media included RPMI 1640 supplemented with 10% fetal calf serum (FCS), penicillin (100 U/mL), streptomycin (100 μg/mL), L-glutamine (2 mM), and nonessential amino acids (all purchased from Gibco Life Technologies) was used throughout the study, except where indicated. For antigen uptake experiments, the media also contained 25 mM HEPES (Gibco Life Technologies). For some parallel culture experiments, X-VIVO 10 media (Biowhittaker, Walkersville, MD) was used.
Cell preparation and culture
PBMCs were prepared from either whole blood from healthy volunteers or buffy coats (Australian Red Cross Blood Service, Brisbane) by standard Ficoll-Paque (Pharmacia, Uppsala, Sweden) density gradient centrifugation.
Blood DCs were obtained from PBMCs by a 2-step purification method as described previously with minor modifications.13 Briefly, T cells, B cells, monocytes, and natural killer cells were depleted by using immunomagnetic cell separation (Biomag beads; Polysciences, Warrington, PA; and Variomacs; Miltenyi Biotech, Gladbach, Germany) with antibodies specific for CD3, CD19, CD14, CD11b, and CD16. To remove any remaining lineage-positive cells after the depletion procedure, this cell preparation was labeled with FITC-SAM, blocked with mouse serum, stained with PE-conjugated antibodies specific for CD7, CD20, CD34, CD56, and CD64, and then purified by using flow cytometric sorting (FACS Vantage; Becton Dickinson) for cells that were negative for FITC and PE signals.
Monocyte-derived DCs (Mo-DCs) were generated by using the adherence method as described previously.14 Briefly, PBMCs were plated in 80-cm2 Nunclon tissue culture flasks (Nunc, Roskilde, Denmark) and incubated for 2 hours. Nonadherent cells were removed, and the remaining cells were cultured in complete media with GM-CSF (200 U/mL) and IL-4 (50 U/mL) for 5 days to produce immature Mo-DCs,15 which were CD1a+CD14−CD83− (data not shown). These immature Mo-DCs were cultured in the presence of LPS (1 μg/mL) for a further 2 days to generate CD1a+CD14−CD83+ mature Mo-DCs.15T cells were obtained from PBMCs by using the sheep erythrocyte rosetting method13 and were more than 93% CD3+.
Flow cytometric analysis
To analyze DCs in fresh and cultured PBMCs, cells were stained with PE-conjugated lineage-specific mAbs (CD3, CD14, CD16, CD19) and CD34, and PE.Cy5-conjugated HLA-DR mAb (Figures1A, 2A, 6B). CD34 was added to the lineage mixture to exclude circulating hematopoietic stem cells.16 The expression of CMRF-44 and -56 was analyzed in the FITC channel. For other 3-color immunofluorescence staining of PBMCs, the combination of FITC fluorochrome for lineage markers, PE.Cy5 for HLA-DR, and PE for CD40, CD80, CD86, CD83, and CD123 and CD11c subset molecules, was used (Figure 1B,D). For each analysis, 3 × 10⁵ to 106 events were collected within the mononuclear gate. To further define the DC subsets in PBMCs, we used 4-color flow cytometric analysis by using the APC channel for CD11c (Figures3D and 4). Sorted Lin− cells were gated for HLA-DR staining (PE.Cy5) and then analyzed for their expression of CD11c (FITC) and CD123 (PE). Analysis was performed on a FACS Calibur flow cytometer (Becton Dickinson) by using CellQuest software (Becton Dickinson). Data were analyzed by using either CellQuest 3.1 or FCS Express software (De Novo Software, ON, Canada).
Identification of blood DCs in cultured PBMCs.
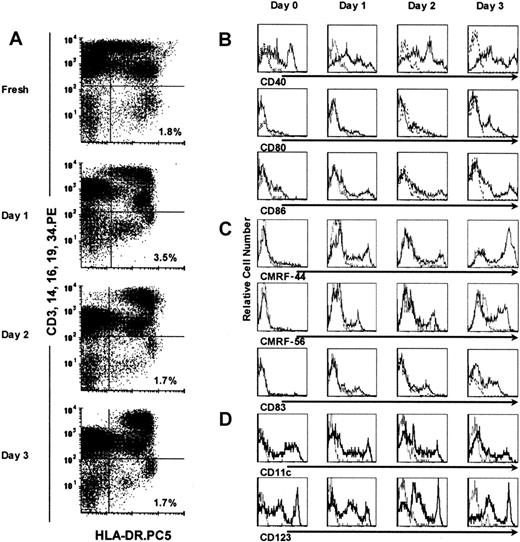
DCs were defined as cells that were negative for CD3, CD14, CD16, CD19, and CD34 (Lin−), and express HLA-DR (HLA-DR+); they represented a distinct cell population in cultured PBMCs for up to 3 days (right lower quadrants in A). The expression of CD40, CD80, CD86 costimulatory molecules (B); CMRF-44, CMRF-56, and CD83 activation markers (C); and CD11c+ and CD123+subset markers (D) on gated Lin− HLA-DR+ DCs was assessed by using 3-color flow cytometry. Isotype control mAb staining is shown (broken line).
Viable cells were gated based on forward and side scatter characteristics (R1, Figure 2A). Within the R1 gate, more than 99.5% of the cellular events in PBMCs and sorted DCs, fresh and cultured (to 3 days), were negative for 7-AAD or PI when labeled (data not shown).
TruCOUNT analysis of absolute DC numbers in cultured PBMCs.
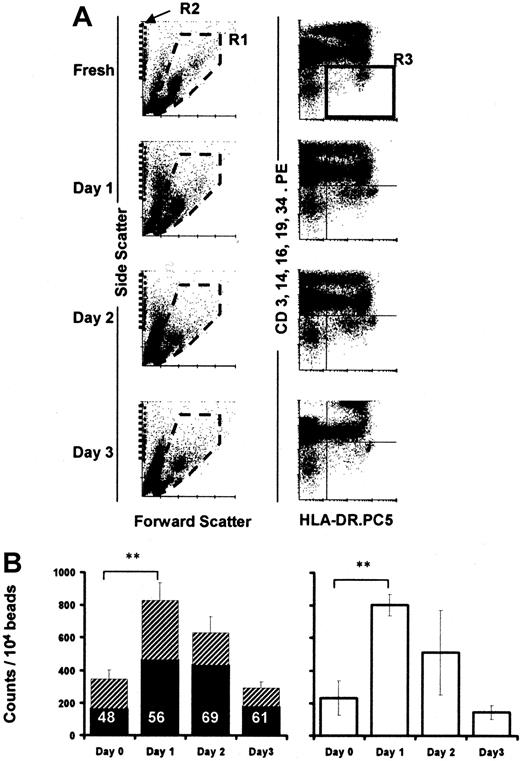
Dot plots demonstrate the forward and side scatter profiles of cultured PBMCs (A, left column). PBMCs were gated in R1, TruCOUNT beads in R2 (A, left column), and Lin− HLA-DR+ DCs in R3 (A, right column). Absolute DC numbers were calculated as the mean of triplicate determined by the number of Lin−HLA-DR+ events per 10 000 TruCOUNT beads acquired for each time point (n = 8, B, left). The filled and hatched portions of the bars represent the proportion of Lin− HLA-DRloand Lin− HLA-DRhi cells in R3, respectively. The proportion of Lin− HLA-DRlo cells is shown as percentage of total DCs. PBMCs were irradiated (3000 Gy) before culture (n = 3, B, right). Error bars show SEM. (**,P < .001).
TruCOUNT analysis of absolute cell counts
TruCOUNT tubes (Becton Dickinson) were used to determine the absolute counts of DCs in PBMC cultures. Each tube contained a lyophilized pellet that dissolves, releasing a known number of fluorescent beads. The tubes were used according to manufacturer's recommendations with minor modifications.17 PBMCs were seeded and cultured in 96-well flat-bottom plates at 107cells/mL (200 μL/well) and were harvested for staining at the various time points. The antibody mixture (CD3, CD14, CD16, CD19, CD34)-PE and HLA-DR.PE.Cy5 was prepared for the experiment at a 1:30 dilution first, to ensure a consistent concentration of antibodies for each analysis. Then, 30 μL antibody mix was added to the TruCOUNT tube, followed by 20 μL of cells from the wells. The tube was vortexed gently and incubated in the dark at room temperature for 15 minutes. Finally, 350 μL PBS was added, making a total volume of 400 μL before FACS analysis. A minimum of 500 Lin− HLA-DR+ DC events (R3, Figure 2A), and/or 20 000 to 35 000 beads (R2, Figure 2A) were acquired for each analysis. Each sample was analyzed in triplicate. The absolute number of DCs in each sample was calculated as the average of the triplicate tubes, each being determined by comparing the cellular events (R3) with bead events (R2) and expressed as DC counts/104 beads.
Depletion assays
Single-cell lineages or populations in PBMCs were labeled by using the PE-conjugated mAb: CD14, CD16, CD19, or CD3, respectively. Each cell population was depleted by FACS sorting and cultured in parallel with unseparated PBMCs, as the positive control for each experiment. The cultured cells were labeled and analyzed by FACS to assess the percentage of DCs present at predetermined time points of the culture period.
Antigen uptake assays
PBMCs were seeded in 6-well plates at 107 cells/mL for culture, harvested each day, and resuspended in complete medium for incubation with the antigens. F-Dx (1 mg/mL), LY (1 mg/mL), or F-TT (0.5 mg/mL) was added and incubated with the cells either at 4°C (control) or 37°C for 60 minutes. Cells were washed 4 times in cold PBS, then stained with the antibody mixture (CD3, CD14, CD16, CD19, CD34)-PE and HLA-DR.PE.Cy5, and analyzed immediately by FACS. The level of antigen uptake by DCs was assessed on the FITC channel after gating for the Lin− HLA-DR+ cells and was calculated as the difference in mean fluorescence intensity (ΔMFI) between the test (37°C) and control (4°C) tubes for each sample.
Allogeneic mixed leukocyte reaction
Sorted DCs (10 to 20 000 cells per well) were incubated with allogeneic T lymphocytes (105 cells) for 5 days in 96-well U-bottom plates. Sixteen hours before harvesting the cells, 18.5 kBq of3H-thymidine was added to each well.3H-thymidine uptake was counted in a liquid β-scintillation counter (MicroBeta Trilux Scintillation Counter; Wallac, Turku, Finland).
Statistical analysis
Paired statistical analysis was performed by using the Student 2-tailed t test.
Results
Blood DCs survive in cultured PBMCs without exogenous cytokines
Blood DCs were defined within PBMCs by 2-color flow cytometric analysis as HLA-DR+ cells that were lineage (CD3, CD14, CD16, CD19, and CD34) negative. Sorted blood DCs survived poorly in vitro when isolated from the PBMC environment, even when cultured with the cytokines GM-CSF and IL-3.2 8 However, we found that when kept in contact with the other PBMCs, the DCs survived for at least 3 days, in vitro, without the addition of exogenous cytokines (Figure 1A). The relative percentage of Lin− HLA-DR+ DCs in PBMCs was the same at the end of a 3-day culture as at its initiation (n = 10). The Lin− HLA-DR+ DCs in cultured PBMCs appeared to separate into discrete HLA-DRhi and HLA-DRlopopulations compared with the more homogeneous profile obtained when examined immediately ex vivo (Figure 1A). An apparent increment in the relative percentage of Lin− HLA-DR+ DCs was also noted on day 1 (more in next section). When parallel experiments (n = 3) were performed by using X-VIVO 10 (a serum-free medium), we observed the same phenomenon. There was no statistically significant difference between the 2 culture systems (days 1-3,P > .7).
We analyzed these cultured PBMC DCs for their expression of the costimulatory molecules (CD40, CD80, and CD86) and the activation markers (CMRF-44, CMRF-56, and CD83). DCs within the PBMC cultures spontaneously and progressively up-regulated these molecules in culture (Figure 1B,C). Both DC subsets, defined by the CD11c and CD123 molecules, were maintained in PBMCs throughout the culture period (Figure 1D), although the CD11c+ DC population up-regulated its expression of the CD123 antigen (Figure 3B,D). The Lin− HLA-DR+ DCs analyzed in fresh PBMCs and after overnight culture also expressed CLA and CD2 (data not shown). When LPS (10 ng/mL) or TNF-α (10 ng/mL) was added to the culture on day 0, the expression of costimulatory molecules (CD40, CD86) and activation markers (CMRF-44, CD83) on DCs was higher (MFI) than would otherwise be seen after overnight culture and equaled that attained after 2 days of culture (data not shown).
TruCOUNT analysis of sorted DCs in culture with GM-CSF and IL-3.
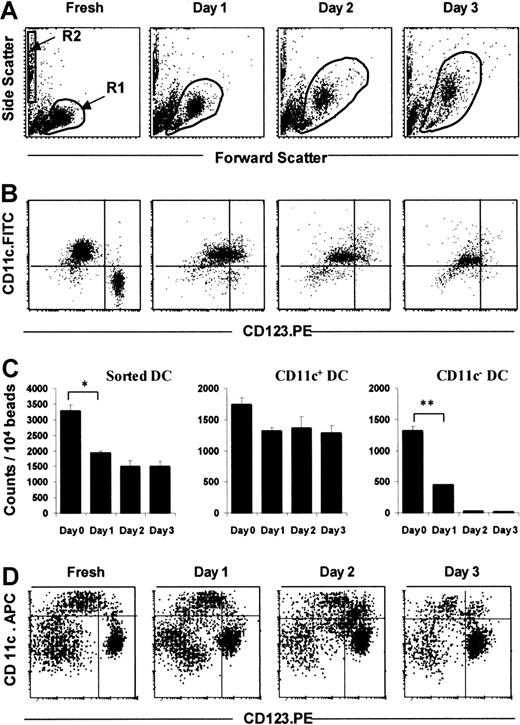
Dot plots demonstrate the forward and side scatter profiles of sorted DCs in culture supplemented with GM-CSF and IL-3 (A). Sorted Lin− cells were gated in R1, and TruCOUNT beads in R2 (A). After gating for HLA-DR expression (R3, not shown), Lin−HLA-DR+ DCs were analyzed for their subset composition according to their expression of CD11c and CD123 (B). Absolute DC counts were calculated as the number of Lin−HLA-DR+ cells per 10 000 TruCOUNT beads acquired (mean of triplicate, C, left). The absolute counts for DC subsets were calculated in similar fashion, based on the expression of CD11c (C, middle and right). This pattern is representative of 4 separate experiments. For comparison, dot plots of a 4-color immunofluorescent FACS analysis of cultured PBMCs (Lin.FITC, HLA-DR.PE-Cyanin5) demonstrated the persistence of both the CD11c+ and, more strikingly, the CD123+ DC subsets after 3 days of culture (D). Error bars show SEM. (*, P < .05; **,P < .001).
TruCOUNT analysis quantifies rise of absolute DC counts in cultured PBMCs
The definite but variable increase in the percentage of DCs in PBMCs noted after overnight (16-24 hours) culture (n = 10) was investigated further. To assess whether the increase in number reflected an increase in absolute DCs or differential survival with respect to the other PBMC populations in culture, TruCOUNT beads (Figure 2A) were used to obtain absolute DC counts in 8 further experiments. The TruCOUNT analysis confirmed a significant rise in absolute counts of Lin− HLA-DR+ events after the overnight culture period (P < .001, n = 8; Figure2B left) and showed a close correlation between the changes in the percentage of DC number (in PBMCs) and absolute cell counts (not shown). The HLA-DRlo DC population increased by 235% ± 77% (SEM) compared with 150% ± 45% (SEM) in the HLA-DRhi population (Figure 2B left).
To exclude the possibility that DCs or DC precursor proliferation during the culture period was responsible for the increase, fresh PBMCs were irradiated (3000 Gy), then cultured, and analyzed in parallel with their nonirradiated controls, again using TruCOUNT beads. Irradiation of the starting PBMC preparation did not affect the rise of absolute DC counts (n = 3): Similar increases in absolute Lin−HLA-DR+ DCs occurred in both instances (Figure 2B), indicating that proliferation of DC precursors was not contributory.
Isolated DCs survive poorly in culture as determined by TruCOUNT analysis
By using the TruCOUNT assay, we confirmed previous data,2 8 indicating that isolated DCs survive poorly, even when cultured with GM-CSF and IL-3. Sorted Lin− cells increased in size and granularity with culture as indicated by changes in the forward and side scatter profiles (Figure 3A). Three-color FACS analysis with the fluorochrome combination of HLA-DR-PE.Cy5, CD11c.FITC, and CD123.PE was used. The (HLA-DR+) CD11c+ DC subset can be easily distinguished from the (HLA-DR+) CD11c− CD123hipopulation immediately ex vivo, but after overnight culture, some of the CD11c+ cells, which were CD123lo, up-regulated the intensity of CD123 expression (Figure 3B), whereas CD11c− CD123hi cells died rapidly. In freshly isolated DCs, less than 1% was double-positive (ie, CD11c+CD123hi) but this double positivity rose to 33% after overnight incubation. The isolated CD11c+ DC subset survived better (74% to 78% of starting cells on days 1 to 3), whereas the isolated CD11c− CD123hi DC subset numbers fell sharply to 34% of the starting population after overnight culture and to 2% and 1% of the original cells on days 2 and 3, respectively (Figure 3B,C).
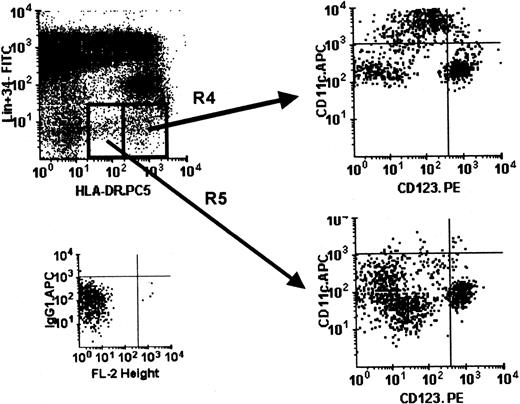
Because the CD11c+ DC subset up-regulated CD123 antigen expression (Figure 3B), we used 4-color flow cytometry (with the fluorochrome combination of Lin.FITC, HLA-DR-PE.Cy5, CD11c.APC, and CD123.PE) to define the 2 DC subsets in cultured PBMCs accurately. The CD11c− CD123hi DC subset persisted and remained as a discrete population throughout the 3-day culture period (Figure 3D), unlike the sorted CD11c− CD123hiDCs (Figure 3B,C). We also noted that a CD11c+CD123hi population emerged during culture (Figure 3D), as predicted by the experience with cultured sorted CD11c+ DCs (Figure 3B). As mentioned earlier, the DCs in cultured PBMCs expressed different levels of cell surface HLA-DR (Figures 1A and 4). The HLA-DRhi population contained both the CD11c+and CD11c− CD123hi DC subsets, whereas the HLA-DRlo population contained more CD123hi DCs (Figure 4). This observation was the same for sorted Lin−DCs (data not shown). We noted the presence of some double-negative CD11c− CD123− cells in the Lin−HLA-DR+ population, and this double negativity is now the subject of independent investigation.
Differential HLA-DR expression in DCs within cultured PBMCs.
Using 4-color immunostaining, the Lin−HLA-DRhi (R4) and Lin− HLA-DRlo(R5) cells in cultured PBMCs (day 1) were analyzed with respect to the composition of the DC subsets (CD11c+ and CD123+). Isotype control for APC is shown. This pattern is representative of PBMCs cultured for up to 3 days in 3 separate experiments.
DC numbers increase rapidly in cultured PBMC
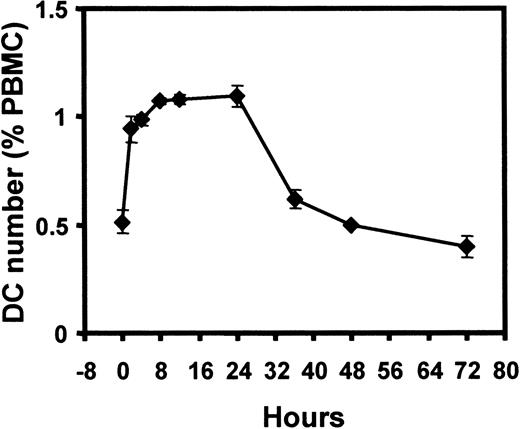
Because the rise in Lin− HLA-DR+ DCs occurred mainly within the first 24 hours, we proceeded to evaluate this phenomenon more closely. The increase was rapid and occurred within the first 4 hours of incubation, with the peak and plateau attained after 8 to 12 hours of incubation (Figure5). The DC number returned to baseline level after 48 hours of culture (Figure 5). Taken together with the cell irradiation experiments above, this finding suggested that the increase in cell numbers was due to the contribution of either a population of Lin+ cells (down-regulating their markers) or a population of Lin− HLA-DR− cells, up-regulating HLA-DR expression to enter the Lin−HLA-DR+ DC pool on culture in vitro.
Kinetics of DC number change during PBMC culture.
DC number (percentage of PBMCs) in cultured PBMCs, with closer assessment in the first 24 hours. Each time point was performed in triplicate. Error bars show SEM. This pattern is representative of 4 separate experiments.
Kinetics of DC number change during PBMC culture.
DC number (percentage of PBMCs) in cultured PBMCs, with closer assessment in the first 24 hours. Each time point was performed in triplicate. Error bars show SEM. This pattern is representative of 4 separate experiments.
PBMC CD14+ and CD16+ cells contribute to the Lin− HLA-DR+ DC pool during culture in vitro
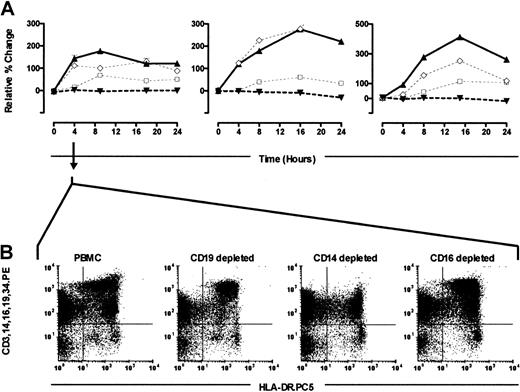
To address the origin of the increase in Lin−HLA-DR+ DCs, we performed a series of depletion experiments. Single-cell populations were removed from PBMCs by using appropriate CD markers (CD19, 14, 16, and 3), and each depleted PBMC population was then cultured in parallel with the control-starting whole PBMC preparation. The Lin− HLA-DR+ gate was used to follow changes in cell numbers and cell dot plot profiles. In contrast to the characteristic rise in DC numbers in whole PBMC cultures (Figure 6), the Lin− HLA-DR+ DC number remained remarkably constant in the PBMC cultures that were depleted of CD14+monocytes (Figure 6). In the CD16+ cell-depleted cultures, the Lin− HLA-DR+ DC number only rose after the 4-hour time point, and this rise was considerably attenuated (Figure6). When CD19+ B cells were depleted, the effect was minimal (Figure 6). Similarly, the removal of CD3+ T cells from the culture system did not affect the rise in DC number (n = 2, not shown). This finding clearly demonstrated that the rapid and spontaneous in vitro emergence of “new” Lin−HLA-DR+ cells required the presence of CD14+and/or CD16+ PBMCs in the culture.
Depletion experiments.
PBMCs were sort-depleted of CD14, CD16, or CD19 cells and cultured in parallel with whole PBMC samples. The percentage of DCs within the whole PBMC culture (▴, continuous line), CD14-depleted (▾), CD16-depleted (□), and CD19-depleted (⋄) was evaluated over a 24-hour period (3 experiments shown). Analyses at each time point were performed in triplicates. Error bars show SEM (A). Dot plots demonstrating the Lin− HLA-DR+ DC profiles within the different depleted cultures at the 4-hour incubation time point from one experiment are shown (B), and they are representative of the 3 separate experiments performed.
The new Lin− HLA-DR+ population was mainly in the HLA-DRlo region of the DC gate. After a period of culture, the Lin− HLA-DR+ cells showed clear separation into 2 clusters based on their HLA-DR expression (Figures1A, 4, and 6). This phenomenon was absent when PBMCs were either depleted of CD14+ or CD16+ cells, (Figure 6B, 4-hour culture), suggesting that the new Lin−HLA-DR+ cells were predominantly represented in the HLA-DRlo region of the DC gate.
Activated DCs increase dextran but decrease TT uptake capacity
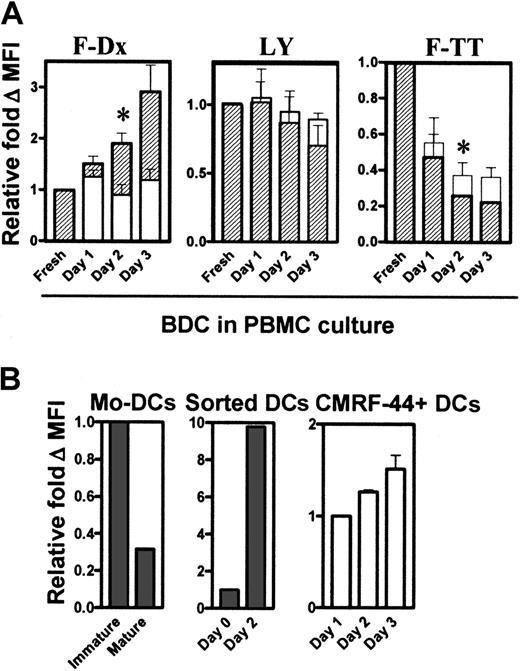
Next, we tested the antigen uptake capacity of the DCs within PBMCs. Previous reports have shown that TNF-α differentiated/activated Mo-DCs and that cultured Langerhans cells down-regulate their antigen uptake capacity and their increased allostimulatory activity.14 In direct contrast to this, the culture and activation of DCs in PBMC preparations increased their uptake capacity of F-Dx (Figure 7A, left). The uptake of the soluble agent LY did not change greatly during culture (Figure 7A, middle). The greatest uptake of F-TT occurred with fresh DCs and, thereafter, decreased progressively with culture and activation (Figure 7A, right). In each test system, the HLA-DRhi population (Figure 7A, hatched bars) appeared to have better antigen uptake capacity than the HLA-DRlopopulation (Figure 7A, open bars).
Antigen uptake by DCs in cultured PBMCs.
DCs within the PBMC cultures were tested for their ability to take up F-Dx, LY, and F-TT fresh and after culture (A). The amount of antigen uptake was determined by FACS analysis, calculated as the ΔMFI (37°C − 4°C), and expressed as relative fold ΔMFI compared with the baseline value of 1. Hatched bars represent the HLA-DRhi DC population (R4, Figure 4), and the open bars represent the HLA-DRlo (R5, Figure 4) population. At least 3 separate experiments were performed. Immature and LPS-matured Mo-DCs, fresh and cultured sorted DCs, and CMRF-44+CD14−CD19− DCs (n = 3), were tested for their F-Dx uptake capacity (B). Error bars show SEM. (*,P < .05).
We then generated Mo-DCs and confirmed reports of our own15,18 and others14 that their F-Dx uptake capacity was dramatically reduced when they become differentiated/activated (Figure 7B, left). However, the cultured sorted Lin− HLA-DR+ blood DCs increased uptake to a level similar to undifferentiated Mo-DCs. Freshly sorted Lin− HLA-DR+ DCs took up F-Dx poorly but, after activation in culture, dramatically increased F-Dx uptake capacity (Figure 7B, middle). Both blood DC subsets increased F-Dx uptake on culture, with the CD11c+ population taking up at least 25 times more material (data not shown). DCs defined by the CMRF-44 antigen expression after overnight culture also improved their F-Dx uptake with extended in vitro culture (Figure 7B, right).
DCs isolated from cultured PBMCs are efficient stimulators in the mixed leukocyte reaction
Finally, to test their costimulatory function, DCs were sorted from PBMCs after 3 days of in vitro culture and tested for their allostimulatory capacity. DCs cultured with PBMCs were as efficient as freshly isolated DCs in stimulating the allogeneic mixed leukocyte reaction (MLR) in 3 separate experiments (data not shown).
Discussion
This study produced the entirely novel finding that DCs survive in cultured PBMCs for up to 3 days without the addition of exogenous cytokines. This data contrasted notably with what appeared to be the mandatory addition of cytokines to maintain even modest isolated blood DC survival.2,8 Of particular importance, we were able to identify the CD123hi CD11c− subset of DCs on day 3 of the PBMC culture, whereas cultured isolated CD123hi DCs died rapidly. We confirmed the in vitro survival of the DCs in PBMCs by using TruCOUNT beads to evaluate absolute DC numbers. It appears that the natural production of cytokines, which we have yet to characterize, and more importantly, the cell-cell contact in the PBMC cultures provided the relevant survival signals to maintain both DC subpopulations. These signals were not provided by the cytokines, which we and others have used to maintain isolated blood DCs. In parallel experiments, when serum-free condition was used, we observed the same phenomenon, indicating at least that the presence of FCS in our standard media was not required. This finding augurs well for its potential application in the clinical setting. We also noted that, whereas the current division of ex vivo blood DCs into 2 broad subsets has been based on the reciprocal expression of the CD11c and CD123 antigens, this phenotypic relationship was less evident after in vitro culture. The CD11c+ DCs in cultured PBMCs and cultured sorted Lin− HLA-DR+ DCs both up-regulated surface expression of CD123 to levels similar to that on CD11c−CD123+ DCs. This definition of DC subsets may well be superseded with the generation of new mAbs specific for human DCs.8 16
We also established a second phenomenon, namely an increase in the absolute numbers of Lin− HLA-DR+ cells in PBMCs after overnight culture. This phenomenon was also validated by using the TruCOUNT assay and occurred rapidly, within a 4-hour incubation period. By using depletion techniques, we provide evidence that the relevant DC progenitors were CD14+ and/or CD16+ cells, but curiously their progeny appeared to include the CD11c− CD123+ DCs. The CD14lo population of PBMCs accounts for approximately 10% to 20% of all the CD14+ cells, and they also express CD16 and have been reported to show DC-like characteristics,16,19,20 In other reports, subpopulations of CD16+ cells and CD2+monocytes21,22 (but not CD2−) can lose CD16 and CD14 expression, respectively, after 2 days of culture in vitro. Some groups have suggested a lymphoid origin for the human CD123+ DCs.23,24 Although they do not have surface expression of myeloid markers, they express CD68 (a myeloid marker)25 intracellularly, suggesting that their true hematopoietic origins are less certain.1 When CD14+ or CD16+ were depleted from the cultured PBMC preparations, the increase in the Lin−HLA-DRlo DC population did not occur. The 4-color FACS analysis of cultured PBMCs showed that the HLA-DRlo cells were composed mainly of the CD11c− CD123hisubset, thus raising the remarkable possibility that some of the CD123hi DCs are derived from CD14+/CD16+ myeloid precursors. Recent mouse data, suggesting that the common myeloid progenitors from thymus and spleen can give rise to both lymphoid CD8α− and myeloid CD8α− DCs26 and, conversely, that lymphoid progenitor from Pax 5–deficient mice can differentiate into myeloid DC,27 provide precedents for suggesting that the lineage human DC differentiation may be more plastic. Although conclusions based on our data would be premature, the method for culturing PBMCs described here is suited to tracking appropriately labeled precursor cell populations.
The differentiation pathway of DCs from CD34+ hematopoietic progenitors has been studied in vitro.28 CD34+cells obtained from peripheral blood, bone marrow, or cord blood cultured with GM-CSF and TNF-α can produce 2 distinct DC colony types that express CD1a and CD14, respectively. The CD1a+precursor differentiates into typical Langerhans cells with Birbeck granules and intracytoplasmic Langerin. The CD14+ precursor gives rise to DCs that may represent the interstitial DCs, or Mo-DCs, which can also be generated directly from CD14+ blood monocytes. The in vitro generation of CD123+ DCs from CD34+ cells by using Flt3 ligand has recently been reported.29,30 We31 and others32have suggested that myeloid DCs may be derived from a CD14 intermediate cell, perhaps in marrow. At the peripheral blood level, myeloid DCs and blood DCs are readily discriminated as precursors of tissue forms. Moreover, they change in number and respond to stress and disease in a distinct fashion.33 Our data suggest that only a small percentage of CD14+ cells spontaneously entered into the Lin− HLA-DR+ DC population. The disparate phenotypic and functional characteristics noted between blood DCs and Mo-DCs again suggest that most CD14+ monocytes do not normally differentiate into preformed myeloid DCs. Further studies are needed to clarify this issue, and the identity of the CD11c− CD123−Lin−HLA-DR+ cells.
Circulating blood DCs do not up-regulate expression of costimulatory (CD40, CD80, CD86) or activation (CMRF-44, CMRF-56, CD83) markers in the face of stress and associated cytokine changes,33 yet they invariably up-regulate these molecules, when isolated from the blood. The presence of other PBMCs, although enhancing DC survival in vitro, did not prevent the up-regulation of DC differentiation/activation markers in the whole PBMC cultures. This finding led us to speculate that the vascular endothelium, which prevents activation of the clotting and coagulation cascades, may also be important in maintaining the quiescent state of the circulating DCs during surgical and physical stress.33 It is interesting to speculate that the rapid increase in circulating DC counts noted in those studies may, in part, be due to the recruitment of the PBMC progenitors documented here.
In contrast to what has been described for Mo-DCs, we have established that blood DCs increase their dextran uptake capacity with extended in vitro culture and activation. This finding confirms preliminary observations in this regard18 and our previous functional antigen presentation data.12 The macrophage mannose receptor (MMR), which mediates dextran uptake in Mo-DCs,14is not constitutively expressed on blood DCs ex vivo or after activation,18 (K. A. MacDonald et al, unpublished data, December 2001). Therefore, although the dextran uptake may still be receptor dependent, this mechanism is unlikely to be mediated by the MMR. Further studies are now under way to determine if DEC 205 (CD205), another C-type lectin receptor constitutively expressed on blood DCs, may be responsible for this function.
There is intense interest in using DCs and exploiting their distinctive immune function for cancer immunotherapy. Although they can be isolated from tissues like tonsils and skin, the most accessible source of DCs is in the blood. Most clinical immunotherapy trials for various cancers have used DCs derived in vitro from monocytes (Mo-DCs).11,34 The use of monocytes as the source of DCs, rather than directly harvested blood DCs, is facilitated by the fact that monocytes make up 10% to 15%, whereas blood DCs constitute less than 1% PBMCs. Mo-DCs are prepared in vitro from blood monocytes under the control of cytokines (generally, GM-CSF and IL-4) over a period of 5 to 14 days and, once produced, require a further defined stimulus to activate/mature them.14 DCs generated from CD34+ hematopoietic stem cells in vitro have also been used in some immunotherapeutic protocols.11,34 We champion the use of DCs isolated directly from blood. This latter approach offers clear theoretical advantages in that these blood DCs are in their natural and defined state of differentiation, free from the influence of exogenous cytokines, and presumably capable of responding to and stimulating immune responses in a more physiologic manner.35 DCs that are directly harvested from blood spontaneously acquire an activated phenotype after a brief period (hours) of in vitro culture.33 PBMCs can be cultured as a whole to induce an appropriate amount of differentiation/activation before isolating the blood DCs, perhaps using mAbs CMRF-44 and -5613 36 selection, and magnetic bead separation (J.A.L. et al, unpublished data, January 2002). Blood DCs are, in our hands, more efficient than Mo-DCs in inducing primary proliferative and interferon-γ responses (Y. Osugi et al, unpublished data, January 2002).
We have described an entirely new assay for studying the physiology of blood DCs. This system maintained blood DC survival in culture, provided the requisite DC activation (without the need for exogenous cytokines or stimuli), and permitted effective antigen loading into DCs. Furthermore, these findings may represent a more physiologic option for antigen-loading DCs in cultured PBMCs before their isolation for immunotherapeutic protocols.
We thank Dr Slavica Vuckovic for constructive discussion of the data, L. Brown, G. Chojnowski, C. Schmidt, and M. Rist for assistance in cell sorting and 4-color flow cytometry. We thank all our volunteers and the Australian Red Cross Blood Service, Brisbane, for blood supplies.
Supported by a Mater Medical Research Institute grant. C.S.K.H. was supported by the Royal Australasian College of Surgeons' Raelene Boyle and the Paul Mackay Bolton Cancer Research Scholarships.
The publication costs of this article were defrayed in part by page charge payment. Therefore, and solely to indicate this fact, this article is hereby marked “advertisement” in accordance with 18 U.S.C. section 1734.
References
Author notes
Derek N. J. Hart, Mater Medical Research Institute, Aubigny Place, Raymond Terrace, South Brisbane, QLD 4101, Australia; e-mail: dhart@mmri.mater.org.au.

This feature is available to Subscribers Only
Sign In or Create an Account Close Modal