Key Points
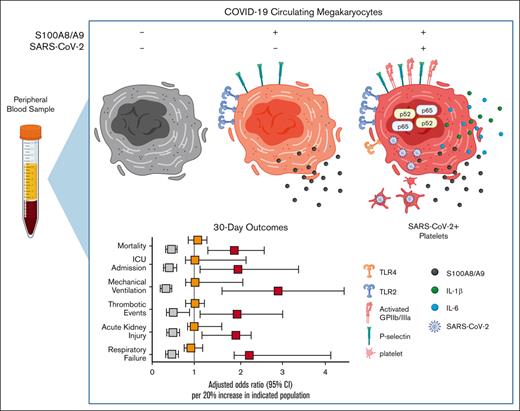
To our knowledge, we provide the first evidence implicating SARS-CoV-2+ peripheral blood megakaryocytes in severe disease.
Circulating megakaryocytes warrant investigation in inflammatory disorders beyond COVID-19.
Abstract
Several independent lines of evidence suggest that megakaryocytes are dysfunctional in severe COVID-19. Herein, we characterized peripheral circulating megakaryocytes in a large cohort of inpatients with COVID-19 and correlated the subpopulation frequencies with clinical outcomes. Using peripheral blood, we show that megakaryocytes are increased in the systemic circulation in COVID-19, and we identify and validate S100A8/A9 as a defining marker of megakaryocyte dysfunction. We further reveal a subpopulation of S100A8/A9+ megakaryocytes that contain severe acute respiratory syndrome coronavirus 2 (SARS-CoV-2) protein and RNA. Using flow cytometry of peripheral blood and in vitro studies on SARS-CoV-2–infected primary human megakaryocytes, we demonstrate that megakaryocytes can transfer viral antigens to emerging platelets. Mechanistically, we show that SARS-CoV-2–containing megakaryocytes are nuclear factor κB (NF-κB)-activated, via p65 and p52; express the NF-κB–mediated cytokines interleukin-6 (IL-6) and IL-1β; and display high surface expression of Toll-like receptor 2 (TLR2) and TLR4, canonical drivers of NF-κB. In a cohort of 218 inpatients with COVID-19, we correlate frequencies of megakaryocyte subpopulations with clinical outcomes and show that SARS-CoV-2–containing megakaryocytes are a strong risk factor for mortality and multiorgan injury, including respiratory failure, mechanical ventilation, acute kidney injury, thrombotic events, and intensive care unit admission. Furthermore, we show that SARS-CoV-2+ megakaryocytes are present in lung and brain autopsy tissues from deceased donors who had COVID-19. To our knowledge, this study offers the first evidence implicating SARS-CoV-2+ peripheral megakaryocytes in severe disease and suggests that circulating megakaryocytes warrant investigation in inflammatory disorders beyond COVID-19.
Introduction
A feature of COVID-19 that has not attracted much attention is the involvement of megakaryocytes (MKs), a cell type not typically associated with acute inflammatory diseases. MKs are classically restricted to the bone marrow, in which they function to produce platelets, but smaller populations of MKs exist in the lungs and spleen.1,2 Intravital imaging and other methods have revealed that MKs migrate out of the bone marrow and enter the central venous circulation in healthy condititions.1,3 MKs within the pulmonary circulation display dynamic movement and actively release large numbers of platelets.1 At least 50% of all circulating platelets originate from MKs within the pulmonary circulation, suggesting that the lungs are a major site for platelet biogenesis.1 Blood samples obtained at the time of cardiac bypass surgery suggest that mobilized MKs are filtered out at the site of the pulmonary microvasculature.4-6 Yet some enter the systemic circulation, appearing as smaller cells with considerably higher nuclear-to-cytoplasmic ratios.6-8 Interestingly, pulmonary diseases, such as bronchitis and bronchopneumonia, are associated with increases in circulating MKs in both the pulmonary and systemic blood.1,9
Recently, MKs and platelets have been shown to play important roles during pulmonary infection. Lung platelets are required for neutrophil recruitment and transmigration during active infection and regulatory T-cell recruitment and anti-inflammatory cytokine expression during resolution.10,11 Lung MKs have recently been shown to process and present antigens, express Toll-like receptors (TLRs) and costimulatory molecules, and secrete and respond to cytokines.1,2,12 Furthermore, studies on human MK development have demonstrated differentiation trajectories that give rise to MK subsets with immune signatures.13 Thus, MKs have the potential to contribute to acute inflammatory diseases, especially those affecting the lungs.
In COVID-19, MKs were first implicated in severe disease because of widely observed thrombosis and platelet dysfunction. In patients with severe disease, increased incidences of venous and arterial thromboses are major contributors to mortality and morbidity.14 Platelets in COVID-19 are well described as hyperactivated and prone to thrombosis and have been shown to contain active severe acute respiratory syndrome coronavirus 2 (SARS-CoV-2).15-19 Moreover, rare platelet disorders, such as thrombotic thrombocytopenia, have been reported after SARS-CoV-2 vaccination, further implicating the role of these cells in the viral immune response.20-22
Case series from COVID-19 autopsies have consistently reported the presence of extramedullary MKs in a diverse array of diseased organs. These include the coronary arteries of the heart, glomeruli of kidneys, microvasculature and parenchyma of the lungs, sinusoids of the liver, and cortical capillaries of the brain.23-29 These results support an increased mobilization of MKs to the peripheral circulation in severe COVID-19. In agreement, histologic studies on the bone marrow have found MK proliferation during active infection.27,30 Single-cell RNA-sequencing (scRNA-seq) studies of COVID-19 peripheral blood have consistently found cell populations that are positive for MK lineage genes and whose frequencies increase with disease severity.31-34 This increase in MKs is in contrast to platelet levels, which are often decreased to near thrombocytopenic ranges in severe COVID-19.35-37 Some scRNA-seq analyses have suggested that circulating MKs contribute to COVID-19 disease through cytokine production.33,38 Yet, to our knowledge, no reports have studied circulating MKs in patients with COVID-19 beyond the transcriptomic level.
Herein, we provide the first characterization of circulating MKs in a cohort of 218 patients with COVID-19. We identify a highly pathologic subpopulation of circulating MKs that express S100A8/A9 and contain SARS-CoV-2 in the systemic circulation as well as in lung and brain autopsy tissue. The S100A8/A9+ virus–positive population displayed robust nuclear factor κB (NF-κB) activation, with the expression of proinflammatory cytokines, and we demonstrate that virus-containing MKs transfer SARS-CoV-2 antigens to emerging platelets. Lastly, the frequency of S100A8/A9+ virus–positive MKs is strongly associated with mortality and multiorgan injury in a large cohort of patients who were hospitalized with COVID-19.
Methods
Please see supplemental Methods for complete experimental details.
Peripheral blood collection and processing
Venous blood was drawn from the median cubital vein into acid citrate dextrose coated tubes under sterile conditions. Plasma was separated via centrifugation at 300g for 10 minutes. Platelet-rich plasma and buffy coat were further centrifuged at 1200g for 10 minutes, forming a cell pellet. The cell pellets were resuspended in 1 mL of 90% fetal bovine serum with 10% dimethyl sulfoxide and stored at −80°C for ≤6 months until the time of analysis. Detailed descriptions of the flow cytometry protocol, analyses, and related statistical methods are provided in the supplemental Methods.
Study population and EMR data collection
Between August 2020 and March 2021, 1961 patients who were hospitalized at University of Alabama at Birmingham (UAB) hospitals with COVID-19 and who had a positive SARS-CoV-2 polymerase chain reaction result were enrolled in the Enterprise study. Of these 1961 patients, peripheral blood was collected from 619, and 218 were included in this study. Two patients had repeated blood draw during their hospitalization. Patient demographics, past medical history, biometrics, laboratory measurements, and all clinical outcomes were obtained via electronic medical records (EMRs) from the UAB. Of the 218 patients in our cohort, only 1 patient received a single dose of vaccine before blood sample collection and flow cytometry experiments. Charlson comorbidity indices were constructed for each patient using EMR data collected before their COVID-19 encounter. Peak COVID-19 disease severity was assessed using the World Health Organization (WHO) ordinal scale across 2 time intervals: the day of sample collection and the entire inpatient stay (Table 1). Intensive care unit (ICU) admission and mechanical ventilation were determined based on admission and procedure time stamps.
Statistics
Statistical details of each experiment can be found in the figure legends, and complete statistical methods are provided in the supplemental Data.
Study approval
Written informed consent was obtained from all patients, and the study protocol was approved by the institutional review board of UAB (IRB-300006291).
Results
MKs are increased in peripheral blood in COVID-19
We started by confirming the presence of mobilized MKs in the peripheral blood of patients with COVID-19 using flow cytometry and available scRNA-seq. Using the scRNA-seq of peripheral blood mononuclear cells from a total of 69 donor samples originating from 4 separate studies,32,34,39,40 we identified a population of cells (Figure 1A) that specifically expressed MK lineage genes, including integrin subunit β3 (ITGB3; CD61), integrin subunit α2b (ITGA2B; CD41), platelet glycoprotein Ib α-chain (GP1BA; CD42b), and platelet factor 4 (PF4; Figure 1B). MK frequency in the scRNA-seq data was significantly increased in samples originating from donors with severe COVID-19 (Figure 1C).
Circulating MKs are increased in COVID-19. (A) scRNA-seq dimensionality reduction using uniform manifold approximation and projection of 317 562 cells derived from 4 separate studies. MKs (4180 cells) are shown in red. (B) scRNA-seq marker genes used to identify circulating MKs. (C) Frequency of MKs relative to all cells from scRNA-seq samples. Median ± minimum/maximum. Kruskal–Wallis one-way ANOVA with Dunn post hoc multiple comparisons test. All groups compared with uninfected control. Adjusted P value ∗∗∗P = .001 to .0001. Mild-moderate: n = 15; severe: n = 14; early recovery (<7 days after first negative polymerase chain reaction [PCR] test): n = 8; late recovery (>14 days after first negative PCR test): n = 8; uninfected: n = 19. (D) Flow cytometry from UAB COVID-19 peripheral blood samples (n = 20) showing gating of CD61+ CD41+ DNA–positive MKs. The histogram shows ploidy distribution ranging from 2n to 32n. (E) Cytocentrifugation of FACS-sorted MKs stained with hematoxylin and eosin. (F) Representative flow cytometry plots showing the proportion of MKs relative to platelets in uninfected vs COVID-19 peripheral blood. (G) Quantification of MK frequency, relative to all live events, using flow cytometry on peripheral blood from uninfected (n = 9 donors) vs COVID-19 (n = 218 patients; 220 samples). Mean ± standard error of the mean (SEM). Unpaired 2-tailed t test with Welch correction; ∗∗∗∗P < .0001. ANOVA, analysis of variance.
Circulating MKs are increased in COVID-19. (A) scRNA-seq dimensionality reduction using uniform manifold approximation and projection of 317 562 cells derived from 4 separate studies. MKs (4180 cells) are shown in red. (B) scRNA-seq marker genes used to identify circulating MKs. (C) Frequency of MKs relative to all cells from scRNA-seq samples. Median ± minimum/maximum. Kruskal–Wallis one-way ANOVA with Dunn post hoc multiple comparisons test. All groups compared with uninfected control. Adjusted P value ∗∗∗P = .001 to .0001. Mild-moderate: n = 15; severe: n = 14; early recovery (<7 days after first negative polymerase chain reaction [PCR] test): n = 8; late recovery (>14 days after first negative PCR test): n = 8; uninfected: n = 19. (D) Flow cytometry from UAB COVID-19 peripheral blood samples (n = 20) showing gating of CD61+ CD41+ DNA–positive MKs. The histogram shows ploidy distribution ranging from 2n to 32n. (E) Cytocentrifugation of FACS-sorted MKs stained with hematoxylin and eosin. (F) Representative flow cytometry plots showing the proportion of MKs relative to platelets in uninfected vs COVID-19 peripheral blood. (G) Quantification of MK frequency, relative to all live events, using flow cytometry on peripheral blood from uninfected (n = 9 donors) vs COVID-19 (n = 218 patients; 220 samples). Mean ± standard error of the mean (SEM). Unpaired 2-tailed t test with Welch correction; ∗∗∗∗P < .0001. ANOVA, analysis of variance.
Using flow cytometry, we identified the presence of circulating MKs as single CD61+ CD41+ cells that contained DNA (propidium iodide; Figure 1D). This population demonstrated a high degree of polyploidy, ranging from 2n to 32n (Figure 1D), a feature unique to MKs. Fluorescence-activated cell sorter (FACS)-sorted CD61+ CD41+ DNA+ MKs, followed by cytocentrifugation, revealed large cells ranging from 20 to 40 microns in size, with high nuclear-to-cytoplasmic ratios (Figure 1E). In contrast to samples from patients with COVID-19, blood from uninfected healthy donors contained few, if any, circulating MKs (Figure 1F), and the frequency of MKs in COVID-19 was nearly 2 magnitudes greater than that observed in uninfected controls (Figure 1G).
Circulating MKs express S100A8/A9 in COVID-19
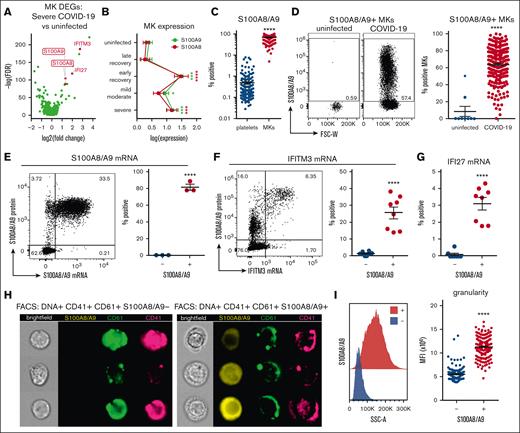
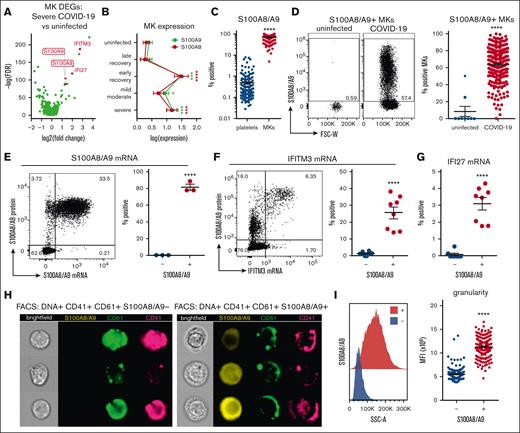
We used the scRNA-seq data from Figure 1 to identify markers of potential pathologic MK subsets in severe disease. Differential gene expression analysis comparing MKs in severe COVID-19 vs uninfected healthy controls revealed robust upregulation of both subunits of calprotectin, S100A8 and S100A9 (Figure 2A). Because S100A8/A9 are typically associated with granulocytes and classical monocytes, we stained for circulating MKs and included antibodies to CD66b and CD14, markers of granulocytes and classical monocytes, respectively, to exclude the possibility of false positives from platelet/immune cell doublets. Circulating MKs were tested negative for both CD66b and CD14 via flow cytometry (supplemental Figure 6A), and scRNA-seq showed that circulating MKs lacked expression of neutrophil and classical monocyte markers (supplemental Figure 6B). In addition to S100A8/A9, MKs in severe COVID-19 displayed strong type 1 interferon signatures with upregulation of IFITM3 and IFI27 (Figure 2A). Examining S100A8 and S100A9 expression in MKs across the entire scRNA-seq cohort revealed an upregulation during active infection and into early recovery (<7 days after first negative polymerase chain reaction result), which reduced to baseline levels at later recovery stages (>7 days; Figure 2B).
Circulating MKs upregulate S100A8/A9 in COVID-19. (A) Volcano plot showing 1436 DEGs from scRNA-seq of MKs from severe COVID-19 vs uninfected controls. (B) Expression of S100A8 and S100A9 in MKs from scRNA-seq samples. Two-way ANOVA with Dunnett post hoc multiple comparisons test. All groups compared with uninfected controls. Adjusted P values: ∗P = .05 to .01; ∗∗P = .01 to .001; ∗∗∗P = .001 to .0001; ∗∗∗∗P < .0001. Black asterisks indicate S100A9 statistical comparisons. Red asterisks = S100A8 statistical comparisons. Severe: n = 14; mild-moderate: n = 15; early recovery (<7 days after first negative PCR test): n = 7; late recovery (>14 days after first negative PCR test): n = 5; uninfected: n = 16. (C) Flow cytometry quantification of S100A8/A9 expression in platelets vs MKs (n = 218 patients; 220 samples). Unpaired 2-tailed t test; ∗∗∗∗P < .0001. (D) Flow cytometry plots and quantification of S100A8/A9 expression in circulating MKs from uninfected controls (n = 9 donors) vs COVID-19 (n = 218 patients; 220 samples). Unpaired 2-tailed t test; ∗∗∗∗P < .0001. (E) PrimeFlow flow cytometry showing S100A8/A9 messenger RNA (mRNA) expression by S100A8/A9 protein expression in COVID-19 MKs. Quantification of S100A8/A9 mRNA expression in S100A8/A9+ MKs vs S100A8/A9− MKs (n = 3 donors). Unpaired 2-tailed t test; ∗∗∗∗P < .0001. (F) PrimeFlow flow cytometry showing IFITM3 mRNA expression by S100A8/A9 protein expression in COVID-19 MKs. Quantification of IFITM3 mRNA expression in S100A8/A9+ MKs vs S100A8/A9− MKs (n = 8 donors). Unpaired 2-tailed t test; ∗∗∗∗P < .0001. (G) Quantification of PrimeFlow IFI27 mRNA expression in S100A8/A9+ MKs vs S100A8/A9− MKs (n = 8 donors). Unpaired 2-tailed t test; ∗∗∗∗P < .0001. (H) Representative imaging flow cytometry from FACS-sorted S100A8/A9+ MKs vs S100A8/A9− MKs. (I) Histogram showing SSC-A granularity in S100A8/A9+ MKs vs S100A8/A9− MKs and quantification of SSC-A granularity in S100A8/A9+ MKs vs S100A8/A9− MKs (n = 218 patients; 220 samples). Unpaired 2-tailed t test; ∗∗∗∗P < .0001. All graphs are mean ± SEM. DEGs, differentially expressed genes.
Circulating MKs upregulate S100A8/A9 in COVID-19. (A) Volcano plot showing 1436 DEGs from scRNA-seq of MKs from severe COVID-19 vs uninfected controls. (B) Expression of S100A8 and S100A9 in MKs from scRNA-seq samples. Two-way ANOVA with Dunnett post hoc multiple comparisons test. All groups compared with uninfected controls. Adjusted P values: ∗P = .05 to .01; ∗∗P = .01 to .001; ∗∗∗P = .001 to .0001; ∗∗∗∗P < .0001. Black asterisks indicate S100A9 statistical comparisons. Red asterisks = S100A8 statistical comparisons. Severe: n = 14; mild-moderate: n = 15; early recovery (<7 days after first negative PCR test): n = 7; late recovery (>14 days after first negative PCR test): n = 5; uninfected: n = 16. (C) Flow cytometry quantification of S100A8/A9 expression in platelets vs MKs (n = 218 patients; 220 samples). Unpaired 2-tailed t test; ∗∗∗∗P < .0001. (D) Flow cytometry plots and quantification of S100A8/A9 expression in circulating MKs from uninfected controls (n = 9 donors) vs COVID-19 (n = 218 patients; 220 samples). Unpaired 2-tailed t test; ∗∗∗∗P < .0001. (E) PrimeFlow flow cytometry showing S100A8/A9 messenger RNA (mRNA) expression by S100A8/A9 protein expression in COVID-19 MKs. Quantification of S100A8/A9 mRNA expression in S100A8/A9+ MKs vs S100A8/A9− MKs (n = 3 donors). Unpaired 2-tailed t test; ∗∗∗∗P < .0001. (F) PrimeFlow flow cytometry showing IFITM3 mRNA expression by S100A8/A9 protein expression in COVID-19 MKs. Quantification of IFITM3 mRNA expression in S100A8/A9+ MKs vs S100A8/A9− MKs (n = 8 donors). Unpaired 2-tailed t test; ∗∗∗∗P < .0001. (G) Quantification of PrimeFlow IFI27 mRNA expression in S100A8/A9+ MKs vs S100A8/A9− MKs (n = 8 donors). Unpaired 2-tailed t test; ∗∗∗∗P < .0001. (H) Representative imaging flow cytometry from FACS-sorted S100A8/A9+ MKs vs S100A8/A9− MKs. (I) Histogram showing SSC-A granularity in S100A8/A9+ MKs vs S100A8/A9− MKs and quantification of SSC-A granularity in S100A8/A9+ MKs vs S100A8/A9− MKs (n = 218 patients; 220 samples). Unpaired 2-tailed t test; ∗∗∗∗P < .0001. All graphs are mean ± SEM. DEGs, differentially expressed genes.
Flow cytometry of peripheral blood from 220 COVID-19 samples revealed a robust expression of S100A8/A9 in MKs (mean, 68.9% positive) compared with a low expression in platelets (mean, 0.480% positive; Figure 2C), providing additional evidence that the MK lineage cells frequently observed in COVID-19 scRNA-seq are MKs and not platelets. Flow cytometry comparison of S100A8/A9 expression in circulating MKs from uninfected controls vs COVID-19 donors helped confirm that S100A8/A9 was highly upregulated in COVID-19 MKs (Figure 2D). Using in situ hybridization via flow cytometry (PrimeFlow), we demonstrated that the vast majority of MKs tested positive for S100A8/A9 protein are also positive for S100A8/A9 messenger RNA (Figure 2E), confirming that MKs in COVID-19 synthesize S100A8/A9. Using PrimeFlow, we further showed that the S100A8/A9+ MKs also expressed IFITM3 (Figure 2F) and IFI27 (Figure 2G), 2 additional genes that are unique to MKs from severe COVID-19 (Figure 2A). Lastly, we FACS-sorted S100A8/A9+ and S100A8/A9− MKs and performed imaging flow cytometry. S100A8/A9 was absent in the population that was tested negative and strongly expressed in the cytoplasm in those tested positive(Figure 2H). The cytoplasm in the S100A8/A9+ population appeared highly granular (Figure 2H) with significantly elevated side scatter (Figure 2I), consistent with S100A8/A9 packaging in granules, successfully isolating the pathologic subset of MKs in COVID-19.
A subpopulation of S100A8/A9+ MKs contain SARS-CoV-2
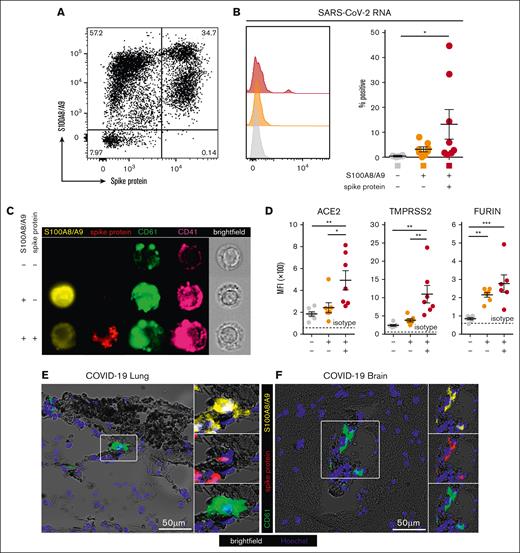
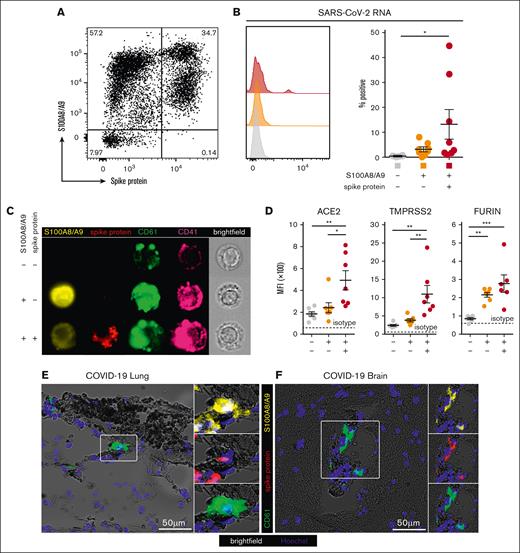
Next, we hypothesized that S100A8/A9+ MKs may contain SARS-CoV-2. Using an antibody specific to the SARS-CoV-2 spike protein, a subpopulation of S100A8/A9+ MKs that contained the viral antigen was identified, leading to 3 discrete MK populations: S100A8/A9− virus–negative, S100A8/A9+ virus–negative-, and S100A8/A9+ virus–positive (Figure 3A). SARS-CoV-2–containing MKs appeared in variable frequencies across our COVID-19 cohort, and virus–positive MKs that lacked S100A8/A9 expression were not observed. PrimeFlow analysis targeting SARS-CoV-2 RNA revealed a significant increase in viral RNA specifically in the spike protein–positive population (Figure 3B). Using imaging flow cytometry on the 3 FACS-sorted MK populations, we found that spike protein was specific to the virus–positive population and was largely restricted to the perinuclear space, consistent with SARS-CoV-2 assembly in the endoplasmic reticulum (Figure 3C).
A subpopulation of S100A8/A9+ MKs contain SARS-CoV-2. (A) Representative flow cytometry plot of circulating MKs showing 3 distinct subpopulations: S100A8/A9− spike protein–negative, S100A8/A9+ spike protein–negative, and S100A8/A9+ spike protein–positive. (B) Histogram showing PrimeFlow flow cytometry for SARS-CoV-2 RNA in circulating MKs. Quantification of SARS-CoV-2 RNA in the 3 MK subpopulations (n = 8 donors). One-way ANOVA with Tukey post hoc multiple comparisons test; adjusted P value is ∗P = .05 to .01 (C) Representative imaging flow cytometry from FACS-sorted MKs: S100A8/A9− spike protein–negative, S100A8/A9+ spike protein–negative, and S100A8/A9+ spike protein–positive. (D) Expression of proteins involved in SARS-CoV-2 viral infection in the 3 MK subpopulations (n = 7 donors). Mean fluorescent intensity of ACE2, TMPRSS2, and FURIN. Dashed lines represent the geometric mean for isotype controls. One-way ANOVA with Tukey post hoc multiple comparisons test; ∗P = .05 to .01; ∗∗P = .01 to .001; ∗∗∗P = .001 to .0001. (E) Immunofluorescence staining of lung tissue from a deceased patient who had COVID-19 with ARDS. (F) Immunofluorescence staining of brain tissue (cortex) from a deceased patient who had COVID-19. Five channels are shown in panels E-F: brightfield (black pigment from TrueView autofluorescence quencher), green (CD61), yellow (S100A8/A9), red (spike protein), and blue (Hoechst). All graphs are mean ± SEM. TMPRSS2, transmembrane protease serine 2.
A subpopulation of S100A8/A9+ MKs contain SARS-CoV-2. (A) Representative flow cytometry plot of circulating MKs showing 3 distinct subpopulations: S100A8/A9− spike protein–negative, S100A8/A9+ spike protein–negative, and S100A8/A9+ spike protein–positive. (B) Histogram showing PrimeFlow flow cytometry for SARS-CoV-2 RNA in circulating MKs. Quantification of SARS-CoV-2 RNA in the 3 MK subpopulations (n = 8 donors). One-way ANOVA with Tukey post hoc multiple comparisons test; adjusted P value is ∗P = .05 to .01 (C) Representative imaging flow cytometry from FACS-sorted MKs: S100A8/A9− spike protein–negative, S100A8/A9+ spike protein–negative, and S100A8/A9+ spike protein–positive. (D) Expression of proteins involved in SARS-CoV-2 viral infection in the 3 MK subpopulations (n = 7 donors). Mean fluorescent intensity of ACE2, TMPRSS2, and FURIN. Dashed lines represent the geometric mean for isotype controls. One-way ANOVA with Tukey post hoc multiple comparisons test; ∗P = .05 to .01; ∗∗P = .01 to .001; ∗∗∗P = .001 to .0001. (E) Immunofluorescence staining of lung tissue from a deceased patient who had COVID-19 with ARDS. (F) Immunofluorescence staining of brain tissue (cortex) from a deceased patient who had COVID-19. Five channels are shown in panels E-F: brightfield (black pigment from TrueView autofluorescence quencher), green (CD61), yellow (S100A8/A9), red (spike protein), and blue (Hoechst). All graphs are mean ± SEM. TMPRSS2, transmembrane protease serine 2.
The expression of proteins involved in SARS-CoV-2 infection were analyzed across the 3 MK populations, including angiotensin-converting enzyme 2 (ACE2), transmembrane protease serine 2, and FURIN. ACE2 and transmembrane protease serine 2 were specifically and significantly increased in the S100A8/A9+ virus–positive MKs, whereas FURIN was significantly upregulated in both S100A8/A9+ populations (Figure 3D).
Autopsy tissue from deceased donors who had COVID-19 was used to determine whether S100A8/A9+ virus–positive MKs were present outside of the systemic circulation. Because the lungs are the primary site of infection, we reasoned that MKs in the lungs of patients with COVID-19 would have a high probability of containing the virus. Consistent with this notion, S100A8/A9+ spike protein–positive MKs were present in the lungs of a COVID-19 donors with confirmed acute respiratory distress syndrome (ARDS) (Figure 3E). MKs were recently shown to plug cortical capillaries in patients with COVID-19 with neurologic symptoms.26 Next, we analyzed brain tissue from 8 different donors with COVID-19, and in the cortex of 1 of the donors we observed S100A8/A9+ spike protein–positive MKs within larger caliber blood vessels (Figure 3F).
SARS-CoV-2–containing MKs transfer viral antigens to emerging platelets
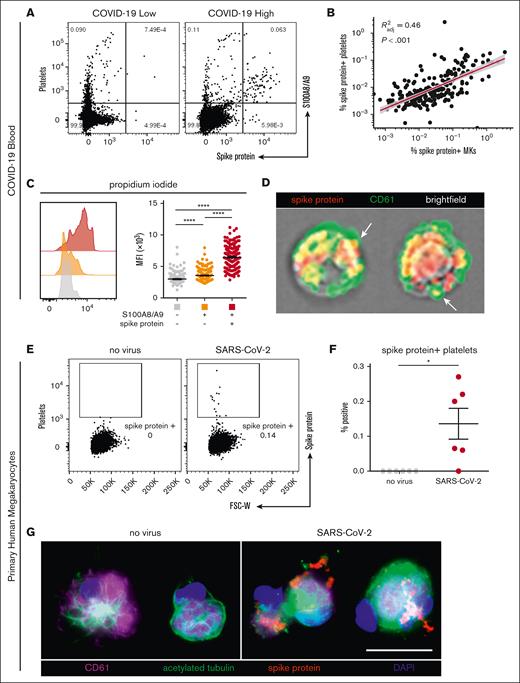
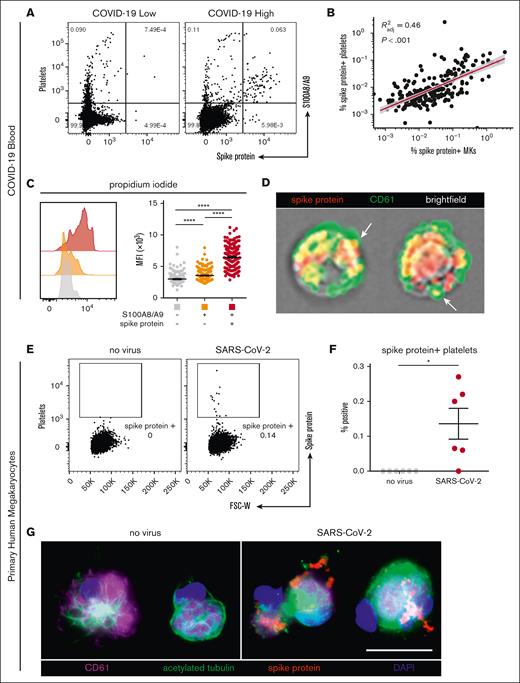
In our cohort with COVID-19, a low and heterogenous frequency of platelets containing viral antigen (Figure 4A) was observed, which has previously been reported by other groups.15,18 Interestingly, we found a strong positive correlation between virus–positive platelets and virus–positive MKs (R2 = 0.46; P < .001; Figure 4B), suggesting that SARS-CoV-2–containing platelets may be derived from virus–positive MKs. Consistent with this hypothesis, virus–positive MKs displayed a striking and highly significant increase in ploidy (Figure 4C), a sign of MK maturation that is associated with platelet production. Moreover, using imaging flow cytometry, we found the presence of spike protein in emerging proplatelets on virus–positive MKs (Figure 4D).
SARS-CoV-2–containing MKs transfer viral antigen to platelets. (A) Representative flow cytometry plots of platelets from patients with COVID-19 with high and low virus–positive proportions. (B) Linear regression comparing virus–positive MK frequencies to virus–positive platelet frequencies (n = 218 patients; 220 samples). (C) DNA content analysis in circulating MKs using propidium iodide and RNase treatment. Quantification of DNA content in the 3 MK subpopulations (n = 218 patients; 220 samples). One-way ANOVA with Tukey post hoc multiple comparisons test; adjusted P value is ∗∗∗∗P < .0001. (D) Imaging flow cytometry of virus–positive MKs. White arrows indicate viral protein in emerging platelets. (E) Flow cytometry plots of platelets from primary human MKs infected with SARS-CoV-2 showing spike protein–containing platelets. (F) Quantification of virus+ platelets from primary human MKs (n = 6 cultures). Unpaired two-tailed t test; ∗P = .05 to .01. (G) Immunofluorescence of primary human MKs infected with SARS-CoV-2. Four channels are shown: CD61 (purple), acetylated tubulin (green), spike protein (red), and 4′,6-diamidino-2-phenylindole (DAPI; blue). All graphs show mean ± SEM.
SARS-CoV-2–containing MKs transfer viral antigen to platelets. (A) Representative flow cytometry plots of platelets from patients with COVID-19 with high and low virus–positive proportions. (B) Linear regression comparing virus–positive MK frequencies to virus–positive platelet frequencies (n = 218 patients; 220 samples). (C) DNA content analysis in circulating MKs using propidium iodide and RNase treatment. Quantification of DNA content in the 3 MK subpopulations (n = 218 patients; 220 samples). One-way ANOVA with Tukey post hoc multiple comparisons test; adjusted P value is ∗∗∗∗P < .0001. (D) Imaging flow cytometry of virus–positive MKs. White arrows indicate viral protein in emerging platelets. (E) Flow cytometry plots of platelets from primary human MKs infected with SARS-CoV-2 showing spike protein–containing platelets. (F) Quantification of virus+ platelets from primary human MKs (n = 6 cultures). Unpaired two-tailed t test; ∗P = .05 to .01. (G) Immunofluorescence of primary human MKs infected with SARS-CoV-2. Four channels are shown: CD61 (purple), acetylated tubulin (green), spike protein (red), and 4′,6-diamidino-2-phenylindole (DAPI; blue). All graphs show mean ± SEM.
To explore whether MKs are capable of transferring virus/viral antigen to platelets, we generated primary human MKs from CD34+ cord blood cells, enriched the MKs to ∼95% purity, and infected them with SARS-CoV-2 (WA-1 strain). After removal of the inoculant, we plated the MKs in tissue culture–treated wells and stimulated the cells with phorbol myristate acetate to induce platelet production. Platelets from the infected cultures contained a low level of spike protein (Figure 4E), which was entirely absent from the uninfected control cultures (Figure 4F). In agreement, viral antigen was detectable in acetylated-tubulin–positive proplatelet extensions from SARS-CoV-2–infected MKs, which was absent in uninfected controls (Figure 4G), suggesting that virus–positive MKs are capable of transferring SARS-CoV-2 antigen, and possibly whole virus, to emerging platelets.
SARS-CoV-2–containing MKs produce NF-κB-mediated cytokines and display a hyperactivated phenotype
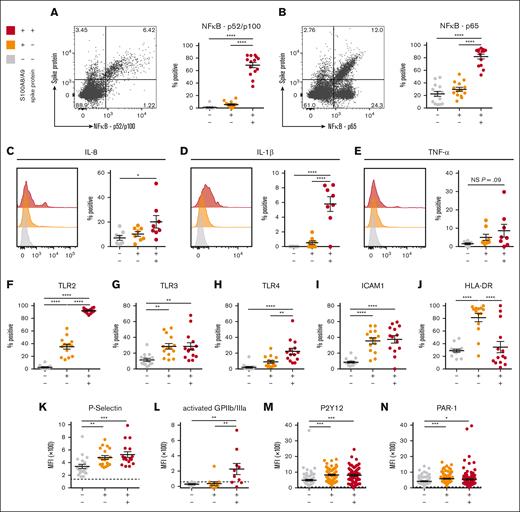
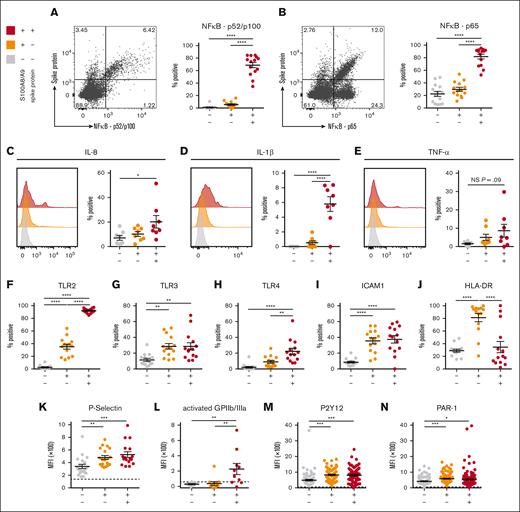
To determine whether SARS-CoV-2–containing MKs contribute to COVID-19 inflammation, we probed inflammatory signaling pathways across the 3 circulating MK populations. A robust and significant upregulation of the NF-κB subunits p52/p100 (Figure 5A) and p65 (Figure 5B) was found specifically in the virus–positive MKs. Given the strong NF-κB signature, expression of NF-κB-mediated cytokines, interleukin-8 (IL-8), IL-1β, and tumor necrosis factor α was measured across the 3 circulating MK populations. In agreement, only the virus–positive MKs displayed a significant upregulation of IL-8 (Figure 5C) and IL-1β (Figure 5D) and a trend toward increased tumor necrosis factor α (P = .09; Figure 5E).
SARS-CoV-2–containing MKs produce NF-κB-mediated cytokines and have a hyperactivated phenotype. (A) Flow cytometry plot of circulating MKs showing expression of NF-κB subunit p65. Quantification of p65 expression in the 3 MK subpopulations (n = 14 donors). (B) Flow cytometry plot of circulating MKs showing expression of NF-κB subunit p52/p100. Quantification of p52/p100 expression in the 3 MK subpopulations (n = 14 donors). (C-E) Histograms and accompanying quantification of PrimeFlow flow cytometry for cytokines in circulating MKs. (C) IL-6 (n = 8 donors), (D) IL-1β (n = 8 donors), and (E) TNF-α (n = 8 donors). (F-J) Percent positive quantification for immunomodulatory proteins from flow cytometry on circulating MKs (n = 14 donors), (F) TLR2, (G) TLR3, (H) TLR4, (I) ICAM1, and (J) HLA-DR. (K-N) Mean fluorescent intensity quantification of (K-L) MK activation markers and (M-N) MK drug targets. (K) P-selectin (n = 20 donors), (L) activated GPIIb/IIIa (n = 11 donors), (M) P2Y12 (n = 82 donors), and (N) PAR-1 (n = 138 donors). Dashed lines in panels K-N represent the geometric mean for the respective isotype control. Percent positive graphs for antibody-based stains in panels A-B,F-J represent percent positive relative to the respective isotype control. All statistical analyses were performed using one-way ANOVA with Tukey post hoc multiple comparisons test. All graphs are given as mean ± SEM. Adjusted P values are ∗P = .05 to .01; ∗∗P = .01 to .001; ∗∗∗P = .001 to .0001; ∗∗∗∗P < .0001. TNF-α, tumor necrosis factor α.
SARS-CoV-2–containing MKs produce NF-κB-mediated cytokines and have a hyperactivated phenotype. (A) Flow cytometry plot of circulating MKs showing expression of NF-κB subunit p65. Quantification of p65 expression in the 3 MK subpopulations (n = 14 donors). (B) Flow cytometry plot of circulating MKs showing expression of NF-κB subunit p52/p100. Quantification of p52/p100 expression in the 3 MK subpopulations (n = 14 donors). (C-E) Histograms and accompanying quantification of PrimeFlow flow cytometry for cytokines in circulating MKs. (C) IL-6 (n = 8 donors), (D) IL-1β (n = 8 donors), and (E) TNF-α (n = 8 donors). (F-J) Percent positive quantification for immunomodulatory proteins from flow cytometry on circulating MKs (n = 14 donors), (F) TLR2, (G) TLR3, (H) TLR4, (I) ICAM1, and (J) HLA-DR. (K-N) Mean fluorescent intensity quantification of (K-L) MK activation markers and (M-N) MK drug targets. (K) P-selectin (n = 20 donors), (L) activated GPIIb/IIIa (n = 11 donors), (M) P2Y12 (n = 82 donors), and (N) PAR-1 (n = 138 donors). Dashed lines in panels K-N represent the geometric mean for the respective isotype control. Percent positive graphs for antibody-based stains in panels A-B,F-J represent percent positive relative to the respective isotype control. All statistical analyses were performed using one-way ANOVA with Tukey post hoc multiple comparisons test. All graphs are given as mean ± SEM. Adjusted P values are ∗P = .05 to .01; ∗∗P = .01 to .001; ∗∗∗P = .001 to .0001; ∗∗∗∗P < .0001. TNF-α, tumor necrosis factor α.
The expression of TLRs TLR2, TLR3, and TLR4, all 3 of which are known to drive NF-κB activation, was examined. TLR2 was significantly upregulated in both S100A8/A9+ populations but was dramatically higher in virus–positive MKs compared with S100A8/A9+ virus–negative MKs (Figure 5F). TLR3 was equally upregulated in both S100A8/A9+ populations (Figure 5G). TLR4 was specifically upregulated in only the virus–positive MKs (Figure 5H). Similar to TLR3, ICAM1 was equally upregulated in both S100A8/A9+ populations (Figure 5I). HLA-DR showed a unique expression pattern with significant upregulation only in the S100A8/A9+ virus–negative population (Figure 5J), potentially suggesting a role for antigen presentation in this subset of MKs.
MK-specific activation markers were quantified across the 3 subsets. P-selectin, a marker of degranulation and an adhesion protein involved in vascular tethering during thrombosis, was equally upregulated in both S100A8/A9+ populations (Figure 5K). Activated GPIIb/IIIa, a marker of thrombin/adenosine 5′-diphosphate activation and a receptor that binds fibrinogen and von Willebrand factor during thrombosis, was specifically and significantly increased in the virus–positive MKs (Figure 5L). Lastly, the expression of antiplatelet drug targets, P2Y12 and PAR-1, was investigated as potential therapeutic options for modulating hyperactivated MKs. Both P2Y12 (Figure 5M) and PAR-1 (Figure 5N) were significantly and equally increased in both S100A8/A9+ populations of MKs. Together, these data suggest that virus–positive MKs display an NF-κB–mediated inflammatory signature, are hyperactivated, and potentially prone to thrombosis.
SARS-CoV-2–containing MKs are associated with mortality and multiorgan injury
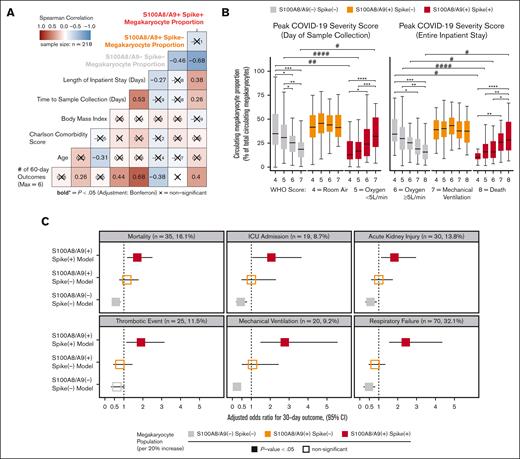
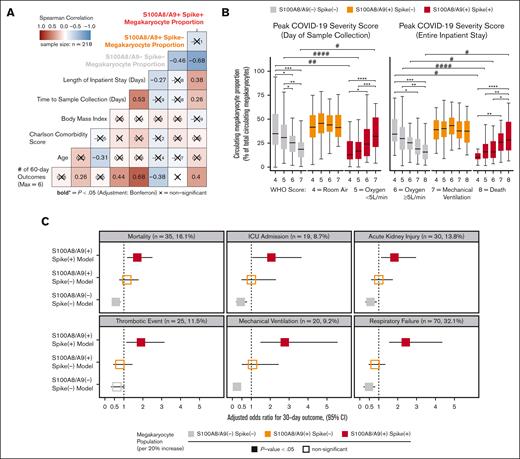
Next, we sought to understand the clinical significance of circulating MKs in COVID-19 by integrating EMR data with flow cytometry measurements in cryopreserved blood. Peripheral blood was collected from 218 patients who were fully unvaccinated and with COVID-19+ who were admitted to the UAB hospital from fall 2020 through spring 2021. The mean patient age was 61 ± 13 years (± standard deviation); 58% were male; the mean body mass index was 34 ± 10; the mean Charlson comorbidity score was 2.8 ± 2.1; and the average time to sample collection, relative to admission, was 5.9 ± 3.5 days (Table 1). COVID-19 disease severity was computed on the day of sample collection using the WHO 8-point ordinal scale (Table1). Using Spearman correlation analysis, we observed a statistically significant association with increased length of hospital stay and cumulative 60-day adverse outcomes with the S100A8/A9+ virus–positive MK proportion (Figure 6A). Conversely, we found that the S100A8/A9− virus–negative MK proportion had the opposite correlation with the length of stay and cumulative adverse outcomes (Figure 6A). Next, we compared the relative frequencies of the 3 MK subpopulations with each donor’s peak COVID-19 WHO severity score at 2 time points: (1) day of sample collection (Figure 6B, left) and (2) entire inpatient stay (Figure 6B). We found that the COVID-19 severity scores at both time intervals were directly proportional to the frequency of S100A8/A9+ virus–positive MKs (Figure 6B) and inversely proportional to the S100A8/A9− virus–negative MKs (Figure 6B). Conversely, S100A8/A9+ virus–negative MKs remained constant with respect to severity scores (Figure 6B).
SARS-CoV-2–containing MKs are associated with mortality and severe adverse events in COVID-19. (A) Spearman correlation analysis of continuous candidate model variables and cumulative 60-day postadmission outcomes for each patient (respiratory failure, mechanical ventilation, acute kidney injury, thrombotic events, ICU admission, and death). Each patient was limited to the first occurrence of a given outcome, resulting in a cumulative outcome maximum of 6. Statistical significance was assessed using Spearman correlation with Bonferroni P value adjustment for multiple hypothesis testing between candidate variables (X = nonsignificant; bold text, P value < .05). (B) Analyses comparing the WHO scale of COVID-19 severity on the day of sample collection (left) and peak severity during the entire inpatient stay (right) vs the circulating MK frequency for each subpopulation (∗ indicates intragroup and # indicates intergroup; ∗/# = 0.05-0.01, ∗∗/## = 0.01-0.001, ∗∗∗/### = 0.001-0.0001, ∗∗∗∗/#### < 0.0001). (C) Multivariate logistic regression models showing the likelihood of selected 30-day outcomes per 20% increase in each MK subpopulation (3 models per outcome; age, body mass index, and preadmission Charlson comorbidity score covariables not shown). Bootstrapped 95% CIs (n = 1000 bootstraps) are denoted as a bar to the right and left of each corresponding adjusted OR square. Event rates for each outcome are shown above each set of models. Statistical significance was assessed using the Wald test and is denoted by solid or open squares. Outcomes were determined using ICD-10 billing codes from each patient encounter. See supplemental Table 1 and supplemental Figures 8-10 for a complete breakdown of outcome billing codes and supplemental Tables 2-4 for regression model details.
SARS-CoV-2–containing MKs are associated with mortality and severe adverse events in COVID-19. (A) Spearman correlation analysis of continuous candidate model variables and cumulative 60-day postadmission outcomes for each patient (respiratory failure, mechanical ventilation, acute kidney injury, thrombotic events, ICU admission, and death). Each patient was limited to the first occurrence of a given outcome, resulting in a cumulative outcome maximum of 6. Statistical significance was assessed using Spearman correlation with Bonferroni P value adjustment for multiple hypothesis testing between candidate variables (X = nonsignificant; bold text, P value < .05). (B) Analyses comparing the WHO scale of COVID-19 severity on the day of sample collection (left) and peak severity during the entire inpatient stay (right) vs the circulating MK frequency for each subpopulation (∗ indicates intragroup and # indicates intergroup; ∗/# = 0.05-0.01, ∗∗/## = 0.01-0.001, ∗∗∗/### = 0.001-0.0001, ∗∗∗∗/#### < 0.0001). (C) Multivariate logistic regression models showing the likelihood of selected 30-day outcomes per 20% increase in each MK subpopulation (3 models per outcome; age, body mass index, and preadmission Charlson comorbidity score covariables not shown). Bootstrapped 95% CIs (n = 1000 bootstraps) are denoted as a bar to the right and left of each corresponding adjusted OR square. Event rates for each outcome are shown above each set of models. Statistical significance was assessed using the Wald test and is denoted by solid or open squares. Outcomes were determined using ICD-10 billing codes from each patient encounter. See supplemental Table 1 and supplemental Figures 8-10 for a complete breakdown of outcome billing codes and supplemental Tables 2-4 for regression model details.
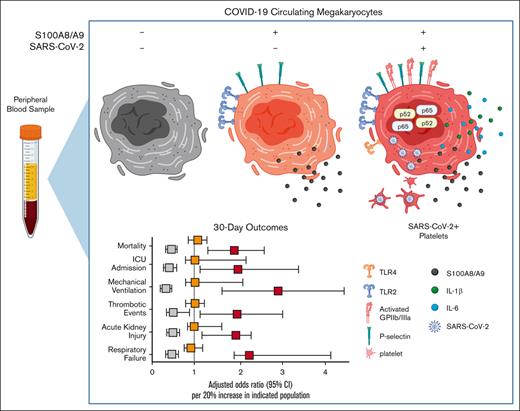
Lastly, we investigated the association between circulating MKs and COVID-19 adverse events with a multivariate logistic regression model, controlling for age, body mass index, and preadmission comorbidity score. Using ICD-10 billing code data for respiratory failure, mechanical ventilation, acute kidney injury (AKI), thrombotic events, ICU admission, and all-cause mortality, we evaluated MK frequencies as a continuous variable in the 30-day outcome window. For every 20% increase in S100A8/A9+ virus–positive MKs, we observed increased adjusted odds ratios (ORs) for each outcome: respiratory failure (OR, 2.42; 95% confidence interval [CI], 1.55-4.36; P < .001), mechanical ventilation (OR, 2.75; 95% CI, 1.48-5.56; P < .001), AKI, (OR, 1.82; 95% CI, 1.12-2.96; P = .01), thrombotic events (OR, 1.91; 95% CI, 1.13-3.15; P = .012), ICU admission (OR, 2.05; 95% CI, 1.05-3.64; P = .011), and all-cause mortality (OR, 1.71; 95% CI, 1.18-2.51; P = .005) (Figure 6C). A 20% increase in S100A8/A9− virus–negative MKs was found to be protective, with lower ORs for each 30-day outcome, with the exception of thrombosis: respiratory failure (OR, 0.48; 95% CI, 0.19-0.80; P = .006), mechanical ventilation (OR, 0.23; 95% CI, 0.08-0.45; P < .001), AKI (OR, 0.56; 95% CI, 0.29-0.89; P = .010), thrombotic events (OR, 0.63; 95% CI, 0.32-1.02; P = .064), ICU admission (OR, 0.43; 95% CI, 0.19-0.76; P = .002), and all-cause mortality (OR 0.57, 95% CI, 0.37-0.81; P = .004) (Figure 6C). Again, no statistically significant associations were found for S100A8/A9+ virus–negative MKs (Figure 6C). The positive association with inpatient length of stay, greater COVID-19 severity, and increased adverse event rates strongly suggests that virus-containing MKs play an important role in severe SARS-CoV-2 infection.
Discussion
The main findings of this study include the identification of a unique subpopulation of MKs that is strongly associated with mortality and adverse events in patients hospitalized with COVID-19. We demonstrate that DNA-positive CD41+ CD61+ MK cells are polyploid, ∼100-fold more frequent in individuals with COVID-19 than in uninfected controls and occasionally have proplatelet protrusions. The defining marker of COVID-19 MKs, S100A8/A9, is expressed by nearly 70% of all circulating MKs and by <1% of circulating platelets in donors with COVID-19. In addition, we provide evidence demonstrating that infected MKs can vertically transfer SARS-CoV-2 antigens to emerging platelets. Mechanistically, we demonstrate that S100A8/A9+ virus–positive MKs display strong NF-κB activation, and we found that only the virus–positive MKs produced significantly increased levels of NF-κB-mediated cytokines, IL-8 and IL-1β.
Despite the relatively small number of reports focusing on MKs in COVID-19, these cells have appeared in surprisingly high frequencies in untargeted COVID-19 studies. In autopsy case series, MKs are hyperproliferative in the bone marrow and have been found in numerous diseased organs during acute infection.23-29 scRNA-seq studies on peripheral blood of patients with COVID-19 have consistently found rare cell populations that are positive for MK lineage genes and whose frequencies directly correlate with disease severity.31-34,38 Many scRNA-seq studies have annotated these cells as platelets, despite a lack of confirmatory evidence as well as technical concerns regarding the ability of droplet-based scRNA-seq to detect individual platelets, which contain at least a 1000 times less messenger RNA than an average leukocyte.41 For this reason, there have been no published studies, to date, using droplet-based scRNA-seq on confirmed, highly purified platelets.42,43 Even for platelet aggregates, hundreds to a few thousand platelets in a single droplet would be expected to be required to reach the observed average of 2566 transcripts per cell for the MK cluster.
One potential explanation for why MKs are increased in the peripheral circulation in COVID-19 is that the reduction in circulating platelets during severe infection elicits emergency megakaryopoiesis as a compensatory mechanism to maintain platelet levels. In agreement, acute inflammation is known to induce megakaryopoiesis,44 and autopsy case series on bone marrow from patients with COVID-19 have confirmed the hematopoietic expansion of MKs.27,30 Furthermore, it is known that at least 50% of all platelets are derived from circulating MKs within the pulmonary microvasculature.1 Thus, emergency megakaryopoiesis would be expected to increase the mobilization of MKs to the pulmonary circulation for platelet production, as has been observed in experimental bacterial pneumonia.1 In healthy physiological conditions, the pulmonary microvasculature limits MKs from entering the peripheral circulation.4-6 In COVID-19, this mechanism is likely compromised because of pulmonary damage, potentially leading to MK escape into the peripheral circulation, as has been observed in other diseases of the lung.9
Of the S100A8/A9-expressing MKs, we isolated a subpopulation that contain SARS-CoV-2 protein and RNA, suggestive of active viral infection. Our group is not the first to provide evidence that SARS-CoV-2 is capable of infecting MKs. At least 2 autopsy case series on bone marrow from patients with COVID-19 have found the presence of SARS-CoV-2 in MKs.27,45 At least 1 other study demonstrated in vitro infectivity of primary human MKs,46 and 2 reports have shown infectivity of immortalized human megakaryoblastic leukemia cells (MEG-01).46,47 Importantly, a recent study similarly demonstrated SARS-CoV-2+ MKs in bronchoalveolar fluid of patients with severe COVID-19.48 However, to our knowledge, we are the first to show SARS-CoV-2 in peripheral MKs in COVID-19. Moreover, at least 1 other virus, dengue virus, is known to infect MKs.49-51 Interestingly, both infections are associated with thrombosis, thrombocytopenia, and platelet hyperactivation.
Several research groups have demonstrated the presence of SARS-CoV-2 in platelets, yet how platelets obtain SARS-CoV-2 remains an area of active debate. Some reports have suggested that platelets acquire the virus through canonical ACE2-mediated entry, whereas others have shown that SARS-CoV-2 is endocytosed as complexes with other molecules in an ACE2-independent manner.15,18,47,52,53 Here, we provide the first evidence suggesting that virus-containing platelets can also originate from virus–positive MKs. This finding is not surprising given that, during thrombopoiesis, MKs transfer cytoplasm and organelles to platelets.54 Moreover, the endoplasmic reticulum, in which SARS-CoV-2 replicates, physically interacts with the demarcation membrane system in MKs, which forms the cell membranes of platelets.55 However, a limitation of our study is that we did not assess platelet-derived viral expansion in permissive cells. Therefore, we cannot rule out the possibility that MKs transferred only viral antigen, as opposed to active virus, to emerging platelets. Nonetheless, it remains to be seen which of these mechanisms, or combination thereof, is the predominant means of viral acquisition by platelets in COVID-19.
Several recent publications have indicated that NF-κB signaling differentiates severe from mild/moderate COVID-19, and our results suggest that this theme extends to circulating MKs.56,57 Signaling through TLR2, TLR3, and/or TLR4 are plausible explanations for the observed NF-κB upregulation in virus–positive MKs. TLR2 and TLR4 are particularly intriguing because both are canonical drivers of NF-κB activation, virus–positive MKs specifically express high levels of both receptors, and the bacterial ligands for each are increased in severe COVID-19.39,58 TLR3, which binds double-stranded viral RNA, can also signal through NF-κB but predominantly uses IRF3/STAT1. Because S100A8/A9+ MKs display a universal interferon signature (IFITM3 and IFI27), TLR3 signaling seems less likely to explain the specific NF-κB activation observed in virus–positive MKs. Other receptors beyond TLRs also likely contribute to NF-κB activation in virus–positive MKs because this is a common target of many inflammatory pathways.
Lastly, we investigated the clinical significance of circulating MKs in a cohort of 218 inpatients with COVID-19. Using Spearman correlation analysis, we found statistically significant correlations between S100A8/A9+ virus–positive MK proportion, cumulative 60-day adverse events, and inpatient length of stay. Similarly, using the WHO ordinal scale of COVID-19 severity, we found strong stepwise correlations with circulating MKs, with virus–positive MKs directly correlated with severity, and S100A8/A9− MKs inversely correlated with severity. Using a more stringent 30-day adverse event time window, we found that virus–positive MKs positively correlated with respiratory failure, mechanical ventilation, AKI, thrombotic events, ICU admission, and all-cause mortality. Conversely, S100A8/A9− MKs inversely correlated with each of these outcomes, apart from thrombosis. These data provide compelling evidence implicating circulating MKs in COVID-19, and we have pinpointed all the risk to the virus–positive population. Moreover, given the strong associations with mortality and adverse events, virus–positive MKs may represent a novel biomarker for severe COVID-19 but confirmatory multicenter studies are needed as well as studies that have access to peripheral blood at the time of admission.
In summary, a relatively rare cell population, S100A8/A9+ virus–positive MKs, is associated with a broad diversity of pathologies in COVID-19. Although further studies are needed to attribute causation to virus–positive MKs, there are several mechanisms by which MKs could contribute to COVID-19 adverse events. For example, larger MKs pose a physical risk to intravascular flow and have been found to plug vessels in a variety of vascular beds.23-29 Increased surface expression of P-selectin and activated GPIIb/IIIa likely exacerbate their propensity for leukostasis. MKs are also a major source of circulating calprotectin (S100A8/A9) in COVID-19, a potent signaling molecule and well-known risk factor for severe disease.46 Moreover, MKs secrete NF-κB–mediated cytokines such as IL-6 and IL-1β, thereby promoting systemic inflammation. Lastly, through potential vertical transfer of SARS-CoV-2 to emerging platelets, MKs may spread the virus throughout the body in the form of hyperactivated platelets. When considering COVID-19 from a network standpoint, each newly produced platelet would multiply the reach of an individual MK, making it easier to appreciate how a rare cell population like S100A8/A9+ virus–positive MKs could have such outsized effects.
Acknowledgments
The authors thank all members of the Grant and Goepfert laboratories who helped with the collection and processing of COVID-19 peripheral blood specimens. The authors thank Richard E. Powers for providing his expertise in brain histopathology. The authors especially thank the patients who participated in this study and acknowledge those who lost their lives battling COVID-19.
This work was supported by the UAB Precision Medicine Institute Core Funding, the EyeSight Foundation of Alabama (unrestricted departmental funds), Research to Prevent Blindness (unrestricted departmental funds), VSRC core grant P30 EY003039, and National Institutes of Health grants R01EY032753, R01EY025383, R01EY028858, R01EY012601, and R01EY028037.
Authorship
Contribution: S.D.F. coconceived the project, designed and performed experiments and interpreted the data, obtained, analyzed, and interpreted the scRNA-seq data, processed peripheral blood samples, wrote the first draft of the manuscript, and created visualizations for Figures 1-5; M.J.P. coconceived the project, obtained, processed, and analyzed EMR data, processed peripheral blood samples, and created visualizations for Figure 6 and Table 1; B.F.F. assisted with flow cytometry and experimental design; J.L.T. infected primary human MKs; C.P.V. processed peripheral blood samples; S.B.R. assisted with flow cytometry; V.S.H. collected imaging flow cytometry data; S.S. managed peripheral blood collections; J.L.F. processed peripheral blood samples; R.P. managed experimental supplies; J.D.Z. assisted with processing EMR data; A.B.C. oversaw institutional review board study approval; P.L. supervised statistical analyses of clinical data; F.H., A.G., and N.E. provided expert opinions; R.C. obtained and processed brain tissue samples; A.G. obtained and processed ARDS lung tissue; K.S.H. supervised BSL3 experiments; P.A.G. and N.E. supervised clinical sample collections; M.B.G. and M.M. obtained funding and supervised the overall study; and all authors reviewed and approved the final version of the manuscript.
Conflict-of-interest disclosure: The authors declare no competing financial interests.
Correspondence: Maria B. Grant, Department of Ophthalmology, University of Alabama at Birmingham, 1670 University Blvd, Volker Hall 490, Birmingham, AL 35233; e-mail: mariagrant@uabmc.edu; and Matthew Might, Hugh Kaul Precision Medicine Institute, University of Alabama at Birmingham, 510 20th St S, Kaul Human Genetics Bldg 858B, Birmingham, AL 35233; e-mail: might@uab.edu.
References
Author notes
∗S.D.F. and M.J.P. are joint first authors.
†M.B.G. and M.M. are joint senior authors.
Previously published raw sequencing data used in this article are available in the Gene Expression Omnibus database (accession number GSE155673), European Nucleotide Archive repository (accession number E-MTAB-9652), and Genome Sequence Archive of the Beijing Institute of Genomics Data Center (accession numbers HRA000150 and PRJCA002413).
Electronic medical record data cannot be shared for reasons related to patient privacy. Data are available on request from the corresponding authors, Maria B. Grant (mariagrant@uabmc.edu) and Matthew Might (might@uab.edu).
The full-text version of this article contains a data supplement.

![Circulating MKs are increased in COVID-19. (A) scRNA-seq dimensionality reduction using uniform manifold approximation and projection of 317 562 cells derived from 4 separate studies. MKs (4180 cells) are shown in red. (B) scRNA-seq marker genes used to identify circulating MKs. (C) Frequency of MKs relative to all cells from scRNA-seq samples. Median ± minimum/maximum. Kruskal–Wallis one-way ANOVA with Dunn post hoc multiple comparisons test. All groups compared with uninfected control. Adjusted P value ∗∗∗P = .001 to .0001. Mild-moderate: n = 15; severe: n = 14; early recovery (<7 days after first negative polymerase chain reaction [PCR] test): n = 8; late recovery (>14 days after first negative PCR test): n = 8; uninfected: n = 19. (D) Flow cytometry from UAB COVID-19 peripheral blood samples (n = 20) showing gating of CD61+ CD41+ DNA–positive MKs. The histogram shows ploidy distribution ranging from 2n to 32n. (E) Cytocentrifugation of FACS-sorted MKs stained with hematoxylin and eosin. (F) Representative flow cytometry plots showing the proportion of MKs relative to platelets in uninfected vs COVID-19 peripheral blood. (G) Quantification of MK frequency, relative to all live events, using flow cytometry on peripheral blood from uninfected (n = 9 donors) vs COVID-19 (n = 218 patients; 220 samples). Mean ± standard error of the mean (SEM). Unpaired 2-tailed t test with Welch correction; ∗∗∗∗P < .0001. ANOVA, analysis of variance.](https://ash.silverchair-cdn.com/ash/content_public/journal/bloodadvances/7/15/10.1182_bloodadvances.2022009022/1/m_blooda_adv-2022-009022-gr1.jpeg?Expires=1767757782&Signature=mSjKirzCr4mLHhTK85sRIuNWHQzPbYaRzlHemjB8JO-eZ7iOvVWtMePjxB-ibkdL4M89WgaLIeeapWAMTO8bqBbHfp6ff7LedGYZREd4xsaEcifMgUAkWcQzCX8HZeWGLwkBcPli8mtudNuQTS~syc5mzFHSwF1KLx9DfyxHQq2suSzMbPbBqdA~rnnOVAwzhT8c2d5xKt~gILvGU96VuvB2vIZ6BknOWaNRtic2iz1Ul6l~ZVPMdWz6xB5Y7a0SGU~nbTj5wLWNVp5LJ8H1kh3Z53RtAe6jSSGk7CzjsJdRK2dQhl6v8zHN6LF8j~R9eYCTJaurynHhoVf4sUWRlQ__&Key-Pair-Id=APKAIE5G5CRDK6RD3PGA)

![Circulating MKs are increased in COVID-19. (A) scRNA-seq dimensionality reduction using uniform manifold approximation and projection of 317 562 cells derived from 4 separate studies. MKs (4180 cells) are shown in red. (B) scRNA-seq marker genes used to identify circulating MKs. (C) Frequency of MKs relative to all cells from scRNA-seq samples. Median ± minimum/maximum. Kruskal–Wallis one-way ANOVA with Dunn post hoc multiple comparisons test. All groups compared with uninfected control. Adjusted P value ∗∗∗P = .001 to .0001. Mild-moderate: n = 15; severe: n = 14; early recovery (<7 days after first negative polymerase chain reaction [PCR] test): n = 8; late recovery (>14 days after first negative PCR test): n = 8; uninfected: n = 19. (D) Flow cytometry from UAB COVID-19 peripheral blood samples (n = 20) showing gating of CD61+ CD41+ DNA–positive MKs. The histogram shows ploidy distribution ranging from 2n to 32n. (E) Cytocentrifugation of FACS-sorted MKs stained with hematoxylin and eosin. (F) Representative flow cytometry plots showing the proportion of MKs relative to platelets in uninfected vs COVID-19 peripheral blood. (G) Quantification of MK frequency, relative to all live events, using flow cytometry on peripheral blood from uninfected (n = 9 donors) vs COVID-19 (n = 218 patients; 220 samples). Mean ± standard error of the mean (SEM). Unpaired 2-tailed t test with Welch correction; ∗∗∗∗P < .0001. ANOVA, analysis of variance.](https://ash.silverchair-cdn.com/ash/content_public/journal/bloodadvances/7/15/10.1182_bloodadvances.2022009022/1/m_blooda_adv-2022-009022-gr1.jpeg?Expires=1767757783&Signature=JeWjrFXKBQpN8MzK53HDLhII-w0zbqsOjBOsR0PItoWdrQQTPVwuRRpF3L05aO3GlKjf05sDDIJBrnEQ~a-tKXn-rfa45ghihKyC5WY60DFXEXGcWUvT~LJGTviixBeOSMxjEwomRYEPjnCbBZd7-JoW1ZQoY4XMtcmHIPnnXj2hiVsh8i79Sa7U7cP8axBYd4aFNhv5WIyhYz-fzCtIjMajp6UhIhc0-ODfEubysNPPjct~e2hElfNwENVmlkfDevIkO8ErwIikeobM2JdVOoDz9qzI5rlmChBn--uSsChHPP6CAD2H8W0fsxu-8By74K2yKKXPfW1QGCFh-2HvJQ__&Key-Pair-Id=APKAIE5G5CRDK6RD3PGA)
