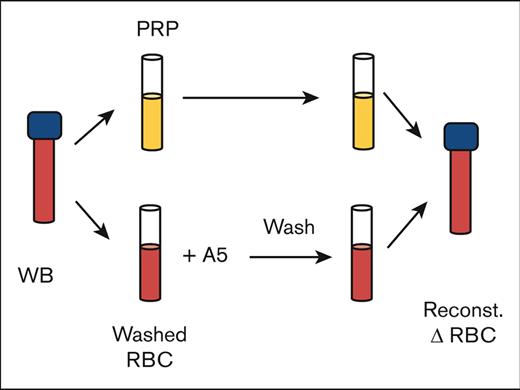
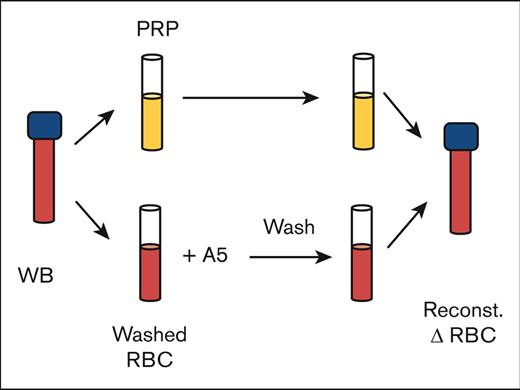
Key Points
RBCs and platelets have complementary roles in TG.
The coagulant effect of RBCs is preferentially blocked by annexin A5.
Abstract
Red blood cells (RBCs) and platelets contribute to the coagulation capacity in bleeding and thrombotic disorders. The thrombin generation (TG) process is considered to reflect the interactions between plasma coagulation and the various blood cells. Using a new high-throughput method capturing the complete TG curve, we were able to compare TG in whole blood and autologous platelet-rich and platelet-poor plasma to redefine the blood cell contributions to the clotting process. We report a faster and initially higher generation of thrombin and shorter coagulation time in whole blood than in platelet-rich plasma upon low concentrations of coagulant triggers, including tissue factor, Russell viper venom factor X, factor Xa, factor XIa, and thrombin. The TG was accelerated with increased hematocrit and delayed after prior treatment of RBC with phosphatidylserine-blocking annexin A5. RBC treatment with ionomycin increased phosphatidylserine exposure, confirmed by flow cytometry, and increased the TG process. In reconstituted blood samples, the prior selective blockage of phosphatidylserine on RBC with annexin A5 enhanced glycoprotein VI–induced platelet procoagulant activity. For patients with anemia or erythrocytosis, cluster analysis revealed high or low whole-blood TG profiles in specific cases of anemia. The TG profiles lowered upon annexin A5 addition in the presence of RBCs and thus were determined by the extent of phosphatidylserine exposure of blood cells. Profiles for patients with polycythemia vera undergoing treatment were similar to that of control subjects. We concluded that RBC and platelets, in a phosphatidylserine-dependent way, contribute to the TG process. Determination of the whole-blood hypo- or hyper-coagulant activity may help to characterize a bleeding or thrombosis risk.
Introduction
Enhanced blood clotting is a primary cause of venous thromboembolism.1 To understand the pathophysiology of this process, the contribution of all blood components should be considered. In addition to plasma (anti)coagulation proteins and platelets, there is evidence that abnormalities in red blood cells (RBCs) also can be risk factors for thrombosis.2 Experimental studies have indicated that RBCs contribute to thrombus and clot formation, for instance, by enhancing thrombus stability.3-5 Furthermore, in patients with hemolytic anemia, sickle cell disease, or polycythemia,6-8 qualitative or quantitative alterations in RBC might be linked to thromboembolic events.9,10 It is known that (aging) RBCs express procoagulant phosphatidylserine in a manner that is increased in sickle cell anemia.11-13 Therefore, it is important to assess whether and how RBCs can contribute in the coagulation process to achieve a thrombotic phenotype.
In the past decade, fluorogenic thrombin generation (TG) assays have frequently been used to evaluate coagulation in blood plasma to link to thrombosis or bleeding risks.14,15 However, in such plasma-based tests, the contribution of blood cells is not taken into account. Initially, whole-blood TG, with all blood cells present, was challenging because of repeated sampling and low throughput.16 Later higher throughput methods for blood TG were hampered by RBC fluorescence quenching,17,18 which allowed for the capturing of only the initial phase of TG.19
For this study, we solved earlier issues with a 96 well-plate–based method using nondiluted blood samples, providing completed, calibrated kinetics of TG, and allowing for direct comparison by TG of blood and plasma samples. This allowed us to test the effects of various coagulation triggers as well as the role of exposed phosphatidylserine on RBC and platelets as potent procoagulant membrane surfaces.20 As a proof-of-concept, we also analyzed blood samples from patients with RBC complications and an assumed prothrombotic phenotype. Collectively, our data point to additive roles of RBC and platelets in this coagulant process.
Materials and methods
An extended version of the materials and methods is available in the supplemental File.
Study subjects
Human blood was collected from healthy volunteers who had not taken medication for >2 weeks. Studies were conducted as guided by the Declaration of Helsinki and approved by the Medical Ethics Committee of Maastricht University Medical Center. The patient study was approved by the Research and Ethics Committee of Padua University Hospital. Patients with potential RBC abnormalities and day controls were included in September 2022.
Blood sample preparation
Blood samples were collected into 3.2% trisodium citrate Vacuette tubes (Greiner Bio-One, Alphen a/d Rijn, The Netherlands). Platelet-rich plasma (PRP) and platelet-poor plasma (PPP)17,21 were prepared as detailed in the supplemental File. Double-washed RBCs in N-2-hydroxyethylpiperazine-N′-2-ethanesulfonic acid (Hepes) buffer pH 7.35 (136 mM NaCl, 2.7 mM KCl, 10 mM Hepes, 2 mM MgCl2, 0.1% weight-to-volume bovine serum albumin [BSA], and 0.1% weight-to-volume glucose) were reconstituted with autologous PRP or PPP, as indicated.
Measurement of TG in whole blood and PRP
Calibrated measurements of TG were performed in 96-well plates with major modifications from previous TG measurements in whole blood.19 Samples of citrated whole blood (WB), PRP, or PPP (3 volumes) were mixed with 2 volumes Z-Gly-Gly-Arg-AMC substrate solution (ZGGR-AMC in BSA60 buffer) and 1 volume trigger solution in BSA5 buffer. Optimized final concentrations (fc) of cations in the blood (PRR and PPP) were 6 mM (11 mM) CaCl2 and 3 mM (5.5 mM) MgCl2, respectively. For mixing procedure, see supplemental File. The use of ZGGR-AMC as the thrombin substrate (417 μM, fc) together with adapted fluorescence optics allowed for the first measurement of complete TG curves in the whole blood. Fluorescence signals were recorded with a Fluoroskan Ascent microplate fluorometer (Thermolabsystems, Helsinki, Finland) at fluorescence wavelengths of λex = 355 nm and λem = 460 nm. Fluorescence was collected parallelly from sample and corresponding calibrator wells using Fluoroskan Ascent Software (version 2.6). An Excel-based calculation template was used to automatically generate first-derivative TG curves from raw fluorescence data. Then, 5 TG parameters were calculated from those first-derivative TG curves corresponding to blood and plasma samples: lagtime in minutes (P1), time-to-peak in minutes (P2), velocity index in nM/min (P3), thrombin peak in nM (P4), and endogenous thrombin potential in nM × minutes (ETP; P5). Absence of hemolysis was routinely checked at the end of measurements.
Triggering of blood and plasma samples
In the blood or PRP, TG was triggered, as appropriate, with tissue factor (0.1-1.0 pM), Rvv-X activator (dilution, 1e–3 to 1e–7), factor Xa (0.1-10 nM), factor XIa (0.3-3 pM), or thrombin (0.1-10 nM). Platelet activation was induced (10 minutes) with the glycoprotein VI (GPVI) agonist cross-linked collagen-related peptide (CRP-XL; 25 μg/mL), which enhances procoagulant activity. For specific experiments, wells containing blood or PRP were preincubated with selected inhibitors of platelet activation or thrombin exosite 1 or 2.
RBC treatment and reconstitution
Washed annexin A5–treated RBCs were reconstituted with autologous PRP or PPP for TG experiments, as described in the supplemental Methods. Note that the RBC treatment and washing step were performed in a way to retain annexin A5 binding to the phosphatidylserine-exposing RBCs by a continued presence of millimolar CaCl2.
Statistical analysis and data clustering
Statistical analyses were performed with GraphPad Prism 8 (San Diego, CA) and R package version 4.2.1 (www.r-project.org). Data are presented as mean ± standard deviation. Significance was determined using a 1-way or 2-way analysis of variance, as required (P < .05 was statistically significant). Clustered (subtraction) heat maps of univariate scaled parameters were constructed, as previously described.22 For correlation matrices, normality was assessed with a Shapiro-Wilk test. When parameters were nonnormally distributed, it was followed by Spearman correlation analysis. Principal component analysis and k-means clustering analysis used the scaling function in R.
Results
Simultaneous assessment of a completed TG in whole blood and plasma
Earlier attempts to measure TG in whole blood samples using 96-well plates only captured the first, rising part of TG.19,23 We now improved the method using the thrombin substrate ZGGR-AMC in combination with altered fluorescence optics. Other changes included a consistent handling of the viscous blood samples in 96-well plates, adapted calibrator wells, and new data processing scripts. Application with blood from healthy subjects resulted in complete, calibrated TG curves at high throughput. Triplicate measurements with 0.1 pM tissue factor triggering gave an acceptable 5% to 10% intra-assay variation of curve parameters, that is, lagtime (P1), time-to-peak (P2), velocity index (maximal initial slope, P3), thrombin peak level (P4), and ETP (area under the curve, P5).
Because both extracellular Ca2+ and Mg2+ affect platelet and coagulant activities,24,25 we optimized the concentrations of the 2 cations by adding different combinations of these to citrated blood (0-10 mM) or PRP (0-15 mM) and triggered the TG process with 1 pM tissue factor. Heat mapping of the curve variables indicated relatively broad millimolar ranges for maximal TG curves in blood and PRP (supplemental Figure 1A-B). Within the optimum, we choose to use 6 mM CaCl2 and 3 mM MgCl2 in citrated blood and 11 mM CaCl2 and 5.5 mM MgCl2 in citrated PRP.
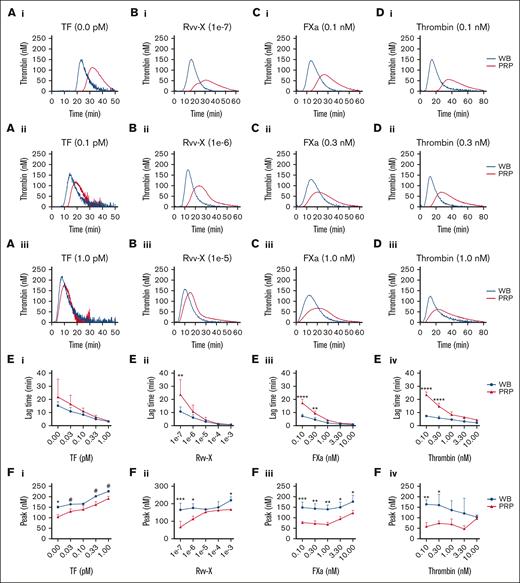
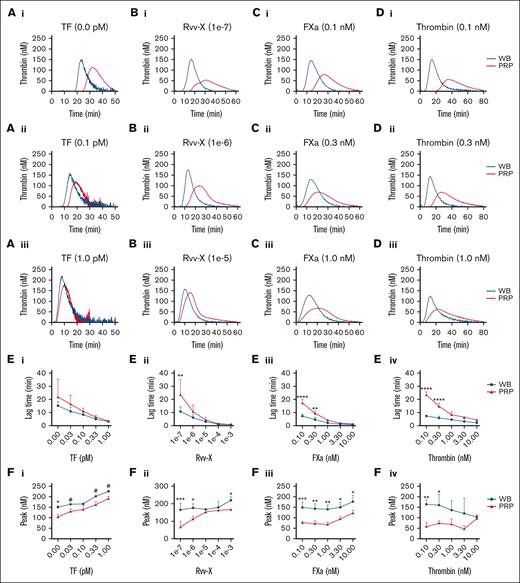
In parallel blood and PRP samples, we compared the kinetics of TG induced by CaCl2/MgCl2 and distinct coagulant triggers, that is, with vehicle, tissue factor (activating the extrinsic factor VII pathway), snake venom Rvv-X (activating factor X), factor Xa, or thrombin. With vehicle solution or low coagulant triggers, the majority of TG curves showed a faster onset and stronger response in the whole blood than in PRP (Figure 1A-D, panels i-ii). At higher coagulant triggers, the differences decreased, although factor Xa and thrombin remained more active in blood (Figure 1A-Diii). Curve quantification indicated that at low Rvv-X (dilution, 1e–7), factor Xa (≤0.3 nM) or thrombin (≤0.3 nM) levels, lag times were significantly shorter in the blood than in PRP (Figure 1E). Furthermore, over a wider concentration range for all triggers, TG peak levels were higher in the blood than in PRP (Figure 1F). In addition, triggering with factor XIa (0.3-3.0 pM) caused a more enhanced TG response in the blood than in PRP (supplemental Figure 2A). Together, this suggested that blood components other than platelets and plasma contribute to the initial phase of TG. This idea was confirmed by measuring clotting times in corresponding blood and PRP samples, indicating a significant shortening in case of blood (supplemental Figure 2B).
Enhanced TG in the blood compared with PRP for all coagulant triggers. TG in the whole blood or PRP was triggered in the presence of CaCl2/MgCl2 with vehicle medium or tissue factor (0.1-1.0 pM) (Ai-iii), Rvv-X activator (dilutions, 1e–3 to 1e–7) (Bi-iii), factor Xa (FXa, 0.1-10 nM) (Ci-iii), or 0.1 to 10 nM thrombin (Di-iii). Shown are representative curves of nanomolar calibrated TG for each trigger. Calibrated curves of TG were quantitatively assessed for lagtime (E) and thrombin peak level (F) per trigger and dose. Each condition was performed in parallel with whole blood and corresponding PRP from 3 donors (n = 3) using 2-way analysis of variance (ANOVA); #P < .10; ∗P < .05; ∗∗P < .01; ∗∗∗P < .001. Complete data are provided in Datafile 1. TF, tissue factor.
Enhanced TG in the blood compared with PRP for all coagulant triggers. TG in the whole blood or PRP was triggered in the presence of CaCl2/MgCl2 with vehicle medium or tissue factor (0.1-1.0 pM) (Ai-iii), Rvv-X activator (dilutions, 1e–3 to 1e–7) (Bi-iii), factor Xa (FXa, 0.1-10 nM) (Ci-iii), or 0.1 to 10 nM thrombin (Di-iii). Shown are representative curves of nanomolar calibrated TG for each trigger. Calibrated curves of TG were quantitatively assessed for lagtime (E) and thrombin peak level (F) per trigger and dose. Each condition was performed in parallel with whole blood and corresponding PRP from 3 donors (n = 3) using 2-way analysis of variance (ANOVA); #P < .10; ∗P < .05; ∗∗P < .01; ∗∗∗P < .001. Complete data are provided in Datafile 1. TF, tissue factor.
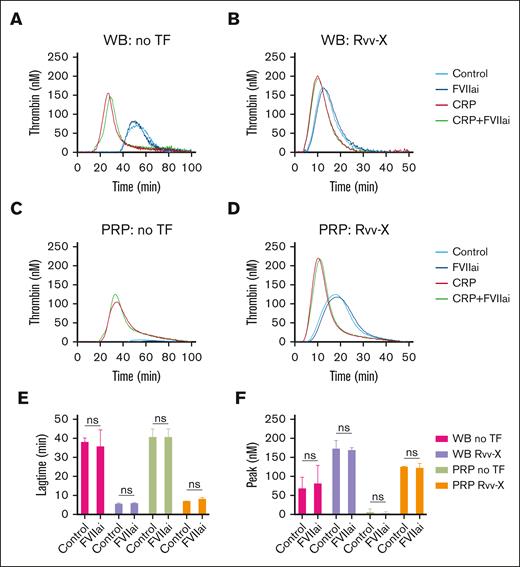
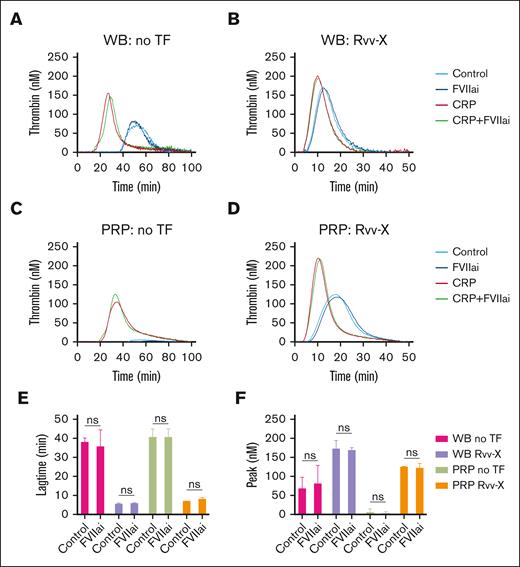
Considering a possible role of blood-borne tissue factor in blood samples,20 we compared the TG in blood and PRP samples preincubated with factor VIIa inhibitor (1 μg/mL).26 Coagulation triggering with vehicle solution or low Rvv-X (dilution, 1e–6) gave similar profiles with factor VIIai present, for both blood (Figure 2A-B) and PRP (Figure 2C-D). Statistical analysis confirmed an unchanged lagtime and peak thrombin level (Figure 2E-F). In contrast, blood pretreatment with corn trypsin inhibitor (CTI), suppressing the contact activation pathway, resulted in a marked delay in TG even at low 0.1 pM tissue factor concentration (supplemental Figure 2Ci).
No detectable role of blood-borne tissue factor in whole blood TG. (A-D) TG in whole blood or PRP was triggered with vehicle medium (A,C) or Rvv-X activator (dilution, 1e–6) (B,D). Where indicated, samples were pretreated with CRP-XL (25 μg/mL) and/or factor VIIai (FVIIai, 1 μg/mL). Given are representative TG curves (n = 3) as well as the curve parameters lagtime (E) and thrombin peak level (F). Means ± standard deviation (SD) (n = 3), 2-way ANOVA. ns, no statistical significance. WB, whole blood.
No detectable role of blood-borne tissue factor in whole blood TG. (A-D) TG in whole blood or PRP was triggered with vehicle medium (A,C) or Rvv-X activator (dilution, 1e–6) (B,D). Where indicated, samples were pretreated with CRP-XL (25 μg/mL) and/or factor VIIai (FVIIai, 1 μg/mL). Given are representative TG curves (n = 3) as well as the curve parameters lagtime (E) and thrombin peak level (F). Means ± standard deviation (SD) (n = 3), 2-way ANOVA. ns, no statistical significance. WB, whole blood.
We also examined the effect of GPVI agonist CRP-XL, which enhances the procoagulant activity of platelets.26,27 Using weak triggers (vehicle or Rvv-X; 1e–6), CRP-XL accelerated and enhanced the TG in both whole blood and PRP, in which case the extra addition of factor VIIai was again without effect (Figure 2A-D). Together, these data indicated that, at low dose of coagulant triggers, the generation of thrombin is enhanced and increased in whole blood vs PRP by mechanisms involving other blood cells than platelets, by contact activation and GPVI-induced platelet activation.
Role of phosphatidylserine exposed on RBC
A proportion of circulating RBCs is known to have surface-exposed phosphatidylserine because of age-dependent eryptosis28 and other triggers.29-31 We investigated RBC phosphatidylserine exposure as an explanation for the enhanced TG in blood samples. For this purpose, we used the high-affinity blocking agent annexin A5, which provides 2-dimensional shields on phosphatidylserine of cells and vesicles; a mutant annexin analog lacking the 4 Ca2+-binding sites (M1-4 annexin A5) acted as control.21,32
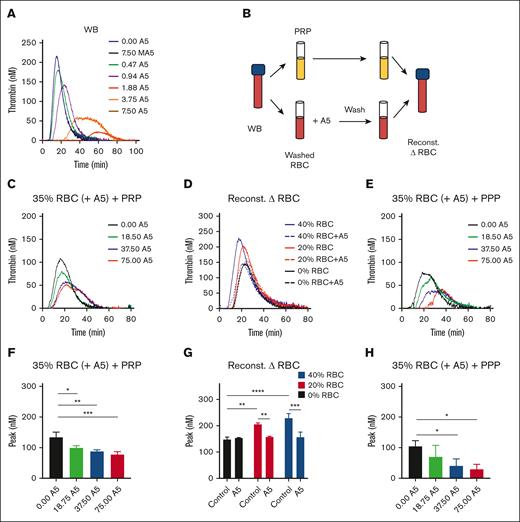
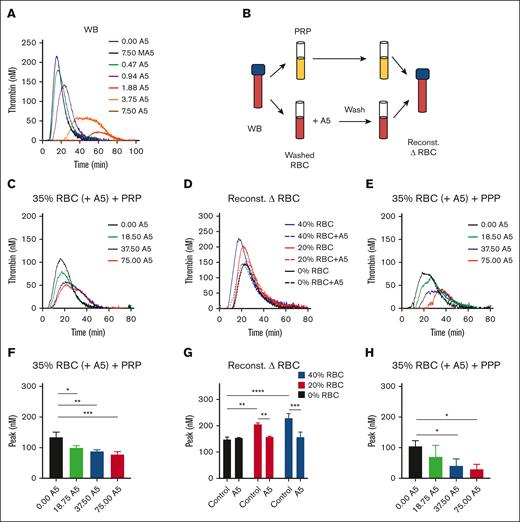
In blood triggered with 0.1 pM tissue factor, we observed a dose-dependent TG inhibition by the wild-type but not the mutant annexin A5 (Figure 3A). To check for binding to RBCs, we designed whole blood reconstitution experiments. We first treated isolated RBCs with increasing concentrations of annexin A5 (0, 18.75, 37.5, and 75 μg/mL) in the presence of CaCl2. After another triple wash in the continuous presence of CaCl2, we reconstituted the annexin A5–blocked RBC (35% hematocrit) with autologous PRP (Figure 3B). According to this procedure, the annexin A5 was retained on phosphatidylserine-exposing RBCs, whereas the residual unbound annexin A5 was washed away. In these reconstituted samples, the RBC pretreated with the lowest dose of annexin A5 delayed showed a lowered TG, whereas higher treatment doses did not have a significant additional effect (Figure 3C,F). When changing the hematocrit in the reconstituted samples from 20% to 40%, the TG lagtime shortened and the peak level increased (Figure 3D). However, the annexin-treated RBC invariably reduced the TG curve to the level as seen in PRP, that is, the absence of RBC (Figure 3D,G). Together, this pointed to a hematocrit-dependent enhancing effect on TG that was annulled by pretreatment of the RBCs with annexin A5. To further confirm a role of phosphatidylserine-exposing RBCs in the enhancement of whole blood TG, we also reconstituted (annexin A5-treated) RBC with PPP. In this case, we noticed an annexin treatment dose–dependent lowering of TG (Figure 3E,H), likely because of the fact that phosphatidylserine-exposing platelets could not take over the TG process.
Contribution of RBC-exposed phosphatidylserine to TG. (A) TG was triggered by 0.1 pM tissue factor in the WB in the presence of annexin A5 (A5; 0.47-7.50 μg/mL) or mutant annexin A5 (MA5; 7.50 μg/mL), which lacks Ca2+- and phosphatidylserine-binding sites. Shown are representative calibrated curves of 3 independent experiments. (B) Schematic procedure of using isolated RBC, treatment with annexin A5 triple wash in the presence of 2 mM CaCl2, and reconstitution with autologous PRP. (C,F) TG effect of RBC treatment with different annexin A5 concentrations (A5, 18.5-75.0 μg/mL) reconstituted at 35% hematocrit in the presence of platelets. Indicated are representative TG curves (C) and thrombin peak levels (F). Means ± SD (n = 3), 1-way ANOVA, ∗P < .05; ∗∗P < .01; ∗∗∗P < .001. (D,G) TG effect of RBC treatment with vehicle or 37.5 μg/mL annexin A5, reconstituted at 20% or 40% hematocrit. Representative TG curves (D) and quantified thrombin peak levels (G). Means ± SD (n = 3); 2-way ANOVA, ∗P < .05; ∗∗P < .01. (E,H) TG effect of RBC treatment with different annexin A5 concentrations (A5, 18.5-75.0 μg/mL) reconstituted at 35% hematocrit in the absence of platelets. Representative TG curves (E) and quantified thrombin peak levels (H). Means ± SD (n = 3), 1-way ANOVA, ∗P < .05. Full data are in Datafile 1. Note: 0% RBC plus annexin A5 refers to a triple washing with Hepes buffer. Reconst, reconstituted.
Contribution of RBC-exposed phosphatidylserine to TG. (A) TG was triggered by 0.1 pM tissue factor in the WB in the presence of annexin A5 (A5; 0.47-7.50 μg/mL) or mutant annexin A5 (MA5; 7.50 μg/mL), which lacks Ca2+- and phosphatidylserine-binding sites. Shown are representative calibrated curves of 3 independent experiments. (B) Schematic procedure of using isolated RBC, treatment with annexin A5 triple wash in the presence of 2 mM CaCl2, and reconstitution with autologous PRP. (C,F) TG effect of RBC treatment with different annexin A5 concentrations (A5, 18.5-75.0 μg/mL) reconstituted at 35% hematocrit in the presence of platelets. Indicated are representative TG curves (C) and thrombin peak levels (F). Means ± SD (n = 3), 1-way ANOVA, ∗P < .05; ∗∗P < .01; ∗∗∗P < .001. (D,G) TG effect of RBC treatment with vehicle or 37.5 μg/mL annexin A5, reconstituted at 20% or 40% hematocrit. Representative TG curves (D) and quantified thrombin peak levels (G). Means ± SD (n = 3); 2-way ANOVA, ∗P < .05; ∗∗P < .01. (E,H) TG effect of RBC treatment with different annexin A5 concentrations (A5, 18.5-75.0 μg/mL) reconstituted at 35% hematocrit in the absence of platelets. Representative TG curves (E) and quantified thrombin peak levels (H). Means ± SD (n = 3), 1-way ANOVA, ∗P < .05. Full data are in Datafile 1. Note: 0% RBC plus annexin A5 refers to a triple washing with Hepes buffer. Reconst, reconstituted.
To check for a role of the contact activation pathway, we treated part of the blood samples with CTI. When the isolated plasma samples were reconstituted with RBCs, the prior CTI treatment caused a delay and suppression of TG curves (with or without platelets), similar to that in whole-blood samples (supplemental Figure 2Cii-iii). In contrast, extra addition of white blood cell-enriched buffy coat to the blood did not alter the TG curves (supplemental Figure 3). Together, this pointed to phosphatidylserine exposure on RBCs and the contact activation system as major factors in the initial enhancement of TG in blood.
Role of platelet activation in blood and PRP
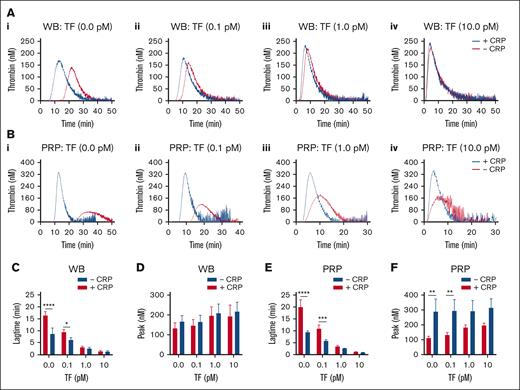
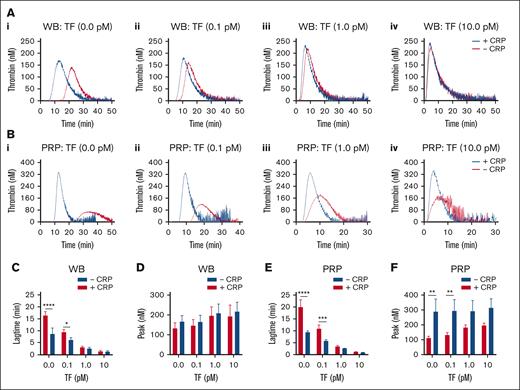
To better examine the impact of GPVI-induced platelet activation, we compared how this agonist changed the TG at different concentrations of tissue factor. When tested in blood, CRP-XL appeared to accelerate in the absence or presence of low 0.1 pM tissue factor. In contrast, the enhancing effect of CRP-XL continued at higher tissue factor doses in the PRP (Figure 4A-Bi-iv). These changes were confirmed by statistical analysis of the TG lag times and peak values (Figure 4C-F).
TF concentration dependent effect of GPVI-induced platelet activation in TG. Parallel samples of WB (A) and PRP (B) were triggered in the absence of TF (i), or with 0.1 pM TF (ii), 1 pM TF (iii), or 10 pM TF (iv). Preincubation was with 25 μg/mL CRP-XL, where indicated (+CRP). Traces are representative of 3 independent experiments (A and B). Plots of TG lagtime and thrombin peak levels in the whole blood (C-D) or PRP (E-F). Means ± SD (n = 3); 2-way ANOVA, ∗P < .05; ∗∗P < .01; ∗∗∗P < .001; ∗∗∗∗P < .0001. See further details in Datafile 1.
TF concentration dependent effect of GPVI-induced platelet activation in TG. Parallel samples of WB (A) and PRP (B) were triggered in the absence of TF (i), or with 0.1 pM TF (ii), 1 pM TF (iii), or 10 pM TF (iv). Preincubation was with 25 μg/mL CRP-XL, where indicated (+CRP). Traces are representative of 3 independent experiments (A and B). Plots of TG lagtime and thrombin peak levels in the whole blood (C-D) or PRP (E-F). Means ± SD (n = 3); 2-way ANOVA, ∗P < .05; ∗∗P < .01; ∗∗∗P < .001; ∗∗∗∗P < .0001. See further details in Datafile 1.
Markedly, in the whole blood with added annexin A5, most strongly at 1.88 and 3.75 μg/mL, platelet preactivation with CRP-XL caused a shortening and increase in TG (supplemental Figure 4A). In contrast, in reconstituted RBC plus plasma (without platelets), CRP-XL was without effects, and TG was already fully blocked at 1.88 μg/mL annexin A5 (supplemental Figure 4B). Together, these results support a procoagulant role of phosphatidylserine-positive RBCs at low trigger dose, which is supplemented with CRP-XL–induced platelet procoagulant activity.
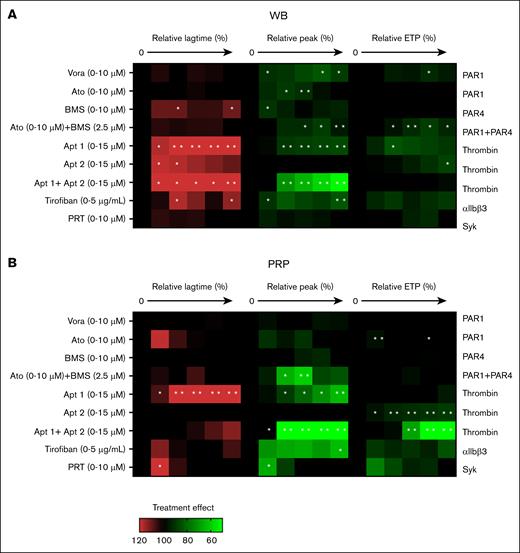
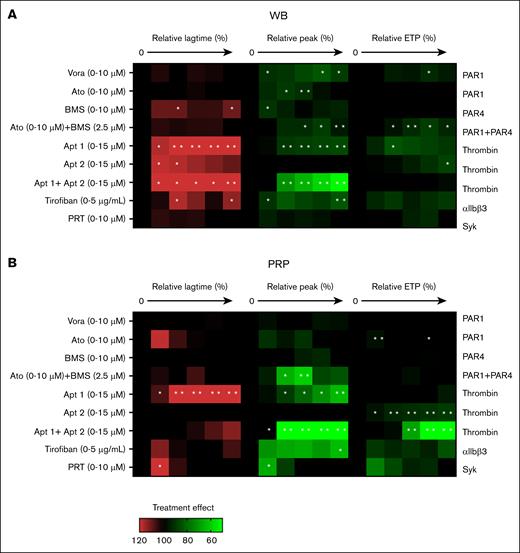
To further assess the roles of platelets in the whole-blood system, we checked, in a dose-dependent way, a number of established inhibitors: the PAR1 antagonists vorapaxar and atopaxar,33 the PAR4 antagonist BMS-986120, aptamers against thrombin exosite 1 and/or 2,34,35 integrin αIIbβ3 antagonist tirofiban, and Syk kinase inhibitor PRT-060318. Heat mapping of the effects on TG parameters lagtime (P1), peak level (P4), and ETP (P5) in blood samples (Figure 5A) and in parallel PRP samples (Figure 5B) indicated no major effects of the 3 thrombin receptor antagonists, not even in combination. An integrin-like receptor for fibrinogen on RBC has been reported.36 Additionally, in mice, a role of fibrin(ogen) in RBC capturing has been observed.3 This raises the option that tirofiban can also interfere in the contact of RBC with platelets and certain coagulation factors.
Effects of receptor-directed platelet inhibitors on TG. TG was measured in parallel in the WB (A) and autologous PRP (B). Samples were preincubated with vehicle medium or inhibitor at 5 increasing concentrations: vorapaxar (Vora; 0.04, 0.16, 0.63, 2.5, or 10 μM; PAR1 antagonist), atopaxar (Ato, idem), BMS-986120 (BM, idem; PAR4 antagonist), aptamer 1 (Apt1, 0.50, 1.75, 3, 9, or 15 μM; thrombin exosite-1 antagonist), aptamer 2 (Apt2, idem exosite-2), aptamer 1+2 (Apt1+2, idem exosite 1+2), tirofiban (0.31, 0.63, 1.25, 2.5, or 5 μg/mL; integrin αIIbβ3 antagonist), or PRT-060318 (PRT, 0.02, 0.08, 0.4, 2, or 10 μM; Syk antagonist), for 10 minutes at 37°C. TG parameters were compared relative to the vehicle condition (set at 100%). Heatmap presentation of % treatment effect at increasing dose on lagtime (left, 6 rows), thrombin peak levels (middle, 6 rows), and ETP (area under the curve; right, 6 rows). Color code showing increase (red) or decrease (green) in comparison with the vehicle control condition (black, 100%). Each condition was measured 3 times. Significance from vehicle controls, ∗P < .05; ∗∗P < .01; ∗∗∗P < .001; ∗∗∗∗P < .0001 (paired t test).
Effects of receptor-directed platelet inhibitors on TG. TG was measured in parallel in the WB (A) and autologous PRP (B). Samples were preincubated with vehicle medium or inhibitor at 5 increasing concentrations: vorapaxar (Vora; 0.04, 0.16, 0.63, 2.5, or 10 μM; PAR1 antagonist), atopaxar (Ato, idem), BMS-986120 (BM, idem; PAR4 antagonist), aptamer 1 (Apt1, 0.50, 1.75, 3, 9, or 15 μM; thrombin exosite-1 antagonist), aptamer 2 (Apt2, idem exosite-2), aptamer 1+2 (Apt1+2, idem exosite 1+2), tirofiban (0.31, 0.63, 1.25, 2.5, or 5 μg/mL; integrin αIIbβ3 antagonist), or PRT-060318 (PRT, 0.02, 0.08, 0.4, 2, or 10 μM; Syk antagonist), for 10 minutes at 37°C. TG parameters were compared relative to the vehicle condition (set at 100%). Heatmap presentation of % treatment effect at increasing dose on lagtime (left, 6 rows), thrombin peak levels (middle, 6 rows), and ETP (area under the curve; right, 6 rows). Color code showing increase (red) or decrease (green) in comparison with the vehicle control condition (black, 100%). Each condition was measured 3 times. Significance from vehicle controls, ∗P < .05; ∗∗P < .01; ∗∗∗P < .001; ∗∗∗∗P < .0001 (paired t test).
On the other hand, inhibition of thrombin exosite 1 or exosite 1 + 2 prolonged and reduced the TG in the blood and PRP (Figure 5A-B). Platelet integrin or Syk inhibition had stronger influence on coagulation in the PRP than in whole blood, in agreement with earlier PRP data.25 Overall, these results indicated a more pronounced effect of known platelet inhibitors in the PRP setting.
Modulation of RBC phosphatidylserine exposure
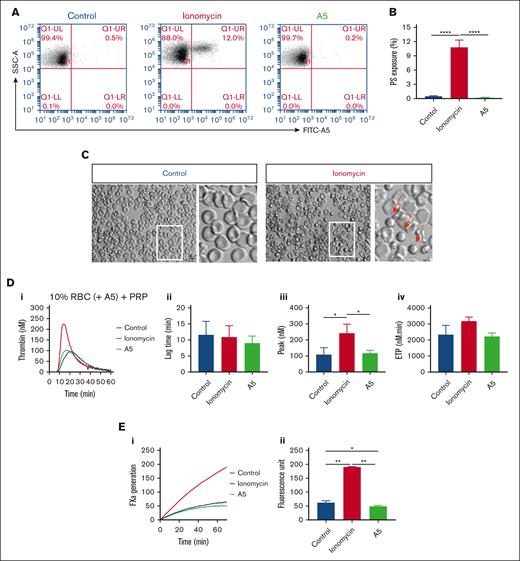
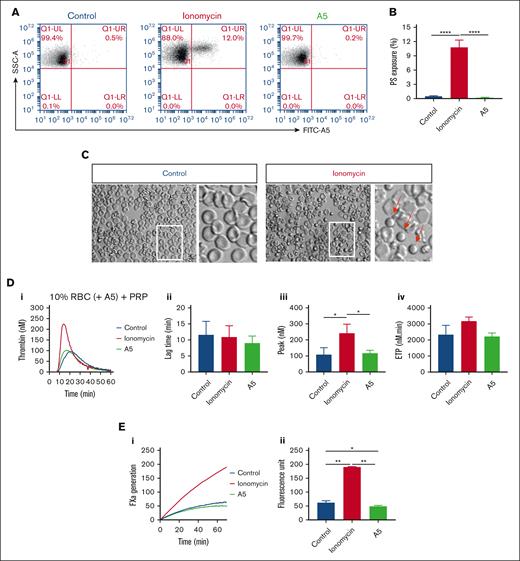
Previous flow cytometric studies indicated that a small fraction of isolated human RBCs expresse phosphatidylserine.37,38 This was confirmed by flow cytometry with FITC–annexin A5, showing 0.57% ± 0.33% (mean ± standard deviation; n = 3) in freshly washed RBC (supplemental Figure 5A). To study the suspected procoagulant effect of phosphatidylserine-exposing RBCs, we treated the washed RBCs with ionomycin or unlabeled annexin A5. This resulted in increased (12%) and decreased (0.2%) percentages of positive RBCs, respectively (Figure 6A-B). Microscopic examination indicated a small, spherical shape of part of the ionomycin-treated RBCs (Figure 6C). Markedly, reconstitution of the ionomycin-treated RBC with PRP resulted in more than a twofold increase in the rising phase of TG, when compared with untreated RBCs (Figure 6D). In agreement with a procoagulant role of the phosphatidylserine exposure, ionomycin-treated RBCs strongly increased the factor Xa activity in a purified system (Figure 6E). In control experiments, we also checked for the presence of phosphatidylserine-exposing vesicles. In platelet-free plasma obtained from freshly isolated blood samples, however, TG remained very low in response to Rvv-X but not when triggered with tissue factor plus phospholipids (supplemental Figure 5B).
Altered TG by increasing or blocking phosphatidylserine exposure on RBC. (A-B) Flow cytometry of phosphatidylserine exposure of washed RBC after 30 minutes treatment with 10 μM ionomycin/CaCl2 or with 7.5 μg/mL annexin A5/CaCl2 (A5), analyzed after labeling with FITC–annexin A5. Shown are representative fluorescence-scatter profiles (F1 vs SSC) (A) and fractions of phosphatidylserine-exposing RBC (B). Visualization of RBC without or with ionomycin/CaCl2 treatment (C). Arrows indicate activated, rounded RBC. (D) Effect of RBC treatment with ionomycin/CaCl2 or annexin A5/CaCl2 and wash, in comparison with no treatment (control) on TG in PRP samples reconstituted at 10% hematocrit at 0.1 pM tissue factor. Panels show representative curves (i), quantified lag times (ii), thrombin peak levels (iii), and ETP values (iv). (E) Effect of RBC treatment with ionomycin/CaCl2 or annexin A5/CaCl2 on factor Xa generation in a purified system. Indicated are representative factor Xa generation curves (i) and increased fluorescence units over 40 minutes (ii). Means ± SD (n = 3), 1-way ANOVA, ∗P < .05; ∗∗P < .01; ∗∗∗P < .001.
Altered TG by increasing or blocking phosphatidylserine exposure on RBC. (A-B) Flow cytometry of phosphatidylserine exposure of washed RBC after 30 minutes treatment with 10 μM ionomycin/CaCl2 or with 7.5 μg/mL annexin A5/CaCl2 (A5), analyzed after labeling with FITC–annexin A5. Shown are representative fluorescence-scatter profiles (F1 vs SSC) (A) and fractions of phosphatidylserine-exposing RBC (B). Visualization of RBC without or with ionomycin/CaCl2 treatment (C). Arrows indicate activated, rounded RBC. (D) Effect of RBC treatment with ionomycin/CaCl2 or annexin A5/CaCl2 and wash, in comparison with no treatment (control) on TG in PRP samples reconstituted at 10% hematocrit at 0.1 pM tissue factor. Panels show representative curves (i), quantified lag times (ii), thrombin peak levels (iii), and ETP values (iv). (E) Effect of RBC treatment with ionomycin/CaCl2 or annexin A5/CaCl2 on factor Xa generation in a purified system. Indicated are representative factor Xa generation curves (i) and increased fluorescence units over 40 minutes (ii). Means ± SD (n = 3), 1-way ANOVA, ∗P < .05; ∗∗P < .01; ∗∗∗P < .001.
Proof-of-principle patient study
Considering the contribution of RBCs to whole blood TG, we also tested this in patients with typical RBC abnormalities. The subjects, investigated during a limited period, included healthy day-controls, 5 patients with mostly familial polycythemia vera (treated by phlebotomy), 2 patients with erythrocytosis (treated by phlebotomy), and 8 untreated patients with distinct forms of anemia, of whom 2 had hemolytic anemia or sickle cell disease (Table 1). The treated patients with polycythemia vera had mostly normal hematologic parameters, the patients with erythrocytosis characteristically showed high hemoglobin levels, and all the patients with anemia had low RBC counts, in part of the cases, together with subnormal platelet counts (Table 1).
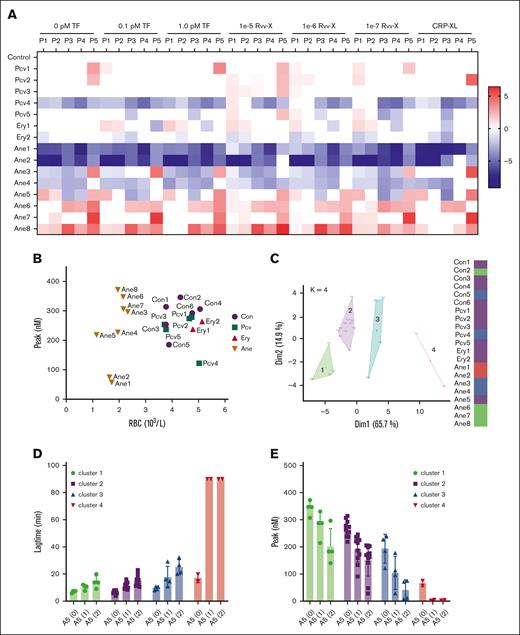
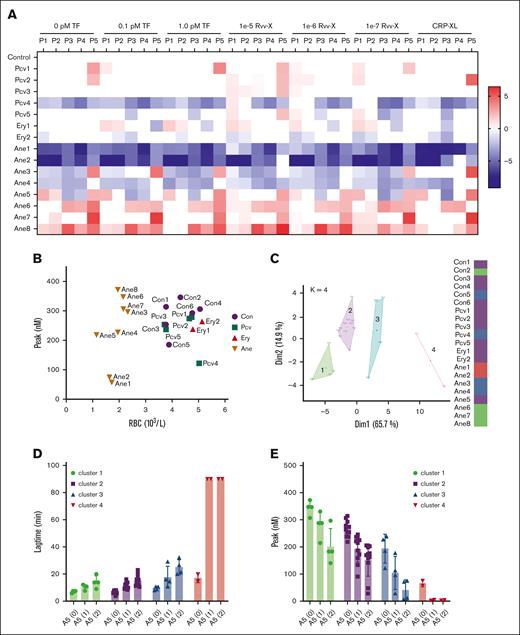
Using the collected blood samples, we obtained triplicate TG curves triggered by vehicle: 0.1 or 1.0 pM tissue factor, Rvv-X (1e-5, 1e-6, 1e-7), or CRP-XL. Representative curves per patient are given in supplemental Figure 6. A subtraction heat map of the 5 TG parameters per trigger (scaled 0-10) vs the means of controls indicated an overall high consistency in alterations per patient (Figure 7A). In particular, low values were obtained for 1 patient with polycythemia vera (Pcv4) and 2 patients with anemia (Ane1 and Ane2; both had low platelet counts as well). In contrast, high values were seen for other patients with anemia (Ane6, Ane7, and Ane8). Levels of ETP only were high for the patient with sickle cell disease (Ane7). A 2-factor plot of RBC vs peak level indicated close grouping of the healthy controls and patients with polycythemia but a separation of 6 patients with anemia with a relatively high TG and 2 with low TG, based on the RBC count (Figure 7B).
Changes in TG in blood from patients with altered RBC traits. Blood was investigated from day-control subjects (Con), or from patients with polycythemia vera, erythrocytosis, or anemia of various causes (Table 1). WB TG was measured in response to vehicle, TF (0.1, 1.0 pM), or Rvv-X (dilutions 1e-5, 1e-6, 1e-7). Where indicated, platelets in blood were stimulated with CRP-XL (25 μg/mL, 0.1 pM TF). Parameters of TG curves were univariate scaled from 0 to 10 across all conditions, and differences per patient vs means of control participants were obtained. (A) Subtraction heat map of TG parameters (scaled 0-10) from 15 patient samples per indicated trigger. Note reversed scaling for lagtime and time-to-peak (TTP). Differences were filtered for changes outside of means ± SD. Color codes: blue, decrease; red, increase. (B) Plot of RBC count and thrombin peak level (0.1 pM TF) per subject. (C) Results of principal component analysis of combined TG and hematologic parameters (supplemental Figures 7 and 8). Colors indicate 4 clusters, with each dot representing 1 subject. (D-E) Effect of annexin A5 addition (vehicle, 1 or 2 μg/mL) on lagtime (D) and peak level (E) at 0.1 pM TF per cluster of subjects (clustered according to panel C). For full data, see Datafile 1. Ane, anemia; Ery, erythrocytosis; Pcv, polycythemia vera.
Changes in TG in blood from patients with altered RBC traits. Blood was investigated from day-control subjects (Con), or from patients with polycythemia vera, erythrocytosis, or anemia of various causes (Table 1). WB TG was measured in response to vehicle, TF (0.1, 1.0 pM), or Rvv-X (dilutions 1e-5, 1e-6, 1e-7). Where indicated, platelets in blood were stimulated with CRP-XL (25 μg/mL, 0.1 pM TF). Parameters of TG curves were univariate scaled from 0 to 10 across all conditions, and differences per patient vs means of control participants were obtained. (A) Subtraction heat map of TG parameters (scaled 0-10) from 15 patient samples per indicated trigger. Note reversed scaling for lagtime and time-to-peak (TTP). Differences were filtered for changes outside of means ± SD. Color codes: blue, decrease; red, increase. (B) Plot of RBC count and thrombin peak level (0.1 pM TF) per subject. (C) Results of principal component analysis of combined TG and hematologic parameters (supplemental Figures 7 and 8). Colors indicate 4 clusters, with each dot representing 1 subject. (D-E) Effect of annexin A5 addition (vehicle, 1 or 2 μg/mL) on lagtime (D) and peak level (E) at 0.1 pM TF per cluster of subjects (clustered according to panel C). For full data, see Datafile 1. Ane, anemia; Ery, erythrocytosis; Pcv, polycythemia vera.
As an unbiased approach comparing the hematologic (10) and TG curve (5 × 6) parameters, we performed a Spearman correlation analysis, which showed high consistency within the RBC and TG parameters but not between the parameter sets (supplemental Figure 7). A principal component analysis on the same data set identified 4 clusters in 2 dimensions, explaining 80.6% of the variance (Figure 7C). The matrix for all dimensions showed a high contribution of most TG parameters to dimension 1, and stronger contribution of the RBC parameters to dimension 2 (supplemental Figure 8). Interestingly, cluster 1 was formed by the patients with anemia with relatively high TG (Ane6-8). Cluster 2 was formed by most control subjects together with the patients with polycythemia vera. Cluster 3 consisted of a mixed set of individuals, whereas cluster 4 included only the patients with anemia with low TG and low platelet counts (Ane1 and Ane2).
With the various blood samples, we also studied the effect of 2 doses of annexin A5 on TG triggered by low tissue factor (0.1 pM). Analysis indicated overall dose-dependent annexin A5 effects by prolonging the lagtime P1 (Figure 7D) and lowering the peak level P4 (Figure 7E). Per cluster of subjects, annexin A5 addition led to similar absolute but not relative decreases in peak level. These results, hence, pointed to different levels of RBC phosphatidylserine exposure in a cluster-dependent way, with particularly cluster 1 patients (sickle cell and hemolytic anemia) requiring high concentrations of annexin A5 to completely block the TG process.
Discussion
In this article, we described a manner of obtaining first-derivative, calibrated TG curves in 96-well plates, which, for the first time to our knowledge, allows for a complete quantitative comparison of this coagulation process in the whole blood and (platelet-rich) plasma from the same subjects. Our results revealed an initial role of RBC, a minor contribution of white blood cell, and a secondary contribution of activated platelets in the TG process. The annexin A5 inhibition and reconstitution studies indicated a priming role of RBC surface–expressed phosphatidylserine, with an additional contribution of the contact activation system. The observation of no reduction of TG by selectively annexin A5–treated RBCs is what we consider as proof-of-evidence of the high-affinity retainment of annexin A5 to RBC, unable to switch over to the phosphatidylserine-exposing platelets that are formed during the TG process. Kinetic analysis indicated that in whole blood, the supporting role of phosphatidylserine-exposing platelets was secondary to that of RBCs. Similarly, we found that common platelet antagonists were less effective in the blood than in PRP, whereas prior GPVI activation enhanced the platelet contribution.
The TG method based on complete TG curves we developed in this paper provides novel insight into the role of phosphatidylserine-exposing RBCs in the regulation of coagulation. An earlier subsampling method did not detect an initiating role of blood-borne tissue factor in whole blood coagulation, unless monocytes were prestimulated with lipopolysaccharide.16 In a follow-up study, it was concluded that TG negatively correlated with phosphatidylserine expression on RBC.4 In earlier studies from our group,19,23 no enhancing effect of RBC on TG could be identified, because the red cells and clots caused disturbances in the signal detection. In another method of TG measurement in mouse blood, the role of RBC was also not investigated because that work focused on coagulation amplification via factors XI and IX.39
For long, the examined link of RBC abnormalities with venous or arterial thrombotic complications have been suggestive for a procoagulant function of RBC.9,10,40 Our data indicate that at low trigger doses, the coagulation process develops faster in whole blood than in PRP. Furthermore, we found in reconstitution experiments that negative of positive manipulation of phosphatidylserine on RBC (with annexin A5 or ionomycin, respectively) markedly affected the TG process. Together, this strongly indicates that such RBC play an active role in the blood coagulation. Furthermore, we showed that phosphatidylserine-blocked RBC no longer supported a fast-onset TG, a role that could be taken over by GPVI-activated platelets. By inference, the procoagulant role of RBC may be most relevant under conditions of local blood stasis or in semistatic red venous blood clots.
Earlier papers did not find a role of white blood cell–derived (blood borne) tissue factor in the whole blood coagulation process.16,26 We confirmed this by checking the effect of factor VII inhibition on Rvv-X-activated blood samples. The expression of active tissue factor by platelets is still a matter of debate, with positive41 and negative42 evidences. A recent paper states that, especially in smaller platelets, its activity is antagonized by platelet-derived tissue factor pathway inhibitor (TFPI).43 Given the relatively high messenger RNA and protein expression of secretory TFPI in human platelets, when compared with tissue factor,44 our results may be explained by an overshoot of TFPI, for example, released by CRP-XL, thus preventing tissue factor activity in the whole blood or PRP.
In contrast, it appeared that pretreatment of blood with CTI delayed the TG process in (reconstituted) blood samples containing RBCs. Recently, it was reported that RBC-derived extracellular vesicles can trigger the contact activation by a classic factor XIIa-XI-IX pathway as well as by direct kallikrein activation of factor IX.45 Given the low levels of such vesicles seen in freshly isolated blood samples, we speculate that intact RBC can also have such an effect, likely in a phosphatidylserine-dependent way. However, this requires further research.
RBCs are, by far, the most abundant cells in blood circulation. Earlier papers indicated that a small fraction of about 0.5% of freshly isolated RBCs expose phosphatidylserine.2,46 In patients with polycythemia vera, phosphatidylserine exposure on isolated RBC can increase from 1.4% to 3.6%.47,48 The underlying process is known as eryptosis developed by aging, in vitro storage, and a variety of other conditions, inducing removal of the erythrocytes from the circulation.28,46 Mechanistically, RBC phosphatidylserine externalization is regulated by phospholipid transporters such as ATP11C7 and anoctamin-649; for instance, a mutation in the ATP11C gene associates with RBC dysfunction and hemolytic anemia.50 Furthermore, in congenital sickle cell disease, RBC dysfunction can lead to an anemic condition. In our view, comparative measurements of TG in blood and plasma samples can now help to better resolve how blood cell–associated abnormalities alter the coagulation process.
In this study, we noticed only a shallow dose-response to TG parameters for several coagulation triggers, particularly factor Xa. Our tentative explanation is that low factor Xa distributes among the relatively large surface of phosphatidylserine-expressing RBCs, thus preventing extra enforcement of the prothrombinase loop. An interesting finding was that PAR1 and PAR4 antagonists caused no more than small effects on the blood and PRP TG parameters. Recent work points to the formation of procoagulant platelets via S100A-protein interactions with GPIbα51 or via Fas ligand-receptor interactions.52 Such pathways may complement the roles of the platelet thrombin receptors, but this needs further examination.
Our findings in patients with (congenital) polycythemia vera or erythrocytosis with essentially normal blood cell counts showed similar TG responses as those from healthy controls, likely linked to the normalized the RBC counts during treatment. In contrast, we found a strong versatility in TG parameters in the heterogeneous group of patients with anemia (low RBC counts). In 3 patients with hemolytic anemia or congenital sickle cell disease, the high TG was dose dependently suppressed with annexin A5, supporting a procoagulant role for phosphatidylserine on RBC.
Several other clinical conditions can induce the hemostatic response, often linked to increased risk of thrombosis, such as antiphospholipid syndrome, heparin-induced thrombocytopenia, and SARS-CoV-2-induced infection.53 This suggests that qualitative and quantitative platelet traits also contribute to the overall coagulation profile. In those patients, whole blood TG can give better insight in the interplay between RBC, platelets, and the coagulation system.
Limitations of our study are the small number of patients with expected RBC abnormalities investigated. Especially the patients with anemia formed a heterogenous group with a wide variety of causes for the low RBC counts (Table 1). In contrast, the included patients with primary polycythemia showed normal RBC properties owing to periodic phlebotomy. Although our data suggest that the overall level of phosphatidylserine exposure in both quality and quantity determines the TG in patient blood samples, more work is needed to draw clinically relevant conclusions.
Acknowledgments
The authors thank F. Swieringa for providing assistance for the image study and L. Spiezia for collecting patient samples. The authors thank the volunteers who donated blood for this study.
S.S. and J.Z. received fundings from the China Scholarship Council (CSC201906220218 to S.S.and CSC201909370052 to J.Z.).
Authorship
Contribution: S.S. performed experiments, analyzed results, and drafted the manuscript; S.T. and J.Z. performed experiments and edited the manuscript; J.K., J.W., and D.H. provided technical support and edited the manuscript; D.I.F. analyzed experiments and edited the manuscript, C.P.M.R. provided reagents; P.G.d.G. and B.d.L. provided supervision and edited the manuscript; P.S. and E.C. recruited patients, collected blood samples, and edited the manuscript. J.W.M.H. and M.R. supervised the research and wrote the manuscript; and all authors approved the final version of the manuscript.
Conflict-of-interest disclosure: B.d.L., J.K., D.H., J.W., and M.R. are employees of the Synapse Research Institute Maastricht (member of the Stago Diagnostic group). P.G.d.G. and J.W.M.H. are advisers of the same institute. The remaining authors declare no competing financial interests.
Correspondence: Mark Roest, Synapse Research Institute, Koningin Emmaplein 7, 6217 KM Maastricht, The Netherlands; e-mail: m.roest@thrombin.com.
References
Author notes
∗E.C., J.Z., P.S., and J.W.M.H. contributed equally to this study.
The Excel macro to calculate whole blood TG parameters from crude measurements is freely available on request from the corresponding author, Mark Roest (m.roest@thrombin.com).
The full-text version of this article contains a data supplement.

