Key Points
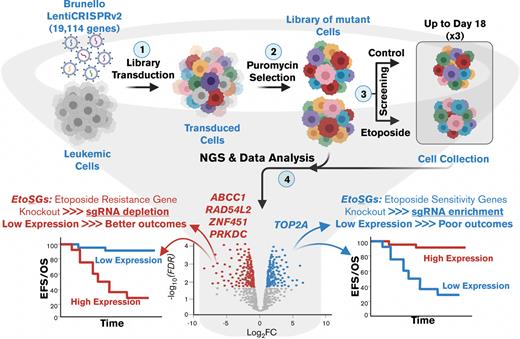
Integration of genome-wide CRISPR screen with gene expression and clinical outcomes could identify genetic modulators predictive of outcomes in AML.
RAD54L2, PRKDC, and ZNF451 were identified as novel markers associated with poor prognosis in pediatric AML and etoposide resistance.
Abstract
Etoposide is used to treat a wide range of malignant cancers, including acute myeloid leukemia (AML) in children. Despite the use of intensive chemotherapeutic regimens containing etoposide, a significant proportion of pediatric patients with AML become resistant to treatment and relapse, leading to poor survival. This poses a pressing clinical challenge to identify mechanisms underlying drug resistance to enable effective pharmacologic targeting. We performed a genome-wide CRISPR/Cas9 synthetic-lethal screening to identify functional modulators of etoposide response in leukemic cell line and integrated results from CRISPR-screen with gene expression and clinical outcomes in pediatric patients with AML treated with etoposide-containing regimen. Our results confirmed the involvement of well-characterized genes, including TOP2A and ABCC1, as well as identified novel genes such as RAD54L2, PRKDC, and ZNF451 that have potential to be novel drug targets. This study demonstrates the ability for leveraging CRISPR/Cas9 screening in conjunction with clinically relevant endpoints to make meaningful discoveries for the identification of prognostic biomarkers and novel therapeutic targets to overcome treatment resistance.
Introduction
Etoposide is a potent antineoplastic agent that inhibits topoisomerase II (TOP2) and disrupts DNA damage repair, resulting in the accumulation of single- or double-strand DNA breaks. Mechanistically, etoposide forms a stabilized complex with TOP2 and DNA, which prevents ligation of cleaved DNA strands, thus inhibiting DNA replication and transcription and triggering apoptotic cell death.1 Etoposide is used to treat a wide variety of malignant neoplasms, including pediatric acute myeloid leukemia (AML). Upon the diagnosis of pediatric AML, induction therapy is initiated and typically consists of a combination of cytarabine, an anthracycline such as daunorubicin, and etoposide (ADE).2,3 Although a significant proportion of treated children have an enduring remission, ∼40% of children with AML relapse.4 Approximately 90% of patients with resistant or relapsed AML die within 3 years, highlighting a critical unmet need to elucidate the molecular mechanisms underlying drug resistance and develop alternative therapeutic strategies.5,6
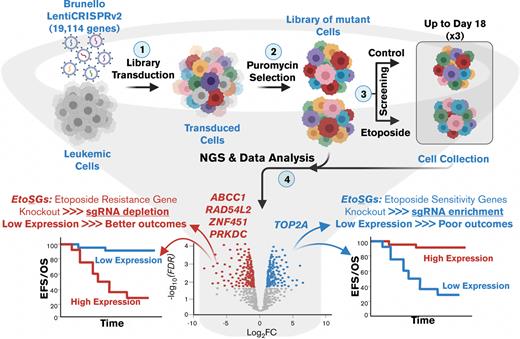
The use of pooled single-guide RNAs (sgRNAs) in genome-wide CRISPR/Cas9 knockout functional genomic screens is revolutionizing mechanistic investigations into the mechanisms underlying cancer and chemotherapy resistance.7,8 Several genome-wide CRISPR screens in existing established myeloid leukemia cell lines have identified genes and pathways likely involved in the pathogenesis and treatment response of AML.9-11 Unfortunately, a significant limitation of these studies is the consideration or integration of the relevance of the results from CRISPR screens with treatment-related clinical outcomes in pediatric patients with AML. To identify the functional components involved in the cellular response to etoposide, an unbiased loss-of-function CRISPR screen was carried out in human K-562 cells for treatment periods of up to 18 days. The results were integrated with genome-wide gene expression data and clinical outcomes data from patients treated in the St. Jude’s pediatric AML clinical trial (AML02) to identify clinically and functionally significant biomarkers of etoposide sensitivity/resistance.
Methods
Generation of CRISPR-sgRNA library pool and in vitro CRISPR screening
The genome-wide CRISPR/Cas9-KO Brunello library (#73179, Addgene) targeting 19 114 genes with 76 441 unique sgRNAs was used to perform CRISPR screening in K-562 cells.12 HEK-293T cells were used to produce lentivirus by cotransfection with the Brunello library plasmids and the packaging plasmid psPAX2 (#12260, Addgene) and envelope plasmid pMD2.G (#12259, Addgene). K-562 cells were maintained in RPMI-1640 with GlutaMAX and 10% fetal bovine serum (FBS) (Gibco); and HEK-293 cells were maintained in DMEM with GlutaMAX and 10% FBS (Gibco).
K-562 cells (100 × 106) were transduced with the CRISPR lentiviral library at a low multiplicity of infection of ∼0.3 using 10 μL of lentiviral library and 8 μmg/mL polybrene (Sigma-Aldrich) in 12-well plates with 2.5 × 10⁶ cells per well. The plates were spinfection-transducted at 1000×g centrifuging speed for 2 hours at 34°C. Following spinfection, all cells were resuspended to remove polybrene and nontransfected virus, and pooled in fresh media. After a 48-hour recovery period, the pooled cells were treated with puromycin (2 μg/mL) for 7 days to eliminate nontransduced cells before drug introduction, at which point the transduced cell population was split into the vehicle (DMSO) or 0.1 μM (IC30 of etoposide at 48 hours treatment) etoposide (#S1225, Selleck Chemicals). Experimental treatments under all conditions were performed in triplicate with aliquots of 30 × 106 cells to provide 400× coverage of the library. Cells were counted and subcultured, and fresh media and drugs were replenished every 2 to 3 days. A total of 30 × 106 cells from each replicate condition on day 0 (after puromycin selection), day 4, day 12, and day 18 were collected for genomic DNA extraction.
Next-generation sequencing (NGS)
Genomic DNA was extracted from cell pellets using the PureLink Genomic DNA Mini Kit (#K1820-0, Invitrogen). The pool of sgRNA amplicons was amplified and multiplexed using a 1-step polymerase chain reaction (PCR) method that used reverse primers with unique barcodes and a common forward primer (supplemental Table 6). A total of ∼100 μg DNA (8.3 μg DNA per reaction with 12 reactions per sample) was amplified using NEBNext High-Fidelity 2X PCR Master Mix (#M0541L, New England Biolabs) kit with PCR conditions as follows: 98°C/3 min; 25 cycles of 98°C/10 s, 60°C/17 s, 72°C/25 s, and 72°C/2 min. All 12 PCR reactions for each sample were pooled, and the amplicons’ quality was determined using gel electrophoresis in 2% agarose and analyzed on an Agilent 2100 bioanalyzer with an expected amplicon size of ∼256 bp. A Qubit fluorometer (Thermo Fisher Scientific) was used to quantify individual samples labeled with different indices. All samples were then pooled in equimolar amounts and were deep sequenced using the Illumina Hiseq 4000 platform at the QB3-Berkeley facility (University of California, Berkeley).
CRISPR/Cas9 screen NGS analysis and pathway and protein-protein interaction (PPI) networks analysis
Following de-multiplexing, the abundance of each sgRNA was determined between samples using the MAGeCK (version 0.5.9.4) algorithm with robust ranking aggregation for pairwise comparisons, and the time-dependent etoposide genes were assessed using maximum likelihood estimation (MLE).13,14 Genes with a false discovery rate (FDR) score of <0.1 were defined as significant.
The functional pathways of all significant genes were compared at each time point to their corresponding etoposide sensitivity/resistance using the R package ClusterProfiler version 4.0.15 Additionally, the ingenuity pathway analysis (IPA) tool was used to determine shared canonical pathways and clustered hierarchical pathways. A PPI network was also constructed using the STRING network (version 11.0)16 through Cytoscape (version 3.8.2).
Clinical outcomes association with leukemic cell gene expression in pediatric AML
Patients (n = 163) from the St. Jude AML02 clinical trial (NCT00136084) with diagnostic gene expression (Affymetrix U133A microarray)2,17 were included in this study to evaluate significant genes from CRISPR screen. Within this cohort, pediatric patients with de novo AML were randomly assigned to receive either high- or low-dose cytarabine in combination with daunorubicin and etoposide as their initial course of chemotherapy, with subsequent treatments tailored to their response and risk classification. Gene expression association analysis with clinical endpoints included minimal residual disease after induction 1 (MRD1), event-free survival (EFS), overall survival (OS), and relapsed/refractory disease (RR). Logistic regression was used to estimate the odds ratio (OR) of MRD1, whereas the Kaplan-Meier method and Cox proportional hazards were used to estimate the hazard ratio (HR) of EFS and OS. Gray’s method was used to estimating cumulative incidence HR of RR. The study was conducted in accordance with both the St. Jude Children’s Research Hospital and the University of Florida’s institutional review board and conducted in accordance with the Declaration of Helsinki.
In vitro small interfering RNA (siRNA)–mediated knockdown functional validation of TOP2A, RAD54L2, PRKDC, and ZNF451
Accell SMARTpool human siRNA targeting genes of interest and scrambled control (Dharmacon) were used to transfect Kasumi-1, THP-1, MOLM-13, and KG-1 AML cells using the company-recommended protocol. Kasumi-1, THP-1, and MOLM-13 were maintained in RPMI-1640 GlutaMAX with 20%, 10%, and 10% FBS (Gibco), respectively. THP-1 medium had additional 0.05 mM 2-mercaptoethanol (Sigma-Aldrich). KG-1 was maintained in IMDM GlutaMax with 20% FBS (Gibco). All cell line media were supplemented with 1% penicillin-streptomycin (Corning).
After siRNA transfection, ∼10 000 cells were treated with etoposide or dimethyl sulfoxide as control in triplicate, and cell viability was determined 48 hours after drug exposure using a viability kit with CellTiter-Glo 2.0 assay (Promega). In addition, aliquots of cells were collected to determine the efficiency of gene expression knockdown for the respective genes. The RNeasy Plus Micro Kit (#74034, Qiagen) was used to isolate total RNA, and cDNA was generated using the High-Capacity cDNA Reverse Transcription Kit (#4368814, Applied Biosystems). Gene expression levels were quantitated using TaqMan Gene Expression Master Mix (#4370048, Applied Biosystems) with QuantStudio 3. The ΔΔCt method was used to determine the relative difference in messenger RNA levels between samples, with GAPDH serving as housekeeping gene. The siRNAs target sequences and TaqMan gene expression probes are listed in supplemental Table 7.
Results
CRISPR genome-wide screening reveals etoposide chemosensitivity determinants
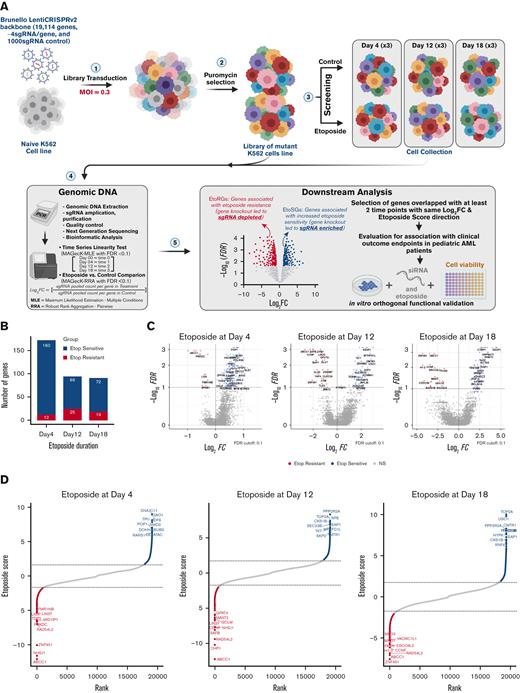
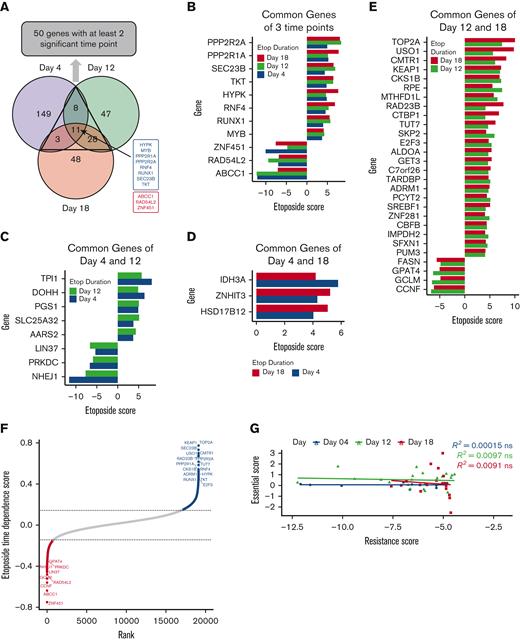
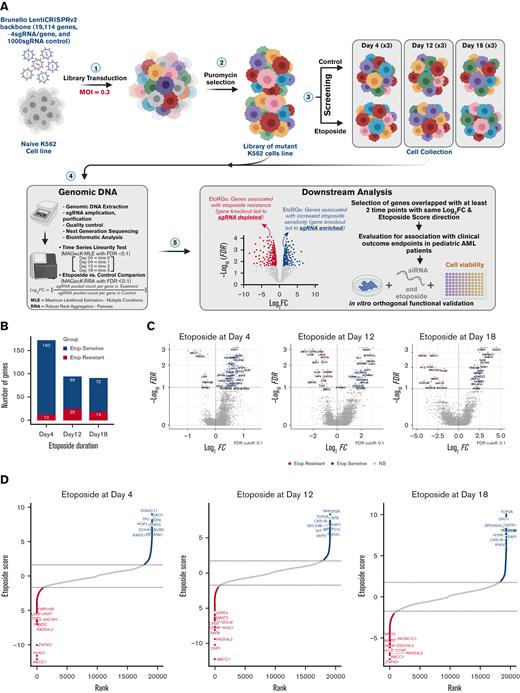
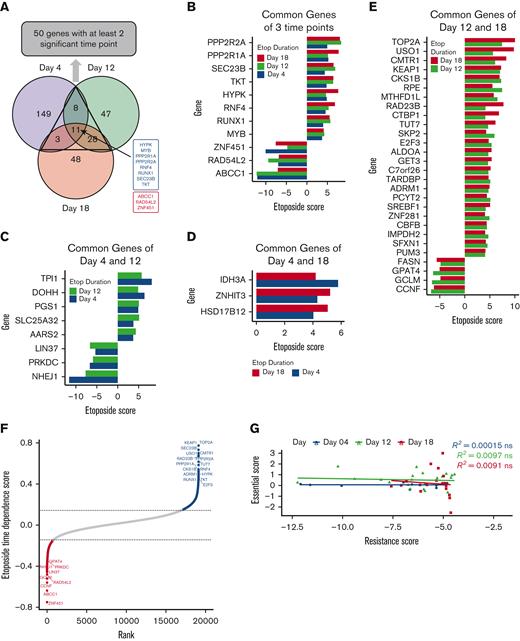
The overall study schema is summarized in Figure 1A, and continuous etoposide exposures ranging from early (day 4) to intermediate (day 12) to long term (day 18) were used to identify genes capable of modulating initial etoposide response, and those genes that conferred differential response to longer exposure drug treatment. At the FDR < 0.1 cutoff, 12, 25, and 19 genes were associated with etoposide resistance (sgRNAs depletion = etoposide resistance genes, EtoRGs), and 160, 69, and 72 genes were associated with increased etoposide sensitivity (sgRNAs enrichment = etoposide sensitive genes, EtoSGs) at days 4, 12 and 18, respectively (supplemental Table 1; Figure 1B). Volcano plots in Figure 1C and both positive and negative selection rank plots in Figure 1D depict the significant genes at each time point. Through comparison across all time points, we identified 50 genes with consistent direction of significance at a minimum of 2 time points (Figure 2A-E; supplemental Table 2). Disruption of 3 genes, ABCC1, RAD54L2, and ZNF451, was associated with etoposide resistance, and disruption of 8 genes, PPP2R2A, PPP2R1A, SEC23B, TKT, HYPK, RNF4, RUNX1, and MYB, was associated with increased sensitivity to etoposide across all time points (Figure 2B). Interestingly, several genes were associated only with the early time points (day 4 and day 12) but were not identified as significant after 18 days of etoposide exposure. TPI1, DOHH, PGS1, SLC25A32, and AARS2 were EtoSGs, whereas LIN37, PRKDC, and NHEJ1 were EtoRGs at day 4 and day 12 (Figure 2C). Similarly, we identified a subset of genes that was only identified after longer etoposide exposure of 12 and 18 days. Four genes (FASN, GPAT4, GCLM, and CCNF) were EtoRGs, and 24 genes were EtoSGs including TOP2A, a known target of etoposide, and other notable genes such as KEAP1, involved in the Nrf2-KEAP1 pathway; USO1, a vesicle transport factor; and CMTR1, a methyltransferase (Figure 2E).
Summary of significant genes hit from etoposide CRISPR screen. (A) CRISPR/Cas9 loss-of-function screening overall schema. (B) Significant genes were identified by CRISPR screen at day 4 (early), day 12 (intermediate), and day 18 (late) in response to etoposide exposures, with EtoSGs highlighted in blue and EtoRGs highlighted in red (FDR < 0.1). (C) Volcano plots of gene hits with log2(FC) values between the 3 exposures times of etoposide. (D) Rank plots of the top 10 EtoRGs and EtoSGs with their respective etoposide scores across 3 time points, with a higher negative score indicating increased etoposide resistance and a higher positive score indicating increased etoposide sensitivity. EtoRGs, etoposide resistance genes; EtoSGs, etoposide sensitive genes.
Summary of significant genes hit from etoposide CRISPR screen. (A) CRISPR/Cas9 loss-of-function screening overall schema. (B) Significant genes were identified by CRISPR screen at day 4 (early), day 12 (intermediate), and day 18 (late) in response to etoposide exposures, with EtoSGs highlighted in blue and EtoRGs highlighted in red (FDR < 0.1). (C) Volcano plots of gene hits with log2(FC) values between the 3 exposures times of etoposide. (D) Rank plots of the top 10 EtoRGs and EtoSGs with their respective etoposide scores across 3 time points, with a higher negative score indicating increased etoposide resistance and a higher positive score indicating increased etoposide sensitivity. EtoRGs, etoposide resistance genes; EtoSGs, etoposide sensitive genes.
Integration of significant genes hit across 3 time points of etoposide exposures. (A) Venn diagram of significant genes identified by CRISPR screening at day 4 (purple), day 12 (green), and day 18 (orange), with 8 EtoSGs (blue) and 3 EtoRGs (red), were common at all time points. (B) Eleven EtoSGs/EtoRGs at all time points of etoposide exposure. (C) Eight EtoSGs/EtoRGs at day 4 and day 12 of etoposide exposure. (D) Three EtoSGs/EtoRGs at day 4 and day 18 of drug exposure. (E) Twenty-eight EtoSGs/EtoRGs at day 12 and day 18 of etoposide exposure. (F) Twenty-five significant genes with etoposide time dependence score derived from MAGeCK-MLE, where fitting time linearity of etoposide score with time points of day 0 (time 0), day 4 (time 1), day 12 (time 2), and day 18 (time 3), where high etoposide time dependence score indicating genes exhibit consistent etoposide response changes. All significant genes were identified at FDR < 0.1. (G) Spearman rank correlation between significant EtoRGs genes with only negative etoposide score (resistance score) and their corresponding essential score at each time point. The etoposide score was determined by comparing etoposide to vehicle control at each time point, whereas the essential score was determined by comparing vehicle control at each time point to day 0, with “ns” indicating P > .05.
Integration of significant genes hit across 3 time points of etoposide exposures. (A) Venn diagram of significant genes identified by CRISPR screening at day 4 (purple), day 12 (green), and day 18 (orange), with 8 EtoSGs (blue) and 3 EtoRGs (red), were common at all time points. (B) Eleven EtoSGs/EtoRGs at all time points of etoposide exposure. (C) Eight EtoSGs/EtoRGs at day 4 and day 12 of etoposide exposure. (D) Three EtoSGs/EtoRGs at day 4 and day 18 of drug exposure. (E) Twenty-eight EtoSGs/EtoRGs at day 12 and day 18 of etoposide exposure. (F) Twenty-five significant genes with etoposide time dependence score derived from MAGeCK-MLE, where fitting time linearity of etoposide score with time points of day 0 (time 0), day 4 (time 1), day 12 (time 2), and day 18 (time 3), where high etoposide time dependence score indicating genes exhibit consistent etoposide response changes. All significant genes were identified at FDR < 0.1. (G) Spearman rank correlation between significant EtoRGs genes with only negative etoposide score (resistance score) and their corresponding essential score at each time point. The etoposide score was determined by comparing etoposide to vehicle control at each time point, whereas the essential score was determined by comparing vehicle control at each time point to day 0, with “ns” indicating P > .05.
Furthermore, MAGecK-MLE analysis identified 25 genes with significant time-dependent trends toward sgRNA enrichment or depletion as drug exposure time increased (Figure 2F). To rule out the impact of cell essentiality in EtoRGs, we further performed correlation analysis between the essential scores (essential scores were computed by comparing control at days 4, 12, or 18 vs day 0) and etoposide resistance scores (negative scores of etoposide vs control at all time points). As shown in Figure 2G, no significant correlation was observed between essential and etoposide resistance scores, implying that genes associated with etoposide resistance were not among the genes essential for cell survival within our screen.
Pathway analysis identifies distinct functions among etoposide resistance and sensitive genes
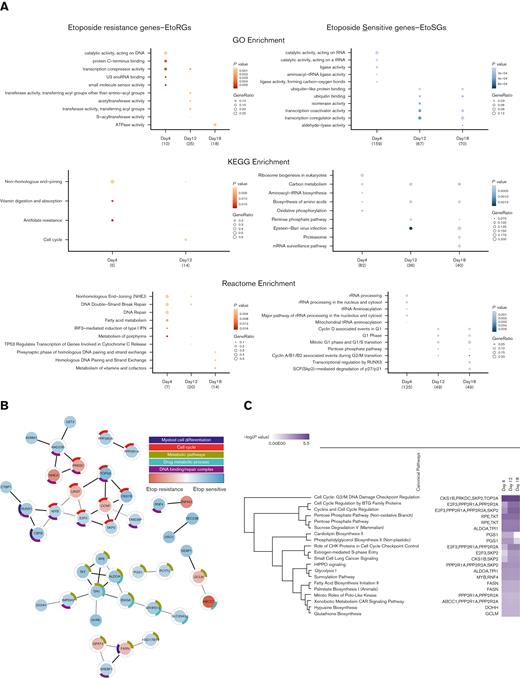
Significant EtoRGs and EtoSGs candidates from days 4, 12, and 18 were evaluated for functional relevance using GO, KEGG, and Reactome databases. For shorter exposure time of day 4, EtoRGs were enriched in DNA damage/repair pathways and fatty acid metabolism and EtoSGs were enriched in rRNA processing, and ribosome biogenesis (Figure 3A; supplemental Table 3). For days 12 and 18, EtoRGs were enriched in acyltransferase, cell cycle, ATPase activity, and metabolism of vitamins and cofactors, and EtoSGs were enriched in amino acid biosynthesis, transcription activity, and cell cycle activity (Figure 3A; supplemental Table 3). From the STRING network and IPA analysis (Figure 3B-C; supplemental Table 4), genes with corresponding protein roles in the cell cycle included CKS1B, PPP2R1A, PPP2R2A, E2F3, SKP2, TOP2A, and LIN37; genes with a role in DNA damage repair included TOP2A, PRKDC, NHEJ1, and RUNX1; and CBFB and MYB with roles in AML biology. PPP2R1A and PPP2R2A both have roles in multiple signaling pathways such as the ATM, ERK/MAPK, mTOR, Wnt/B catenin, and HIPPO signaling pathways. Multiple modulator genes mapped to metabolic pathways including the FASN (fatty acid synthase) gene, which is involved in the fatty acid biosynthesis; TKT and RPE, with a role in the pentose phosphate pathway; GCLM involved in glutathione biosynthesis and γ-glutamyl cycle; IMPDH2 involved in purine nucleotide metabolism; ALDOA and TPI1 with roles in glycolysis, gluconeogenesis, and sucrose metabolism; DOHH with a role in hypusine biosynthesis; MTHFD1L involved in histidine degradation and folate transformation; PCYT2 involved in phosphatidylethanolamine synthesis; and PGS1 with roles in cardiolipin and phosphatidylglycerol biosynthesis.
Functional pathway enrichment and PPI of the candidate genes. (A) Functional pathway enrichment with GO, KEGG, and Reactome comparing across all time points of significant EtoRGs (12 genes for day 4, 25 genes for day 12, 19 genes for day 18) and EtoSGs (160 genes for day 4, 69 genes for day 12, 72 genes for day 18). (B) STRING PPI network of 50 genes with at least 2 significant time points (nodes represent proteins, and edges connecting nodes represent interaction with concealing singletons). (C) The IPA canonical pathway hierarchical clustering of 50 significant candidate genes over 3 time points reveals shared canonical pathways (FDR < 0.05).
Functional pathway enrichment and PPI of the candidate genes. (A) Functional pathway enrichment with GO, KEGG, and Reactome comparing across all time points of significant EtoRGs (12 genes for day 4, 25 genes for day 12, 19 genes for day 18) and EtoSGs (160 genes for day 4, 69 genes for day 12, 72 genes for day 18). (B) STRING PPI network of 50 genes with at least 2 significant time points (nodes represent proteins, and edges connecting nodes represent interaction with concealing singletons). (C) The IPA canonical pathway hierarchical clustering of 50 significant candidate genes over 3 time points reveals shared canonical pathways (FDR < 0.05).
RAD54L2, PRKDC, and ZNF451 are novel markers associated with poor prognosis in the context of pediatric AML and etoposide resistance
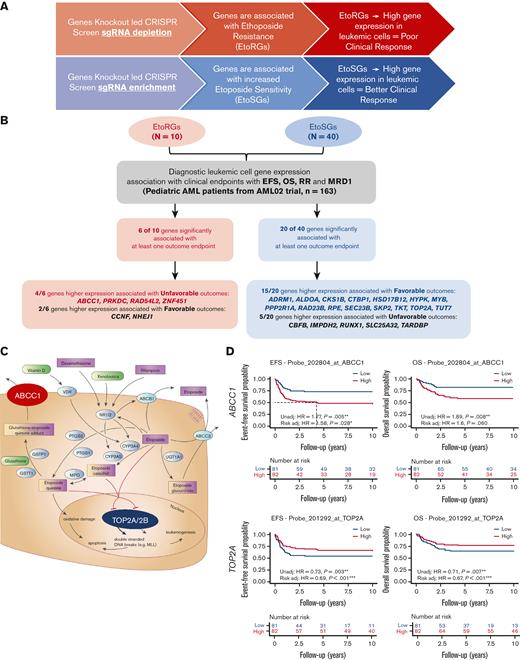
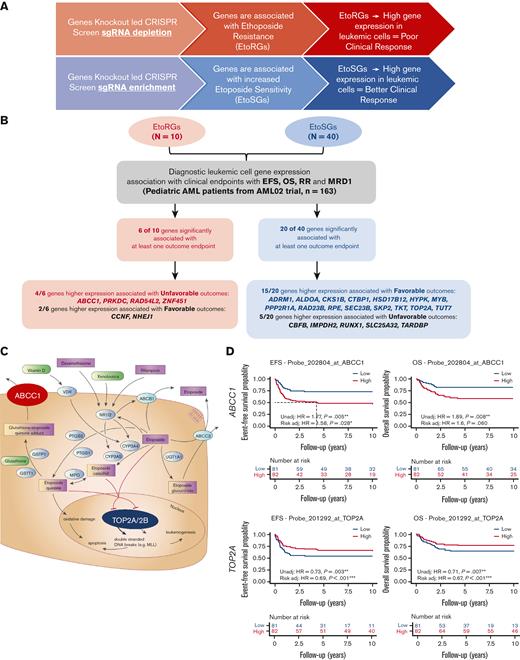
The 50 genes with significant results from at least 2 time points in the CRISPR screen (Figure 2A) were further evaluated for association with multiple clinical endpoints. Given that initial cytogenetics-based risk assignment (low, intermediate, and high) is a well-established predictor of outcomes, we performed gene expression and clinical outcomes associations with and without adjustment for initial risk group assignment (patient characteristics are provided in supplemental Table 5). Of the 50 genes evaluated, 26 genes showed significant associations between gene expression levels and at least 1 clinical outcome endpoint (P < .05), with 19 genes meeting the following 2 criteria: (1) significant association between gene expression with at least one clinical outcome (P < .05) and (2) consistent direction of relationships between CRISPR screen and gene expression–clinical outcomes pairs. These 19 genes represent clinically and biologically important etoposide genes (ie, EtoRGs with higher expression should be associated with poor outcomes in patients with AML; and EtoSGs with higher expression should be associated with favorable outcomes in patients with AML). Among 19 genes that passed these 2 criteria (Figure 4A-B, Table 1), 4 EtoRGs (ABCC1, PRKDC, RAD54L2, and ZNF451) demonstrated higher leukemic cell gene expression associated with poor outcomes, and 15 EtoSGs (ADRM1, ALDOA, CKS1B, CTBP1, HSD17B12, HYPK, MYB, PPP2R1A, RAD23B, RPE, SEC23B, SKP2, TKT, TOP2A, and TUT7) demonstrated higher leukemic cell gene expression associated with better outcomes in pediatric patients with AML.
Clinical relevance of etoposide CRISPR screen and etoposide pharmacology genes. (A) Schematic showing anticipated relationship between significant hits from CRISPR screen and association with clinical outcome in AML. (B) Flowchart and summary results of association analysis between diagnostic leukemic cell gene expression levels of EtoRGs (n = 10 genes) and EtoSGs (n = 40 genes) with 4 clinical outcome endpoints (EFS, OS, RR, and MRD1) in pediatric patients with AML from St Jude AML02 trial. Twenty-six genes significantly associated with at least 1 clinical outcome (P < .05 in Cox proportional hazard, fine method of Gray, and logistic regression) are listed; of these, 19 showed significant association with consistent direction. (C) Etoposide pharmacology pathway (PharmGKB.org) highlighting roles of ABCC1 and TOP2A. (D) Kaplan-Meier survival curves showing high ABCC1 expression and low TOP2A expression associated with poor OS and EFS (∗, ∗∗, ∗∗∗ indicate significant terms at the P < .05, P < .01, and P < .001 statistical levels, respectively). Gene expression association analysis was performed with (referred as Risk adj) or without adjusting (referred as Unadj) for initial risk–group assignment.
Clinical relevance of etoposide CRISPR screen and etoposide pharmacology genes. (A) Schematic showing anticipated relationship between significant hits from CRISPR screen and association with clinical outcome in AML. (B) Flowchart and summary results of association analysis between diagnostic leukemic cell gene expression levels of EtoRGs (n = 10 genes) and EtoSGs (n = 40 genes) with 4 clinical outcome endpoints (EFS, OS, RR, and MRD1) in pediatric patients with AML from St Jude AML02 trial. Twenty-six genes significantly associated with at least 1 clinical outcome (P < .05 in Cox proportional hazard, fine method of Gray, and logistic regression) are listed; of these, 19 showed significant association with consistent direction. (C) Etoposide pharmacology pathway (PharmGKB.org) highlighting roles of ABCC1 and TOP2A. (D) Kaplan-Meier survival curves showing high ABCC1 expression and low TOP2A expression associated with poor OS and EFS (∗, ∗∗, ∗∗∗ indicate significant terms at the P < .05, P < .01, and P < .001 statistical levels, respectively). Gene expression association analysis was performed with (referred as Risk adj) or without adjusting (referred as Unadj) for initial risk–group assignment.
With respect to genes implicated in etoposide pharmacology pathway (Figure 4C) and consistent with CRISPR screen results, increased ABCC1 (drug efflux transporter) expression was associated with a worse EFS and OS in our AML02 cohort (EFS HR, 1.77; 95% confidence interval [CI], 1.19-2.63, P = .005; with risk-adjusted HR, 1.58; 95% CI, 1.05-2.36, P = .028; OS HR, 1.89; 95% CI, 1.18-3.02, P = .008; with risk-adjusted HR, 1.6; 95% CI, 0.98-2.59, P = .06) (Figure 4C-D). Increased ABCC1 expression was also associated with positive MRD1 (OR, 2.99; 95% CI, 1.66-5.39, P < .001; with risk-adjusted OR, 2.33; 95% CI, 1.23-4.42, P = .009) (supplemental Figure 1). In contrast, TOP2A expression was consistent with its biological role as a etoposide target or EtoSGs identified in our CRISPR screen, where increased expression was associated with an improved EFS and OS in the AML02 cohort (EFS HR, 0.73; 95% CI, 0.59-0.9, P = .003; with risk-adjusted HR, 0.69 95% CI, 0.56-0.84, P < .001; OS HR, 0.71; 95% CI, 0.56-0.91, P = .007; with risk-adjusted HR, 0.67; 95% CI, 0.53-0.85, P < .001) (Figure 4C-D).
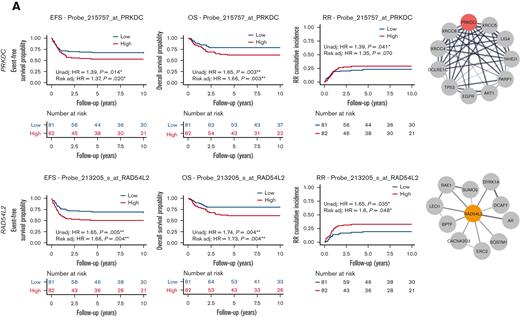
Several other EtoRGs implicated in cellular etoposide resistance were identified during our screen. For instance, higher PRKDC expression was associated with poor EFS, OS, and RR (EFS HR, 1.39; 95% CI, 1.07-1.82, P = .14; with risk-adjusted HR, 1.37; 95% CI, 1.05-1.8, P = .02; OS HR, 1.65; 95% CI, 1.19-2.28, P = .003; with risk-adjusted HR, 1.66; 95% CI, 1.19-2.32, P = .003; and RR HR, 1.39; 95% CI, 1.01-1.9, P = .041; with risk-adjusted HR, 1.35; 95% CI, 0.98-1.87, P = .07) (Figure 5A). Similarly, higher expression of RAD54L2 was associated with inferior EFS, OS, MRD1, and RR (EFS HR, 1.65; 95% CI, 1.17-2.33, P = .005; with risk-adjusted HR, 1.66; 95% CI, 1.18-2.34, P = .004; OS HR, 1.74; 95% CI, 1.19-2.54, P = .004; with risk-adjusted HR, 1.73; 95% CI, 1.19-2.52, P = .004; RR HR, 1.65; 95% CI, 1.04-2.64, P = .035; with risk-adjusted HR, 1.6; 95% CI, 1-2.55, P = .048; Figure 5A; MRD1 OR, 1.7; 95% CI, 1.04-2.78, P = .036; with risk-adjusted OR, 1.86; 95% CI, 1.06-3.24, P = .029; supplemental Figure 1). RAD54L2 is a DNA helicase that interacts with prosurvival genes and negatively regulates the apoptotic process, including DYRK1A, as demonstrated in the STRING network (Figure 5A). The fourth EtoRG, ZNF451, also known as ZATT, is an SUMO ligase that has been implicated in the resolution of TOP2 DNA-protein crosslinks.18,19 In this study, we observed that increased ZNF451 expression was associated with a greater odds of positive MRD1 (OR, 1.7; 95% CI, 1.06-2.73, P = .026; with risk-adjusted OR, 1.69; 95% CI, 1.02-2.8, P = .043; supplemental Figure 1).
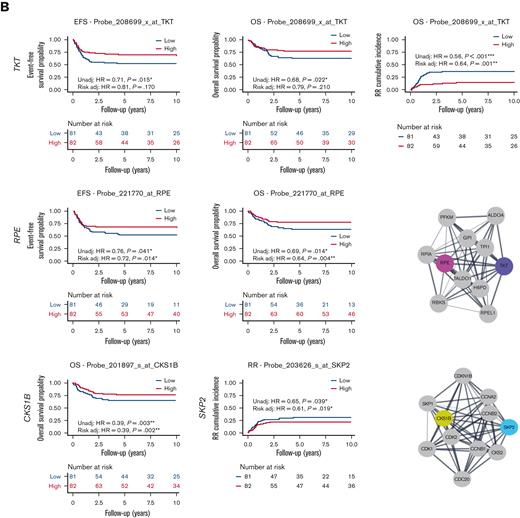
Association of etoposide genes from CRISPR screen with outcome in pediatric AML. (A) High expression of EtoRGs: PRKDC and RAD54L2 showed unfavorable EFS, OS, and RR in pediatric AML. (B) High expression of EtoSGs: TKT with favorable EFS, OS, and RR; RPE with better EFS and OS; CSK1B with favorable OS; and SKP2 with lower RR in pediatric patients with AML treated in AML02 trial. Corresponding STRING networks showed interactions with respective genes with other genes. (∗, ∗∗, ∗∗∗ indicate significant terms at the P < .05, P < .01, and P < .001 statistical levels, respectively). Gene expression association analysis was performed with (referred as Risk adj) or without adjusting (referred as Unadj) for the initial risk group assignment.
Association of etoposide genes from CRISPR screen with outcome in pediatric AML. (A) High expression of EtoRGs: PRKDC and RAD54L2 showed unfavorable EFS, OS, and RR in pediatric AML. (B) High expression of EtoSGs: TKT with favorable EFS, OS, and RR; RPE with better EFS and OS; CSK1B with favorable OS; and SKP2 with lower RR in pediatric patients with AML treated in AML02 trial. Corresponding STRING networks showed interactions with respective genes with other genes. (∗, ∗∗, ∗∗∗ indicate significant terms at the P < .05, P < .01, and P < .001 statistical levels, respectively). Gene expression association analysis was performed with (referred as Risk adj) or without adjusting (referred as Unadj) for the initial risk group assignment.
We similarly evaluated the associations between clinical outcomes and gene expression of EtoSGs other than TOP2A such as TKT and RPE, which are members of the pentose phosphate pathway. High leukemic cell expression of TKT was associated with better EFS, OS, and RR (EFS HR, 0.71; 95% CI, 0.54-0.94, P = .015; with risk-adjusted HR, 0.81; 95% CI, 0.6-1.09, P = .17; OS HR, 0.68; 95% CI, 0.49-0.95, P = .022; with risk-adjusted HR, 0.79; 95% CI, 0.55-1.14, P = .21; RR HR, 0.56; 95% CI, 0.44-0.72, P < .001; with risk-adjusted HR, 0.64; 95% CI, 0.49-0.83, P = .001; Figure 5B). High leukemic cell expression RPE expression was also associated with favorable EFS and OS (EFS HR, 0.76; 95% CI, 0.59-0.99, P = .041; with risk-adjusted HR, 0.72; 95% CI, 0.55-0.93, P = .014; OS HR, 0.69; 95% CI, 0.51-0.93, P = .014; with risk-adjusted HR, 0.64; 95% CI, 0.47-0.87, P = .004; Figure 5B). We also observed higher expression levels of CKS1B to be associated with an improved OS (HR, 0.39; 95% CI, 0.21-0.72, P = .003 with risk-adjusted HR, 0.39; 95% CI, 0.21-0.71, P = .002), and higher SKP2 expression to be associated with an improved RR (HR, 0.65; 95% CI, 0.43-0.98, P = .039; with risk-adjusted HR, 0.61; 95% CI, 0.41-0.92, P = .019; Figure 5B). Interactions with other proteins using the STRING network are also shown in Figure 5A-B for PRKDC, RAD54L2, TKT, RPE, CSK1B, and SKP2 (of note, TKT interacts with RPE and CSK1B interacts with SKP2).
We further evaluated the 19 genes meeting the 2 criteria for representation among the commonly essential and core fitness genes identified in diverse cancers using the Cancer Dependency Map (DepMap) 21Q2 and Hart et al.20-22 Eight of the genes were previously identified as commonly essential and/or core essential genes in these resources, whereas 11 of the genes identified through the etoposide screen were not (supplemental Figure 2A). With further evaluation of essentiality in specific tumors or cell types, RAD54L2 was identified as a leukemic-dependent gene using the CHRONOS dependency score (lower score indicates greater dependency/essentiality) on 982 cancer cell lines from the DepMap 21Q2 but not ZNF451, PRKDC, ABCC1, or TOP2A (supplemental Figure 2B-F).
siRNA-mediated knockdown confirmed the altered cellular sensitivity of RAD54L2, PRKDC, and ZNF451 to etoposide in AML cell lines.
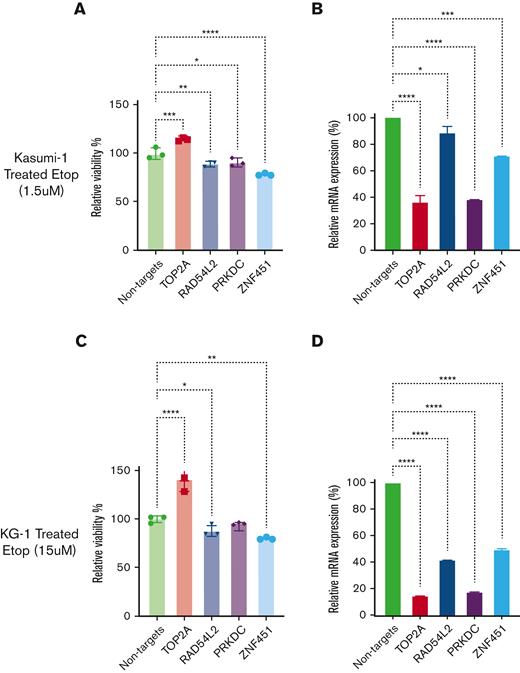
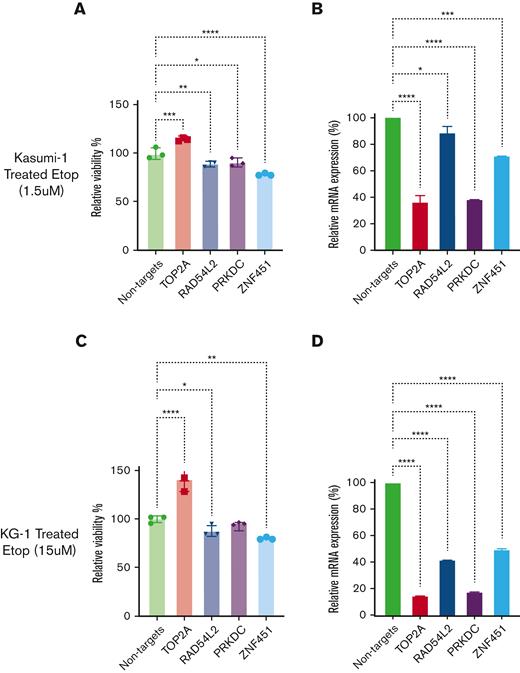
siRNA-mediated knockdown of RAD54L2, PRKDC, or ZNF451 expression increased cellular sensitivity to etoposide, whereas siRNA-mediated knockdown of TOP2A expression further increased the cellular resistance to etoposide in Kasumi-1 cells (Figure 6A-B). Similar results for TOP2A, RAD54L2, and ZNF451 were observed in KG-1 cells (Figure 6C-D). For THP-1 and MOLM-13 AML cells, we observed a similar impact of ZNF451 knockdown on etoposide sensitivity (supplemental Figure 3).
Impact of siRNA-mediated knockdown of TOP2A, RAD54L2, PRKDC, and ZNF451 on etoposide sensitivity. (A and C) The bar plots depict the effect of siRNA-mediated knockdown on etoposide sensitivity in relative cell viability (%) for Kasumi-1 (A) and KG-1 (C) cells. (B and D) Confirmations of siRNA knockdown are shown in relative messenger RNA expression (%) by quantitative PCR for Kasumi-1 (B) and KG-1(D) cells. Data are presented as mean ± standard deviation. Relative cell viability bar plots are representative with 3 technical replicates for each sample, whereas quantitative PCR experiments included 2 technical replicates for each sample. (∗, ∗∗, ∗∗∗, ∗∗∗∗ indicate significant terms at the P < .05, P < .01, P < .001, and P < .0001 statistical levels, respectively).
Impact of siRNA-mediated knockdown of TOP2A, RAD54L2, PRKDC, and ZNF451 on etoposide sensitivity. (A and C) The bar plots depict the effect of siRNA-mediated knockdown on etoposide sensitivity in relative cell viability (%) for Kasumi-1 (A) and KG-1 (C) cells. (B and D) Confirmations of siRNA knockdown are shown in relative messenger RNA expression (%) by quantitative PCR for Kasumi-1 (B) and KG-1(D) cells. Data are presented as mean ± standard deviation. Relative cell viability bar plots are representative with 3 technical replicates for each sample, whereas quantitative PCR experiments included 2 technical replicates for each sample. (∗, ∗∗, ∗∗∗, ∗∗∗∗ indicate significant terms at the P < .05, P < .01, P < .001, and P < .0001 statistical levels, respectively).
Discussion
The development of drug resistance to chemotherapeutic agents represents a major barrier to maintaining clinical remission in pediatric AML. Recently, the use of genome-wide CRISPR/Cas9-based genetic perturbation screening is rapidly expanding our ability to understand the molecular mechanisms of cancer, as well as to identify pathways of cellular responses to therapeutic agents. Despite these efforts, a critical gap remains in establishing a link between the molecular features identified in the CRISPR-based drug screen and their impact on clinical outcomes in patients. In this study, we performed a genome-wide genetic perturbation screen in the K-562 cell line with exposure to etoposide for 4, 12, and 18 days and established EtoRGs and EtoSGs. At shorter drug exposure times, we observed significant enrichment in genes implicated in DNA damage repair pathways, whereas longer drug exposure showed enrichment of several metabolic pathways. As expected, some of the top genes from our CRISPR screen were the well-established genes TOP2A, the target of the etoposide,23 and ABCC1, an efflux transporter, implicated in etoposide efflux24; thus, validating the reliability of our screen. In addition to these well-known genes in the pharmacology of etoposides, we identified several novel genes of interest.
Our multistep approach further integrated the leukemic cell gene expression levels of the top EtoRGs and EtoSGs identified in the CRISPR screen with clinical outcome endpoints in pediatric AML treated with etoposide-containing chemotherapy regimens. We hypothesized that EtoSGs would be associated with better clinical responses and EtoRGs would be associated with poor outcomes. Four EtoRGs and 15 EtoSGs met the criteria and included 2 well-established genes implicated in etoposide pharmacology: ABCC1 (an EtoRGs) showed increased expression associated with poor outcomes in pediatric AML, and TOP2A (an EtoSGs) showed increased expression associated with favorable outcomes in pediatric AML.
We identified several additional EtoRGs genes with a consistent association in CRISPR screen and pediatric AML (high expression predictive of poor outcomes). These EtoRGs included (1) PRKDC (DNA protein kinase), which interacts with the Ku70/Ku80 heterodimer and is involved in DNA double-strand break repair and recombination along with roles in cellular processes such as cell cycle progression and telomere maintenance.25 PRKDC also interacts with several DNA damage repair proteins via the STRING network such as AKT1, XRCC4, XRCC5, XRCC6, TP53, LIG4, NHEJ1, PARP1, EGFR, and DCLRE1C (Figure 5A), and it has been associated with the development of hepatocellular carcinoma and resistance to radiation in multiple cancers.25 The drug database search identified 4 inhibitors targeting PRKDC/DNA-PK: BR101801, Panulisib, Nedisertib (Peposertib), and CC-115 in the context of hematologic malignancies. Seven clinical trials (as of April 2022), including a phase 1 trial in RR AML (NCT03983824), are currently investigating Nedisertib (Peposertib). Additionally, a recent report summarized DNA-PK inhibitors as potential therapeutic targets in AML.26 Collectively, the negative selection of PRKDC in our CRISPR screen in conjunction with results from pediatric patients with AML and promising leads on the PRKDC inhibitors further provide a rationale for investigating it as a therapeutic strategy in AML. (2) The second promising EtoRG that met our multistep criteria is RAD54L2, encoding a helicase that plays a vital role in the DNA damage repair pathway and has a higher essential dependency score in leukemic cells than other cancer cell types. Although limited prior research indicated that RAD54L2 expression was associated with poor OS in gastrointestinal stromal cells,27 this study confirmed the potential significance of our findings that RAD54L2 is associated with etoposide resistance and poor clinical outcomes in our pediatric AML cohort. (3) ZNF451, encoding a SUMO ligase involved in the resolution of TOP2 DNA-protein crosslinks, contributes to etoposide resistance.18,19 This aligns with our findings that ZNF451 is a prognostic factor for unfavorable outcomes in pediatric AML treated with etoposide.
EtoSGs beside the etoposide target (TOP2A) included: (1) genes involved in metabolic pathways such as RPE (a ribulose-5-phosphate-3-epimerase), TKT (a transketolase) and ALDOA (a fructose-bisphosphate A aldolase) with roles involved in the pentose phosphate pathway; and HSD17B12 (a hydroxysteroid 17-beta dehydrogenase 12) involved in fatty acid biosynthesis; (2) genes with protein modifiers such as PPP2R1A (a serine/threonine-protein phosphatase) has been associated with tumor suppressor activity,28 where PP2A complex activated by small molecules has been shown to dephosphorylate MYBL2 and caused the irreversible arrest of leukemia cells; and (3) genes involved in the cell cycle such as CKS1B in conjunction with SKP2. Among the remaining identified EtoSGs, the literature on drug response or role in leukemias or specific AML is very limited. Notably, established genes involved in hematopoietic stem cell differentiation, such as RUNX1, MYB, and CBFB, were all associated with etoposide sensitivity in our CRISPR screen; however, our pediatric AML cohort demonstrated that increased leukemic cell gene expression for RUNX1 and CBFB was associated with poor clinical outcomes, whereas MYB was associated with favorable outcomes. Although the underlying biology of this relationship to explain this observed phenomenon is unknown (ie, rather than expression levels alone, the relevant prognostic factor may be specific to mutational profiles/fusion proteins), we performed the Spearman rank correlation of the leukemic cell gene expression of 26 EtoRGs and EtoSGs with significant association with at least one clinical outcome (supplemental Figure 4). From the correlation plot, we observed a significant negative correlation between RUNX1 and TOP2A, suggesting that the expression of the drug target (TOP2A) could overshadow the impact of RUNX1. It should also be noted that the genetic perturbations might be contributing to the observed association with drug response only at the single gene knockout level in the CRISPR screen, but in patients with AML, the simultaneous occurrence of varying expression patterns has an ultimate impact on outcomes.
In summary, we combined the results of a genome-wide CRISPR/Cas9 screen identifying etoposide sensitive/resistant genes with the leukemic cells' gene expression and clinical outcomes in pediatric patients with AML treated with etoposide-containing regimen to uncover clinically and biologically important etoposide genes. We identified several genes with prognostic and therapeutic implications in AML, including previously well-characterized genes such as ABCC1 (drug efflux transporter) and TOP2A (etoposide target). Our findings also identified novel genes that had not previously been associated with etoposide resistance and/or treatment-related outcomes in pediatric AML; of note were EtoRGs with detrimental clinical associations, indicating that they are important targets for therapeutic development. Among these, PRKDC (inhibitors are currently in phase 1 clinical trials, and our findings support their further evaluation in AML), ZNF451, and RAD54L2 are 3 genes with potential therapeutic implications. Although these findings are extremely compelling, the study has several limitations, including the impact of other drugs given in combination with etoposide in our clinical cohort and that CRISPR-significant genes are primarily driven by single-gene perturbations, whereas the functional effects of multiple genes and their interactions likely have a significant effect on clinical outcomes. Nonetheless, our findings emphasize the critical importance of integrating CRISPR/Cas9-based synthetic lethal screens in order to gain functional insights into drug resistance markers, clinically meaningful prognostic markers, and novel drug targets or strategies for developing novel drug combinations.
Acknowledgments
The authors gratefully acknowledge funding from the University of Florida (UF) Opportunity funds and UF Health Cancer Center, and National Institutes of Health grant R01-CA132946 (J.K.L. and S.B.P.). The authors also thank Dario Campana and Coustan-Smith for the minimal residual disease data.
Authorship
Contribution: N.H.K.N. performed all formal analysis, siRNA functional validation, analyzed and interpreted all formal results, and contributed to manuscript writing; R. Rafiee and A.K.d.J.S. performed in vitro CRISPR drug screening and prepared samples for NGS; A.T. generated CRISPR-sgRNA library pool and performed the transductions and associated quality control; A.L. and A.H.E. supported bioinformatics analysis; R. Rafiee, A.K.d.J.S., and M.G. supported siRNA functional validation; A.S., N.S., C.R.C., J.R., R. Ribeiro, J.D., X.C., S.B.P., and C.D.V. contributed to the AML patient data and reviewed the manuscript; J.K.L. conceptualized the project, analyzed data, acquired funding, supervised studies, and wrote, reviewed, and edited the manuscript; and all authors read the manuscript.
Conflict-of-interest disclosure: The authors declare no competing financial interests.
Correspondence: Jatinder K. Lamba, Department of Pharmacotherapy and Translational Research, University of Florida, 1345 Center Dr, Gainesville, FL 32610; e-mail: jlamba@cop.ufl.edu.
References
Author notes
∗N.H.K.N. and R. Rafiee contributed equally to this study.
Data are available upon request to the corresponding author, Jatinder K. Lamba (jlamba@cop.ufl.edu).
The full-text version of this article contains a data supplement.

