Key Points
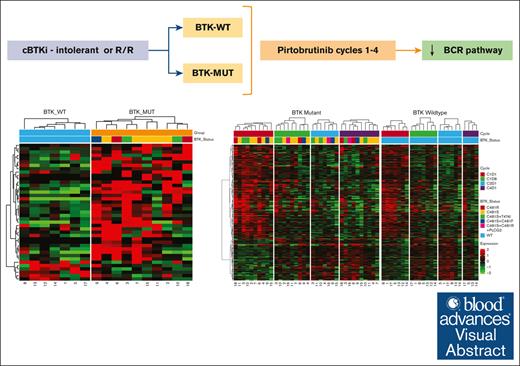
Omics analyses demonstrated that BTK-mutated CLL has augmented proliferative signaling when compared with BTK-WT CLL.
Proliferation-promoting pathways are suppressed after the first cycle of treatment with pirtobrutinib in BTK-WT and -mutated CLL.
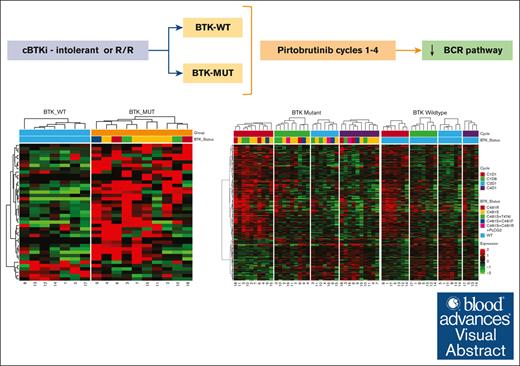
Visual Abstract
Covalent Bruton tyrosine kinase inhibitors (cBTKis), which bind to the BTK C481 residue, are now primary therapeutics for chronic lymphocytic leukemia (CLL). Alterations at C481, primarily C481S, prevent cBTKi binding and lead to the emergence of resistant clones. Pirtobrutinib is a noncovalent BTKi that binds to both wild-type (WT) and C481S-mutated BTK and has shown efficacy in BTK-WT and -mutated CLL patient groups. To compare baseline clinical, transcriptomic, and proteomic characteristics and their changes during treatment in these 2 groups, we used 67 longitudinal peripheral blood samples obtained during the first 3 cycles of treatment with pirtobrutinib from 18 patients with CLL (11 BTK-mutated, 7 BTK-WT) enrolled in the BRUIN (pirtobrutinib in relapsed or refractory B-cell malignancies) trial. Eastern Cooperative Oncology Group performance status, age, and Rai stage were similar in both groups. At baseline, lymph nodes were larger in the BTK-mutated cohort. All patients achieved partial remission within 4 cycles of pirtobrutinib. Lactate dehydrogenase and β2-microglobulin levels decreased in both cohorts after 1 treatment cycle. Expression analysis demonstrated upregulation of 35 genes and downregulation of 6 in the BTK-mutated group. Gene set enrichment analysis revealed that the primary pathways enriched in BTK-mutated cells were involved in cell proliferation, metabolism, and stress response. Pathways associated with metabolism and proliferation were downregulated in both groups during pirtobrutinib treatment. Proteomic data corroborated transcriptomic findings. Our data identified inherent differences between BTK-mutated and -WT CLL and demonstrated molecular normalization of plasma and omics parameters with pirtobrutinib treatment in both groups.
Introduction
The B-cell receptor (BCR) pathway is integral to the survival, proliferation, and mobilization of normal and malignant B cells.1,2 Several members of the BCR pathway have been targeted using small-molecule drugs, and the greatest efficacy has been seen by inhibiting Bruton’s tyrosine kinase (BTK). The first molecule to block BTK signaling was ibrutinib, which was followed by acalabrutinib and zanubrutinib.3 All 3 agents are irreversible covalent BTK inhibitors (cBTKis), and they bind chemically to BTK at cysteine 481 (C481). All 3 demonstrated clinical efficacy in phase 3 trials by significantly increasing progression-free survival. Authors reported some differences in adverse event type, frequency, and severity among these agents likely owing to differences in off-target kinase inhibition demonstrated in their respective kinome profiles. However, 1 effect common to all 3 cBTKis was the development of resistance via acquisition of a substitution mutation at the binding site (C481). The most prevalent substitution at this site is cysteine to serine (C481S); none of the 3 cBTKis can bind to a BTK-C481S clone, rendering it resistant to cBTKi treatment. Although rare, gatekeeper mutations of BTK at T474 are also observed, most commonly T474I, and simultaneous mutations at C481 and T474 seem to lead to a highly resistant phenotype.4 Additional anomalies associated with cBTKi resistance, such as Phospholipase C Gamma 2 (PLCG2) gain of function, have also been observed downstream of BTK, and some rare BTK non-C481 mutations were reported.5
A strategy to regain sensitivity and efficacy of BTKi in resistance to cBTKi consisted of developing and testing noncovalent BTKis (ncBTKis) that bind to BTK but that do not require the C481 amino acid. To date, 6 ncBTKis have been evaluated in preclinical and clinical settings, namely RN486,6-8 nemtabrutinib/ARQ 531,9,10 fenebrutinib/GDC-0853,11 vecabrutinib/SNS-062,12,13 luxeptinib/CG-806,14 and pirtobrutinib/LOXO-305.15-17 Pirtobrutinib is the most advanced and is approved by the US Food and Drug Administration for patients with mantle cell lymphoma or chronic lymphocytic leukemia (CLL).18 The BRUIN (pirtobrutinib in relapsed or refractory B-cell malignancies) trial (NCT03740529) was a first-in-human phase 1/2 trial of pirtobrutinib that included 725 patients with B-cell malignancies. In this study,16,19 all patients previously received a cBTKi and could either not tolerate it or developed resistance to it. Those who could not tolerate cBTKis generally are wild-type (WT) for BTK, whereas those with resistant disease generally have BTK mutations. There were several key observations in this trial. First, pirtobrutinib was well tolerated, and 200 mg was identified as the phase 2 dose. Second, patients with B-cell malignancies had good responses. Third, among patients with CLL or small lymphocytic lymphoma, the overall response rate was 80%.19 Fourth, and most relevant to this study, patients with BTK-WT CLL and those with BTK C481–mutated disease had similar clinical responses. Pirtobrutinib has also demonstrated efficacy against Waldenström macroglobulinemia,16,20 mantle cell lymphoma,16,21,22 and Richter transformation.23
These clinical observations of a similar efficacy of pirtobrutinib in BTK C481–mutated and in BTK-WT CLL cases were confirmed at the cellular and molecular levels using cell lines, murine model systems, and primary CLL cells. In addition, by transduction of MEC-1 CLL cells,24 cell lines that overexpress BTK-WT or BTK-C481S and BTK-C481R were established to test the molecular effects of ncBTKi-based treatment on the BCR pathway.25 MEC-1 cells bearing C481S exhibited augmentation of phospho-BTK, phospho-PLCγ2, and phospho-extracellular signal–regulated kinase (ERK) (ie, BCR signaling), which was further stimulated by treatment with immunoglobulin M (IgM). Pirtobrutinib treatment inhibited BCR signal transduction in both BTK-WT and BTK C481S–mutated CLL cells.15 Similar observations were reported for Human Embryonic Kidney 293 (HEK-293) cells (non-B cells) that expressed either WT or C481S-mutant BTK.26 A comparison of pirtobrutinib with a cBTKi in BTK C481S–driven cBTKi-resistant CLL models showed that pirtobrutinib more effectively mitigated BTK-mediated BCR signaling. Consistent with this finding, authors reported that samples from patients with CLL had suppression of BCR signaling during pirtobrutinib therapy and reactivation of signaling during disease progression.15,26,27
It has been established that when a cBTKi is used during in vitro incubation or during therapy in patients, BTK-WT CLL behaves differently from BTK C481–mutated CLL. However, in both cases, treatment with pirtobrutinib successfully inhibited BTK and BCR signaling, leading to similar clinical outcomes. Hence, we hypothesized that the molecular mechanisms underpinning these positive responses, specifically at the transcript and protein levels, may differ in patients with BTK-WT and those with BTK C481–driven CLL at baseline but are repressed equally in both cohorts by pirtobrutinib. To test our hypothesis, we performed transcriptomic and proteomic analyses using multiple longitudinal peripheral blood samples obtained from patients with CLL at baseline and during pirtobrutinib therapy. Although CLL driven by BTK-mutated clones displayed markers of enhanced cell proliferation and augmented BCR signaling, we showed that, within the first 2 cycles of pirtobrutinib, signaling and proliferative pathways were dampened in both BTK-WT and BTK C481–mutant cohorts. In parallel with these omics changes, clinical parameters were similarly resolved both in patients with BTK-WT and those with BTK-mutant CLL during the first 2 cycles of pirtobrutinib. Our findings provide a deeper understanding of the molecular mechanisms underlying CLL response to pirtobrutinib.
Patients and methods
Clinical protocol
All patients included in our study were participants in the BRUIN trial, an open-label, multicenter, phase 1/2 study of pirtobrutinib in patients with previously treated CLL/small lymphocytic lymphoma or non-Hodgkin lymphoma. The efficacy results for treatment of B-cell malignancies16 and CLL19 with pirtobrutinib have been published. In total, 26 patients with CLL in the BRUIN trial underwent treatment at The University of Texas MD Anderson Cancer Center (Figure 1A; supplemental Table 1). All patients had been treated previously with a cBTKi (ibrutinib or acalabrutinib). They either could not tolerate the cBTKi or had disease progression with BTK C481 or PLCG2 pathologic mutations. All patients (except patient number 1 who was treated at 250 mg/d) received 200 mg pirtobrutinib per day. Patients began receiving pirtobrutinib on cycle 1 day 1 (C1D1), and each cycle length was 28 days. The duration of pirtobrutinib therapy varied from 6 months to >2 years. At baseline, patient number 16 had both BTK and PLCG2 mutations and discontinued pirtobrutinib within 6 months. However, 7 patients (patients 4, 5, 8, 11, 12, 14, and 17) were still receiving therapy, and their disease is responding. All patients provided written informed consent to participate in the clinical trial and separate consent to participate in the accompanying laboratory correlative studies. The clinical trial was approved by the MD Anderson institutional review board and was conducted in accordance with the Declaration of Helsinki.
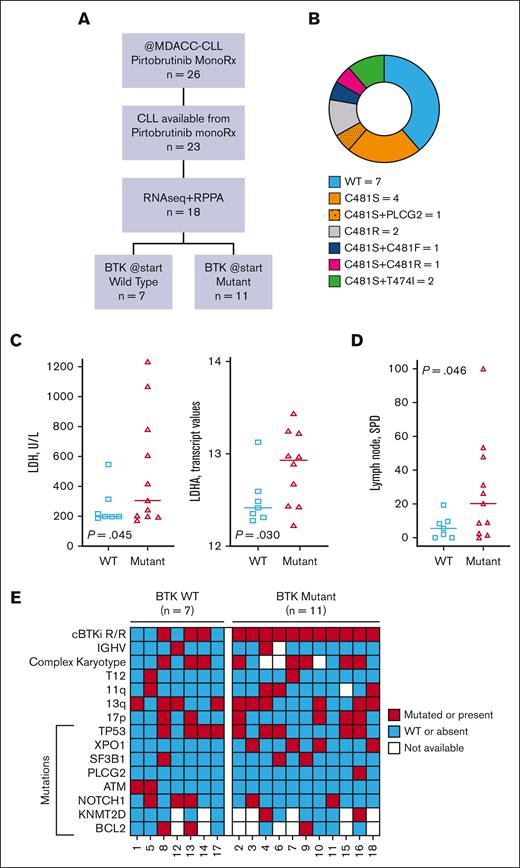
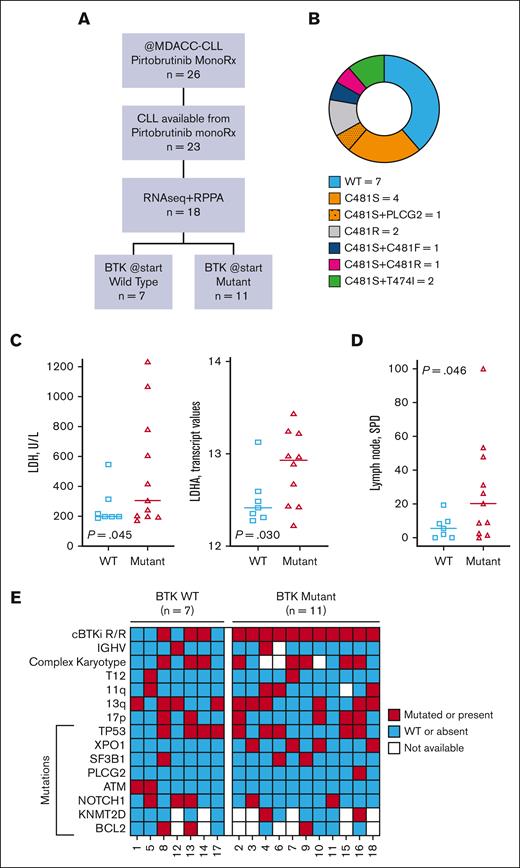
Study flowchart and baseline clinical characteristics of CLL patients. (A) Study flowchart. Of 23 eligible patients with CLL, 18 had adequate circulating cells for RNA sequencing and RPPA. All 18 experienced partial remission while receiving pirtobrutinib. (B) Mutation status at baseline. BTK and PLCG2 mutations were identified using targeted next-generation sequencing. (C) The LDH levels in peripheral blood samples (left) and log-transformed lactate dehydrogenase A (LDHA) transcript levels in patients with WT and mutated BTK (right) are shown. (D) Showing the lymph node size in the 18 patients. To obtain the lymph node sizes, electronic medical records were reviewed, and the sum of the products of the diameter was plotted. For statistical evaluation, Welch’s unpaired, 1-tailed t test was used. (E) OncoPrint data demonstrating the baseline clinical features and genomic alterations of patients with BTK-WT or -mutated CLL. The data were obtained from patients’ medical records. All patients received treatment at MD Anderson as part of the multicenter BRUIN trial and previously received cBTKi-based therapy. Data in panels C-E were obtained from patients’ electronic medical records before initiation of treatment with pirtobrutinib. In addition, the data in panel C were obtained using a human ProcartaPlex Human Cytokine/Chemokine/Growth Factor Panel 1 cytokine assay kit using plasma samples obtained at baseline. P values for comparisons by BTK mutation status were determined using Welch’s unpaired, 1-tailed t test. MDACC, MD Anderson Cancer Center; monoRx, monotherapy; pirto, pirtobrutinib; R/R, relapsed/resistant.
Study flowchart and baseline clinical characteristics of CLL patients. (A) Study flowchart. Of 23 eligible patients with CLL, 18 had adequate circulating cells for RNA sequencing and RPPA. All 18 experienced partial remission while receiving pirtobrutinib. (B) Mutation status at baseline. BTK and PLCG2 mutations were identified using targeted next-generation sequencing. (C) The LDH levels in peripheral blood samples (left) and log-transformed lactate dehydrogenase A (LDHA) transcript levels in patients with WT and mutated BTK (right) are shown. (D) Showing the lymph node size in the 18 patients. To obtain the lymph node sizes, electronic medical records were reviewed, and the sum of the products of the diameter was plotted. For statistical evaluation, Welch’s unpaired, 1-tailed t test was used. (E) OncoPrint data demonstrating the baseline clinical features and genomic alterations of patients with BTK-WT or -mutated CLL. The data were obtained from patients’ medical records. All patients received treatment at MD Anderson as part of the multicenter BRUIN trial and previously received cBTKi-based therapy. Data in panels C-E were obtained from patients’ electronic medical records before initiation of treatment with pirtobrutinib. In addition, the data in panel C were obtained using a human ProcartaPlex Human Cytokine/Chemokine/Growth Factor Panel 1 cytokine assay kit using plasma samples obtained at baseline. P values for comparisons by BTK mutation status were determined using Welch’s unpaired, 1-tailed t test. MDACC, MD Anderson Cancer Center; monoRx, monotherapy; pirto, pirtobrutinib; R/R, relapsed/resistant.
Patients and collection and processing of samples
Among the 26 patients treated at MD Anderson, cell samples from 18 patients were available for longitudinal studies. These patients had CLL except for patient number 15 who was diagnosed with Richter transformation but with a high number of circulating peripheral blood cells. Peripheral blood samples (n = 67) were collected from these 18 patients before initiation of pirtobrutinib therapy (C1D1), after 1 week (C1D8) of therapy, after 4 weeks or 1 cycle (C2D1), and after 3 cycles of treatment (C4D1). For patients 1, 8, and 18, because of the COVID-19 pandemic and closure of laboratories, C1D1 samples were not obtained, and thus, samples previously collected from these patients were used. Peripheral blood samples were collected into vacutainer green-top tubes. Plasma samples were obtained by centrifugation at 1500 rpm (475 g) for 10 minutes. Cells were isolated using a Ficoll-Hypaque gradient,28 and pellets were saved for further investigations.
Chemokine assay
The levels of chemokines in plasma were quantified using a ProcartaPlex Human Cytokine/Chemokine/Growth Factor Panel 1 (Thermo Fisher Scientific), as described previously.15
RNA isolation, RNA sequencing, and real-time PCR
Cell pellets were processed using an RNeasy Mini Kit (Qiagen), and total RNA was isolated according to the manufacturer’s instructions. RNA samples were sequenced using a NovaSeq 6000 S2-200 sequencing system (Illumina) by the The Advanced Technology Genomics Core at MD Anderson. TaqMan real-time polymerase chain reaction (PCR) primers and probes were purchased from Life Technologies (supplemental Table 1).
Protein extraction and reverse-phase protein array
Cell pellets were lysed with 1× lysis buffer (EMD Millipore), and cellular proteins were denatured in 1% sodium dodecyl sulfate containing β-mercaptoethanol. Lysates were submitted to the Functional Proteomics reverse phase protein array (RPPA) Core Facility at MD Anderson for RPPA analysis. The samples were serially diluted and printed on nitrocellulose-coated plates (Grace Bio-Labs). The slides were probed with 491 antibodies (supplemental Table 2) and scanned, analyzed, and quantified using Array-Pro Analyzer software (Media Cybernetics).
Analysis of RNA sequencing data
Raw reads were aligned to the human genome reference Genome Reference Consortium Human Build 38 (GRCh38) using the Spliced Transcripts Alignment to a Reference (STAR) transcriptome alignment tool.29 Python package for High-throughput sequence analysis (HTSeq) software was used to summarize the gene expression counts from the Binary Alignment Map (BAM) files.30 The normalization of counts and analyses of differential gene expression were performed using read counts with the R package for differential expression analysis of sequence count data (DESeq2).31 Significantly differentially expressed genes were defined as having a false discovery rate (FDR) of 0.05 and an absolute log fold change of at least 2. Hierarchical clustering (Pearson distance and Ward linkage) and principal component analyses (PCAs) were used for unsupervised expression investigations. Functional evaluation of the transcriptomic data was performed using ingenuity pathway analysis (IPA) and gene set enrichment analysis (GSEA) with the Hallmark pathway database.32,33 Preranked GSEA was performed based on test statistics that were obtained by determining differential gene expression among the 2 cohorts.
Analysis of RPPA data
Relative protein levels were quantified using the SuperCurve method in R. The relative levels were normalized for protein loading and were median centered for downstream data analyses. Differential protein expression analysis was performed with log-normalized data using unpaired t tests for groups segregated by BTK status and treatment cycle. One-way analysis of variance was used to determine whether protein levels differed significantly across the treatment time points. P values obtained in multiple testing, when applicable, were adjusted by estimating the FDR using the Benjamini-Hochberg method.34
Statistical analysis
The BTK mutation status was analyzed using various clinical markers (levels of β2-microglobulin [B2M], lactate dehydrogenase [LDH], cytokines, chemokines, counts of white blood cells and platelets, and size of lymph nodes) using Welch’s unpaired, 1-tailed t test. The Fisher exact test was used for contingency tables (Eastern Cooperative Oncology Group [ECOG] performance status, fluorescence in situ hybridization results, and immunoglobulin heavy-chain variable [IGHV] mutational status) to determine the significance. These markers and normalized expression data for genes of interest (BTK and provirus integration site for Moloney murine leukemia virus oncogene (PIM2)) were analyzed, and reverse transcription-PCR analysis was performed across treatment cycles using the Kruskal-Wallis test for the BTK-mutated and -WT cohorts separately. P values obtained from multiple testing, when applicable, were adjusted by estimating the FDR using the Benjamini-Hochberg method. Statistical tests with adjusted P values <.05 are considered significant.
Results
Baseline patient characteristics and prognostic factors in the BTK-WT and -mutated cohorts
To identify molecular differences at baseline and changes during pirtobrutinib therapy in the BTK-WT and BTK C481–mutated cohorts, we analyzed 67 blood samples from 18 patients at baseline and at 3 time points during therapy (Figure 1A). The baseline clinical characteristics of the patients are provided in Table 1. Eleven patients harbored single or double mutations in BTK, and 7 patients were WT for BTK. In the BTK-mutated group, 5 patients had a single C481S mutation, 2 had a single C481R mutation, 2 had double mutations in the BTK C481 residue, and 2 had double mutations involving BTK C481S and the gatekeeper T474I. One patient also had a PLCG2 mutation (Figure 1B). Two of these patients (patient number 3 and 10) previously received treatment with acalabrutinib, whereas the others received ibrutinib.
Ages, ECOG performance status, immunoglobulin levels, and most blood parameters were similar in both cohorts, indicating that patients in both groups were in similar condition (Table 1). Among the known CLL prognostic factors, at baseline, Rai stage was not significantly different in the 2 groups. However, we found markedly higher B2M plasma levels, higher LDH plasma and transcript levels, and lower platelet counts in BTK-mutated samples than in BTK-WT samples, indicating that BTK-mutated CLL is more aggressive than BTK-WT disease (Figure 1C; Table 1). In addition, the lymph node sums of the product of diameters were considerably higher in the BTK-mutated group (Figure 1D). The genetic and genomic alterations were similar to those reported before.35 The cytogenetics were comparable in the cohorts (Table 1), although the numbers of patients in the groups were small. Comparison of OncoPrint data demonstrated no specific associations of either group with genomic mutations. Only the BTK-mutated cohort had XPO1 aberrations, which were present in 36% of these patients; however, this was not significant (P = .12) (Figure 1E).
Baseline transcriptomic differences between the BTK-WT and -mutated groups
The PCAs showed that transcriptomic data identified differences based on BTK mutation status (Figure 2A) but not based on patient or treatment cycle (supplemental Figure 1). GSEA revealed that 28 of 50 Hallmark pathways were significantly enriched (FDR <0.05) in the BTK-mutated group (Figure 2B). The enriched pathways were related to metabolism (oxidative phosphorylation, glycolysis, fatty acid metabolism, hypoxia, and reactive oxygen species), proliferative signaling pathways (Myelocytomatosis oncogene (Myc), mitotic spindle, G2/M checkpoint, Early Region-2 binding factor (E2F), and DNA repair), cell signaling (mammalian target of rapamycin complex (mTORC), tumor necrosis factor via nuclear factor-κB, and interleukin-2–signal transducer and activator of transcription-5 (STAT5)), and cellular stress response signaling pathways (tumor protein p53, unfolded protein, and apoptosis) (Figure 2B).
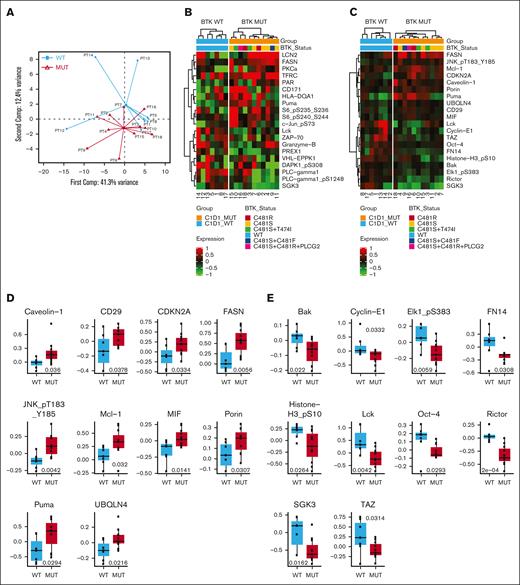
Baseline transcriptomic differences between the BTK-WT and BTK-mutated groups of patients with CLL. (A) A PCA plot of baseline RNA sequencing data by BTK mutation status is shown (BTK-WT, n = 7; BTK-mutated [MUT], n = 10). (B) Hallmark pathways enriched at baseline (FDR < 0.05) in the BTK-mutated group when compared with the BTK-WT group. The significantly enriched pathways were metabolism, proliferation, cell signaling, cellular stress response, and other. (C) A heat map of significantly differentially expressed genes in the BTK-WT and -mutated groups at baseline. The numbers on the x-axis correspond to the patient numbers in Table 1. Gene names are provided on the right y-axis.
Baseline transcriptomic differences between the BTK-WT and BTK-mutated groups of patients with CLL. (A) A PCA plot of baseline RNA sequencing data by BTK mutation status is shown (BTK-WT, n = 7; BTK-mutated [MUT], n = 10). (B) Hallmark pathways enriched at baseline (FDR < 0.05) in the BTK-mutated group when compared with the BTK-WT group. The significantly enriched pathways were metabolism, proliferation, cell signaling, cellular stress response, and other. (C) A heat map of significantly differentially expressed genes in the BTK-WT and -mutated groups at baseline. The numbers on the x-axis correspond to the patient numbers in Table 1. Gene names are provided on the right y-axis.
Our comparison of the transcriptomes of baseline BTK-WT and -mutated samples identified 41 differentially expressed genes (Figure 2C). The expression of 6 of these genes was lower and that of the remaining 35 genes was higher in cells harboring BTK mutations than in cells from the BTK-WT group (log twofold-change >2, FDR <0.05) (Figure 2C). IPA comparing baseline transcriptomic data in the BTK-mutated and -WT groups revealed 11 pathways that were different between them (supplemental Figure 2). Most of these pathways are involved in B-cell biology, inflammation (ID1, IL-15, and p70S6K signaling), and cell proliferation. Moreover, assessment of the transcriptome-based tumor purity and B-cell proportion using the ESTIMATE (Estimation of Stromal and Immune cells in Malignant Tumor tissues using Expression data) and CIBERSORT (Cell-type Identification By Estimating Relative Subsets Of RNA Transcripts) algorithms, respectively, revealed no significant associations between them based on BTK mutation status. At the RNA level, several genes involved in mitosis (CCNB2, CDC20, LMNA, KIF4A, DLGAP5, and TUBB6) were upregulated in the BTK-mutated group (Figure 2C). Overall, this comparative transcriptomic analysis revealed that, at baseline, CLL cells with BTK mutations displayed upregulation of BCR and the signaling pathways associated with cell survival, mitotic proliferation, and cellular metabolism.
Baseline proteomic differences between the BTK-WT and -mutated groups
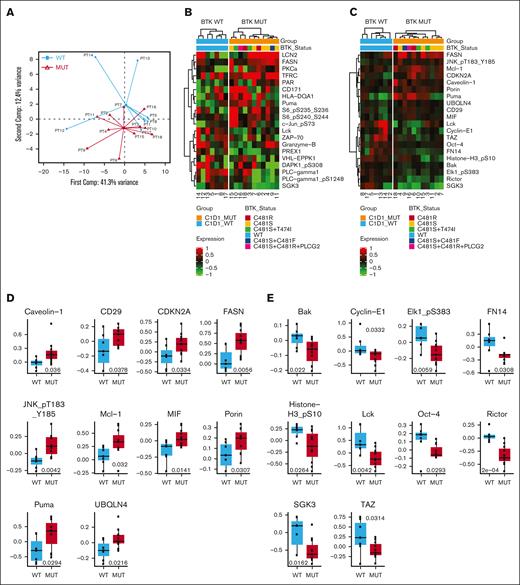
Like the transcriptomic data, PCAs of our proteomic data identified differences based on BTK mutation status (Figure 3A) but not based on patient or treatment cycle (supplemental Figure 3). We identified the top 20 differentially expressed proteins (total or phosphorylated) by log twofold-change (Figure 3B) or P value (Figure 3C). The 10 most overexpressed proteins in the BTK-mutated group were linked to metabolism (fatty acid synthase, CD29, and caveolin-1), apoptosis (myeloid cell leukemia-1 (Mcl-1) and Puma), and inflammation and stress response (phospho-JNK and ubiquilin-4), and also included cyclin-dependent kinase inhibitor 2A, migration inhibitory factor, and porin (Figure 3D). In contrast, Bcl-2- antagonist/killer (Bak), cyclin-E1, Lymphocyte-specific protein tyrosine kinase (LCK), Serum/glucocorticoid regulated kinase 3 (SGK3), TAZ, Octamer binding-transcription factor 4 (Oct-4), and other proteins were downregulated in the BTK-mutated group (Figure 3E). LCK is generally a T-cell receptor protein, however, it is also expressed in CLL cells,36 and its expression is regulated through NFAT2.37 This protein is a mediator of the BCR pathway in CLL38 and may serve as a target for this disease.39 The IPA results identified 10 signaling pathways that were affected (supplemental Figure 4).
Baseline proteomic differences between patients with BTK-WT CLL and those with BTK-mutated CLL. An RPPA assay was used for protein analyses as described in the “Patients and methods” section. Analysis of differential protein expression was performed using unpaired, 2-tailed t tests. No proteins were significantly differentially expressed after adjusting for multiple testing. (A) A PCA plot of the baseline RPPA data by BTK mutation status (BTK-WT, n = 7; BTK-mutated, n = 11). (B) Heat map of the top 20 differentially expressed proteins by log fold change. Numbers on the x-axis correspond to the patient numbers in supplemental Table 1. (C) Heat map of the top 20 differentially expressed proteins by P value. Numbers on the x-axis correspond to the patient numbers in supplemental Table 1. (D) Box plots comparing the expression of the top 10 overexpressed proteins (by P value) in the BTK-mutated and BTK-WT groups at baseline. (E) Box plots comparing the expression of the top 10 downregulated proteins (by P value) in the BTK-mutated and BTK-WT groups at baseline.
Baseline proteomic differences between patients with BTK-WT CLL and those with BTK-mutated CLL. An RPPA assay was used for protein analyses as described in the “Patients and methods” section. Analysis of differential protein expression was performed using unpaired, 2-tailed t tests. No proteins were significantly differentially expressed after adjusting for multiple testing. (A) A PCA plot of the baseline RPPA data by BTK mutation status (BTK-WT, n = 7; BTK-mutated, n = 11). (B) Heat map of the top 20 differentially expressed proteins by log fold change. Numbers on the x-axis correspond to the patient numbers in supplemental Table 1. (C) Heat map of the top 20 differentially expressed proteins by P value. Numbers on the x-axis correspond to the patient numbers in supplemental Table 1. (D) Box plots comparing the expression of the top 10 overexpressed proteins (by P value) in the BTK-mutated and BTK-WT groups at baseline. (E) Box plots comparing the expression of the top 10 downregulated proteins (by P value) in the BTK-mutated and BTK-WT groups at baseline.
Changes in biomarkers during pirtobrutinib therapy
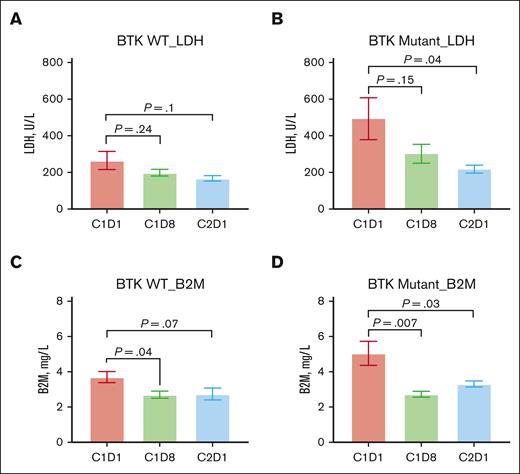
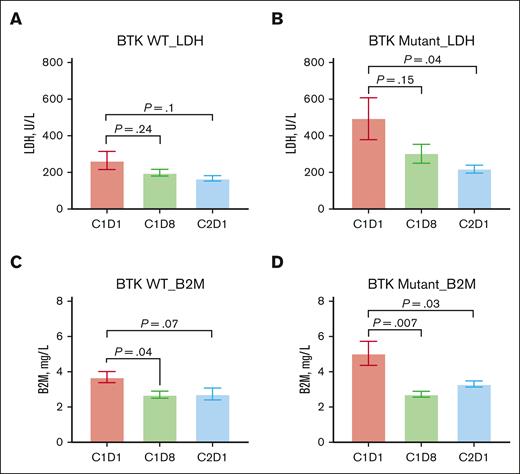
All 18 patients achieved partial remission after 1 (C2D1) or 2 (C3D1) cycles of treatment with pirtobrutinib. Therefore, we determined changes in the levels of plasma biomarkers, transcripts, and proteomics from baseline to C1D8 and C2D1 in both patient groups. LDH and B2M levels, which differed in the 2 groups at baseline, decreased during cycle 1 in all patients and was significantly different in the BTK-mutated cohort (Figure 4A-D). Lymph node size decreased in both groups. None of the other clinical parameters (white blood cell count, platelet count, or immunoglobulin levels) exhibited distinct patterns in the BTK-WT and -mutated groups (data not shown). Previously, we reported a precipitous decline in CCL2, CCL3, and CCL4 levels during the first few cycles of pirtobrutinib therapy.15 In agreement with these previous findings, we observed a trend of decreased levels of many other cytokines and chemokines, such as interleukin-18, stromal cell–derived factor 1α, CXCL-10, and hepatocyte growth factor, during therapy in the majority of samples tested (data not shown).
Changes in biomarker levels during therapy with pirtobrutinib. Biomarker levels were obtained from the electronic medical records of the patients at baseline (C1D1) and 1 week (C1D8), 4 weeks/1 cycle (C2D1), and 3 cycles (C4D1) after the initiation of pirtobrutinib. P values were determined using the Kruskal-Wallis test. (A) LDH levels in BTK-WT patients (n = 7) during therapy. (B) LDH levels in patients with mutated BTK (n = 11) during therapy. (C) B2M levels in patients with WT BTK during therapy. (D) B2M levels in patients with mutated BTK during therapy.
Changes in biomarker levels during therapy with pirtobrutinib. Biomarker levels were obtained from the electronic medical records of the patients at baseline (C1D1) and 1 week (C1D8), 4 weeks/1 cycle (C2D1), and 3 cycles (C4D1) after the initiation of pirtobrutinib. P values were determined using the Kruskal-Wallis test. (A) LDH levels in BTK-WT patients (n = 7) during therapy. (B) LDH levels in patients with mutated BTK (n = 11) during therapy. (C) B2M levels in patients with WT BTK during therapy. (D) B2M levels in patients with mutated BTK during therapy.
Transcriptomic changes during pirtobrutinib therapy
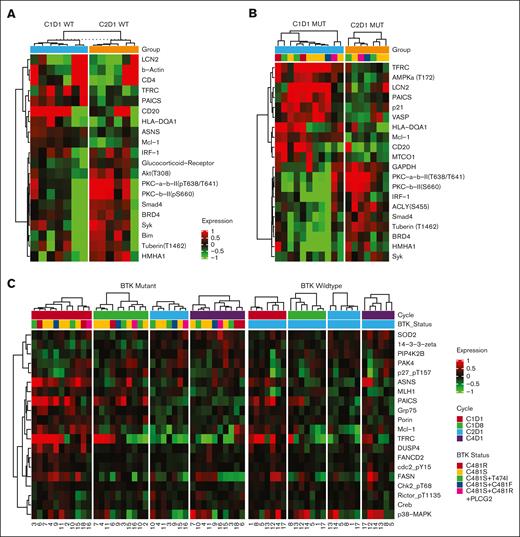
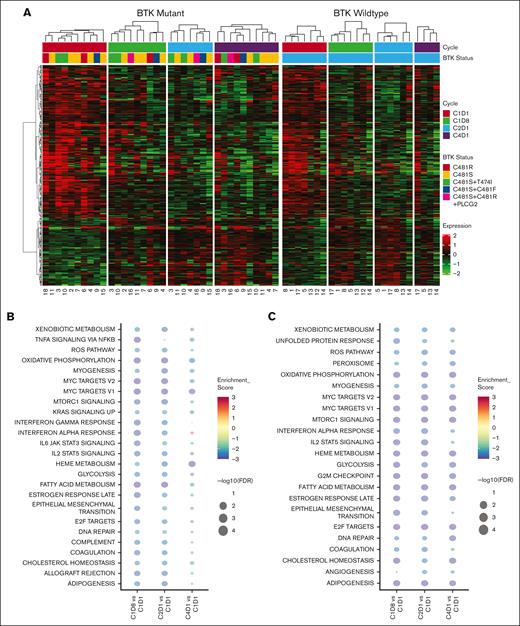
Examination of the changes in differentially expressed genes during therapy demonstrated similar trends in the expression of several common genes in both cohorts (Figure 5A). In the BTK-mutated group in particular, we observed no association between any specific BTK mutation (single or double C481 mutant, C481S or C481R variant, or C481S and T474I) and gene expression, although the sample size in each of these subgroups was too small to draw any conclusion.
Transcriptomic changes during therapy with pirtobrutinib. Cells were isolated from patients’ peripheral blood samples (n = 18), which were collected before treatment with pirtobrutinib (C1D1) and at the indicated time points (C1D8, C2D1, and C4D1). Transcript levels in the samples were quantified using RNA sequencing. Significant differences were defined as an FDR of 0.05 and log fold change >2. (A) A likelihood ratio test was performed to identify genes that were significantly differentially expression at the assessed time points during therapy with pirtobrutinib in the BTK-WT and BTK-mutated groups separately. The heat map shows significantly differentially expressed genes (FDR < 0.01) that were shared between the WT and mutated BTK groups. The thick white line separates the WT and mutated groups, and the numbers on the x-axis correspond to the patient numbers in Table 1. (B-C) Bubble charts illustrating a comparison of Hallmark pathway enrichment analyses at time points C1D8, C2D1, and C4D1 with reference to baseline (C1D1) in the BTK-WT group (B) and the BTK-mutated group (C). Enrichment scores for the signaling pathways are indicated by the colors, whereas FDR values are represented by the size of the bubbles.
Transcriptomic changes during therapy with pirtobrutinib. Cells were isolated from patients’ peripheral blood samples (n = 18), which were collected before treatment with pirtobrutinib (C1D1) and at the indicated time points (C1D8, C2D1, and C4D1). Transcript levels in the samples were quantified using RNA sequencing. Significant differences were defined as an FDR of 0.05 and log fold change >2. (A) A likelihood ratio test was performed to identify genes that were significantly differentially expression at the assessed time points during therapy with pirtobrutinib in the BTK-WT and BTK-mutated groups separately. The heat map shows significantly differentially expressed genes (FDR < 0.01) that were shared between the WT and mutated BTK groups. The thick white line separates the WT and mutated groups, and the numbers on the x-axis correspond to the patient numbers in Table 1. (B-C) Bubble charts illustrating a comparison of Hallmark pathway enrichment analyses at time points C1D8, C2D1, and C4D1 with reference to baseline (C1D1) in the BTK-WT group (B) and the BTK-mutated group (C). Enrichment scores for the signaling pathways are indicated by the colors, whereas FDR values are represented by the size of the bubbles.
Subsequently, we assessed the enriched signaling pathways in the BTK-WT and -mutated groups by comparing Hallmark GSEA data obtained at each time point with data obtained for C1D1. Bubble charts of the identified pathways for the BTK-WT and BTK-mutated groups are shown in Figures 5B and C, respectively. Pathways enriched at baseline in both groups (supplemental Figure 5) included metabolism (oxidative phosphorylation, glycolysis, fatty acid metabolism, and reactive oxygen species), proliferation pathways (Myc_1, Myc_2, E2F, and DNA repair), and prosurvival signaling pathways (mTORC, interleukin-2–STAT5, and interferon-α). In contrast, G2M checkpoint and unfolded protein response pathways were enriched in the BTK-mutated group, whereas tumor necrosis factor-α and JAK-STAT3 pathways were enriched in the BTK-WT group. A comparison of the IPA data for C2D1 and C1D1 revealed the top 26 canonical pathways that distinguished the BTK-mutated group from the BTK-WT group during the first cycle of pirtobrutinib therapy (supplemental Figure 6). Mitosis-, cell cycle–, and cytoskeleton-related pathways were the primary pathways affected.
BTK and provirus integration site for Moloney muring leukemia virus (PIM2) oncogene are considered early response genes and are downregulated with BTKi therapy. This was also the case with pirtobrutinib in the BTK-WT and -mutated groups (supplemental Figure 7A-B). To validate our transcriptomic data, we performed real-time PCR assays. Despite some variations, we found that transcript levels decreased in most of the samples tested in both groups (supplemental Figure 7C-D).
Proteomic changes during pirtobrutinib therapy
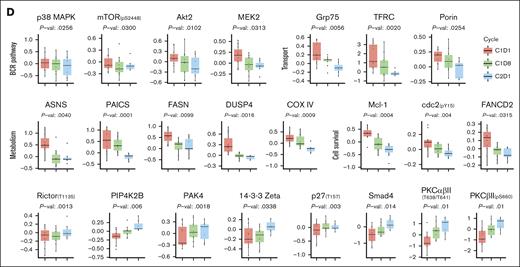
To assess the response to pirtobrutinib therapy at the protein level, we conducted RPPA analyses on samples obtained during treatment. When we compared the top 20 differentially altered proteins after 1 cycle of therapy, we found that 6 proteins—Mcl-1, enzyme PAICS, 3 immunity-related proteins (LCN2, CD20, and HLA-DQA1), and transferrin receptor—were downregulated in the BTK-WT and -mutated cohorts (Figure 6A-B). Eight proteins were upregulated, including phosphorylated protein kinase C (PKC) proteins. Some of these proteins exhibited similar upregulation or downregulation trends in both groups during pirtobrutinib therapy (Figure 6C). Significant changes in protein expression over the course of therapy mostly occurred in the BTK-mutated cohort (Figure 6D). These proteins are associated with the BCR pathway, survival and proliferation, and metabolism. In contrast, several phosphorylated and total proteins were upregulated (Figure 6D, bottom row). We saw a similar trend in the BTK-WT group (data not shown).
Discussion
Clinical and outcome data from the BRUIN trial clearly demonstrated that both the BTK-WT and BTK-mutated cohorts of patients with CLL had responses to treatment with pirtobrutinib.16,18,19 Our study identified several transcriptomic and proteomic differences that may be associated with the overall positive responses to pirtobrutinib treatment in CLL that bears WT or mutated BTK. We demonstrated that although patients with WT-BTK CLL have inherent differences when compared with those with mutated-BTK CLL subtypes using omics, within the first few cycles, treatment with pirtobrutinib–suppressed, BCR–mediated signal transduction in both cohorts.
We identified that the BTK-WT and -mutated cohorts were comparable in terms of ECOG performance status, immunoglobulins, fluorescence in situ hybridization data, and the IGHV gene. However, several baseline characteristics were different between the cohorts, and these may account for the aggression of BTK-mutated CLL when compared with CLL with WT BTK. First, PCAs differentiated the BTK-mutated group from the BTK-WT group at both the transcript and protein level. Second, plasma and transcript levels of B2M and LDH, which are established prognostic factors for poor outcome after ibrutinib-based therapy in patients with CLL,40 were higher in the BTK-mutated group. Third, the transcriptomic analysis demonstrated enhancement of pathways involved in metabolism, proliferation, B-cell signaling, and inflammation in the BTK-mutated group, which was confirmed by IPA. Fourth, proteomic data and the associated IPA results corroborated the transcriptomic findings of enhanced cellular metabolism, B-cell signaling, and inflammation in the BTK-mutated group. An important study on CLL proteomics reported that PCA separated groups by trisomy 12 and IGHV mutation status, but that study did not include a BTK-mutated subgroup.41 Among the genomic alterations, SF3B1, NOTCH1, ATM, TP53, POT1, CHD2, and XPO1 were the most common.35 In our analyses, only 1 patient had an IGHV mutation, and only 2 had trisomy 12, but we found that the BTK status was discriminatory in the PCA. Collectively, our clinical, transcriptomic, and proteomic data suggest that BTK-mutated CLL is aggressive.
Our data are consistent with those of previous preclinical investigations that used CLL and non-CLL cell lines that expressed BTK.25,26 In 1 study, untreated MEC-1 CLL cells that overexpressed WT or C481-mutant BTK had similar doubling times, but BCR pathway signaling was higher in cells transduced with mutated BTK.25 Furthermore, mice that bore BTK-mutated xenografts had more aggressive disease and slightly shorter survival times.25 These molecular differences may explain the more aggressive phenotype of BTK-mutated disease in cell lines and primary CLL cells.15,26 Clinically, the development of mutant BTK clones after treatment with a cBTKis, such as ibrutinib, is reported to lead to aggressive and resistant disease42-44 and CLL progression but not to Richter transformation.45,46 The presence of non-BTK mutations and ibrutinib-resistant subclones before therapy have also been reported to impact CLL aggression and resistance.47 Functional characterization and gene expression analyses in a few patients with C481 mutations suggested the presence of increased BCR signature gene expression, elevated BCR signaling, and accelerated cell proliferation with consequent increased cellularity.48
Our analyses of pirtobrutinib’s immediate effect on global gene expression clearly demonstrated similar declines in the transcript levels in the BTK-WT and BTK-mutated groups. GSEA suggested suppression of pathways involved in cell metabolism, nuclear factor-κB signaling, cell proliferation, and the cellular stress response. Similarly, pathway suppression at the transcriptomic level has been reported with ibrutinib use.49 Inhibition of these pathways by treatment with pirtobrutinib may be responsible for the partial responses observed in the BTK-WT and -mutated groups. Furthermore, the hallmark feature of cBTKi and ncBTKi, blockade of BCR signaling is reflected in the decline in lymph node size and B2M and LDH levels.50
CCL3 and CCL4 levels are considered key biomarkers of BCR pathway signaling.51,52 Previously, we reported that baseline plasma CCL3 and CCL4 levels were higher in patients with BTK C481–mutated CLL than in those with BTK-WT disease.15 We also found this pattern at the transcriptomic level in the 18 patients included in this analysis, corroborating our observation of increased BCR and other signaling pathways. CCL3 and CCL4 levels declined in cells and plasma in both the BTK-mutated cohort and BTK-WT cohort, which is consistent with other reports.15,26,40,47,52
A few key observations provide a rationale for the use of other agents with or after pirtobrutinib for CLL treatment. First, we found that XPO1 mutations were associated with BTK-mutated disease. However, this must be assessed in a larger cohort. XPO1 point mutations have been shown to prime preneoplastic lymphocytes for acquisition of other aberrations,53 and XPO1 upregulation is associated with B-cell survival, even when the BCR pathway is blocked.54XPO1 mutants are sensitive to treatment with selinexor and ibrutinib.55 Second, we observed that both BTK-WT and BTK-mutated samples, especially the latter, had high expression of Mcl-1 transcripts and protein. This finding provides a rationale for combining pirtobrutinib with Mcl-1 inhibitors.56 We previously demonstrated the use of venetoclax and AZD5991 in combination with pirtobrutinib for patients with CLL with disease progression after pirtobrutinib therapy.57 Third, we found that phosphorylation of PKC-β was upregulated after 1 cycle of pirtobrutinib in both the BTK-WT and BTK-mutated group. After disease progression, several of these patients received treatment with a PKC-β inhibitor.58 Fourth, 1 of the top 3 genes that were markedly more expressed in our BTK-mutated group was WNT5A, providing a rationale for targeting this pathway in BTK-mutant CLL treatment. Receptor Tyrosine Kinase-Like Orphan Receptor 2 (ROR2) serves as a receptor for WNT5A59 and mediates noncanonical WNT5A signaling in patients with many cancers.60 In CLL, WNT5A induces oligomerization of ROR1/ROR2, which leads to enhanced cell proliferation and chemotaxis.61-63 Increased levels of these receptors are associated with accelerated64 and/or drug-resistant CLL.65 Administration of cirmtuzumab blocks this pathway66,67 and is being tested in clinical trials for CLL treatment.68 Collectively, these observations provide therapeutic strategies after pirtobrutinib.
This study had some limitations. We evaluated only 18 patients, and within the BTK-mutated group, only a few patients had double BTK mutations, making interpretation of our results for cells harboring kinase and gatekeeper mutations difficult. Only 1 patient in our cohort had a PLCG2 mutation. Lastly, the variant allele frequency for each mutation varied among the patients, which may have impacted how BTK mutations affected the speed and type of response of CLL to pirtobrutinib. Single cell–based profiling of the transcriptome and variants in the context of the BTK mutation status may provide further insight into the evolution of CLL during pirtobrutinib therapy.
Even with the limitations described above, our data provide important information that demonstrates that treatment with pirtobrutinib is effective against both BTK-WT and -mutated CLL. This study demonstrated several changes at the transcript and protein levels in both BTK-WT and -mutated CLL cells during 3 cycles of treatment with pirtobrutinib. Changes in the inhibition of BCR pathway signaling, downregulation of numerous molecular markers of disease, and activation of apoptosis in the BTK-WT and -mutated groups may account for the efficacy of pirtobrutinib at the molecular level in both groups.
Acknowledgments
The authors acknowledge Amy Ninetto and Don Norwood of Editing Services at the Research Medical Library at MD Anderson for editing the manuscript.
This work was supported, in part, by the MD Anderson Moon Shots Program and a sponsored research agreement from Loxo@Lilly.
Authorship
Contribution: B.A. coordinated sample collection, sample processing, and data analyses and wrote portions of the manuscript; G.M. performed all bioinformatic and statistical analyses of the transcriptomic and proteomic data; L.R.I. assisted in sample processing and coordination with core facilities for the omics analyses; S.I.T. assisted in the analyses of data; S.D. provided patient characteristics, clinical information, and genomic data; W.G.W. was the principal investigator of the clinical trial and was responsible for identifying patients to enter the protocol and discussion with patients about the laboratory investigations and sample collection; and V.G. conceptualized the research, was responsible for funding, supervised the research, wrote portions of the manuscript, and revised the manuscript.
Conflict-of-interest disclosure: Pertaining to the current project, V.G. reports having a sponsored research agreement with Loxo@Lilly. In addition, V.G. reports having sponsored research agreements with Pharmacyclics, AbbVie, Acerta, Sunesis Pharmaceuticals, and Clear Creek Bio. The remaining authors declare no competing financial interests.
Correspondence: Varsha Gandhi, Unit 1950, Department of Experimental Therapeutics, The University of Texas MD Anderson Cancer Center, 1515 Holcombe Blvd, Houston, TX 77030; email: vgandhi@mdanderson.org.
References
Author notes
This study was conducted during the pirtobrutinib clinical trial (NCT03740529).
The full-text version of this article contains a data supplement.

![Baseline transcriptomic differences between the BTK-WT and BTK-mutated groups of patients with CLL. (A) A PCA plot of baseline RNA sequencing data by BTK mutation status is shown (BTK-WT, n = 7; BTK-mutated [MUT], n = 10). (B) Hallmark pathways enriched at baseline (FDR < 0.05) in the BTK-mutated group when compared with the BTK-WT group. The significantly enriched pathways were metabolism, proliferation, cell signaling, cellular stress response, and other. (C) A heat map of significantly differentially expressed genes in the BTK-WT and -mutated groups at baseline. The numbers on the x-axis correspond to the patient numbers in Table 1. Gene names are provided on the right y-axis.](https://ash.silverchair-cdn.com/ash/content_public/journal/bloodadvances/8/17/10.1182_bloodadvances.2023012360/2/m_blooda_adv-2023-012360-gr2.jpeg?Expires=1768263518&Signature=zQSGivOg-pXSlnjkfm1AH5Ay85W3EJIW1t7nw78tcszDGN6NB6rFVHFl9kulBdy74k3r78nvd9jyOraKnJveaeSeNN0ORNYBZd2uUjldx872GDBt6XHFPIf4H~Gdcamb8duZ-esRigcN91kdxGXBCCX-M9Pa27y2ly-ooylmZ575u~pN7UQNVwBpC-hK54p-TrrM4aKbIovhbVG6lBLJ2-jebD26sapnRWDFiNsmcyoAnLOsEuaMOi6anvILUfOe2gMkbPa5WZZcXP2YD6GEr7NsgIaF85v7S6BD8l12GF69Ag0OShobrwHMNwpOMgGO6ri45-wp7CG5x3PIIozamg__&Key-Pair-Id=APKAIE5G5CRDK6RD3PGA)

![Baseline transcriptomic differences between the BTK-WT and BTK-mutated groups of patients with CLL. (A) A PCA plot of baseline RNA sequencing data by BTK mutation status is shown (BTK-WT, n = 7; BTK-mutated [MUT], n = 10). (B) Hallmark pathways enriched at baseline (FDR < 0.05) in the BTK-mutated group when compared with the BTK-WT group. The significantly enriched pathways were metabolism, proliferation, cell signaling, cellular stress response, and other. (C) A heat map of significantly differentially expressed genes in the BTK-WT and -mutated groups at baseline. The numbers on the x-axis correspond to the patient numbers in Table 1. Gene names are provided on the right y-axis.](https://ash.silverchair-cdn.com/ash/content_public/journal/bloodadvances/8/17/10.1182_bloodadvances.2023012360/2/m_blooda_adv-2023-012360-gr2.jpeg?Expires=1768965012&Signature=IgSYUM6qBotFRKuGEkewbEwrRRP2lck7VMWzKrgWQbo-NzZ87uK-Z0oTVEjjF2de5nXcsQq50rbtG0~9mV12fs8UW0PCupzynRhxGw3w~sFcmJmDP-jT9bEKsoOwJsALViB1SAw6P2ItSljEH9XtMI8B0zM97Z3lepFUC2dgoggHiQRFffzWB38rHn94LONBZudsQc4UlukWNvyxIzqnr7NF56nBl7RxR~YHDs1ejmHdimw4CmsDjJvluEFggsG2rxDvcVToelrcpyJNwlrFoaKktpWmyCrENpy99SQsPVkoqEdYAITIIGghPrgZtTwnLEVr3e-KjcqlPTFwIAewEw__&Key-Pair-Id=APKAIE5G5CRDK6RD3PGA)
