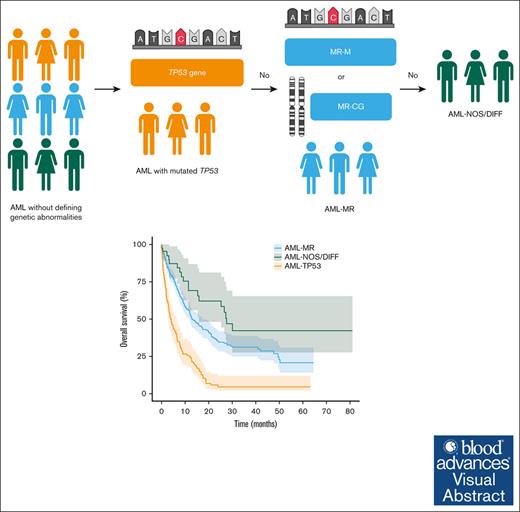
TP53 mutations are associated with distinct clinicopathological and prognostic features which warrants a separate entity apart from AML-MR.
AML with myelodysplasia-related genetics can be combined as a single group encompassing MR-defining gene mutations and cytogenetics.
Visual Abstract
The proposed fifth edition of the World Health Organization classification of hematolymphoid tumors (WHO-HAEM5) and International Consensus Classification (ICC) provide different definitions of acute myeloid leukemia with myelodysplasia-related genetics (AML-MR). We conducted a retrospective study which included a cohort of 432 patients, with 354 patients fulfilling WHO-HAEM5 criteria for WHO-AML-MR or 276 patients fulfilling ICC criteria for ICC-AML-MR by gene mutation or cytogenetics (ICC-AML-MR-M/CG). The clinicopathological features were largely similar, irrespective of the classification used, except for higher rates of complex karyotype, monosomy 17, TP53 mutations, and fewer RUNX1 mutations in the WHO-AML-MR group. TP53 mutations were associated with distinct clinicopathological features and dismal outcomes (hazard ratio [HR], 2.98; P < .001). ICC-AML-MR-M/CG group had superior outcome compared with the WHO-AML-MR group (HR, 0.80, P = .032), largely in part due to defining TP53 mutated AML as a standalone entity. In the intensively-treated group, WHO-AML-MR had significantly worse outcomes than AML by differentiation (HR, 1.97; P = .024). Based on ICC criteria, ICC-AML-MR-M/CG had more inferior outcomes compared to AML not otherwise specified (HR, 2.11; P = .048 and HR, 2.55; P = .028; respectively). Furthermore, changing the order of genetic abnormalities defining AML-MR (ie, by gene mutations or cytogenetics) did not significantly affect clinical outcomes. ICC-AML-MR-M/CG showed similar outcomes regardless of the order of assignment. We propose to harmonize the 2 classifications by excluding TP53 mutations from WHO-HAEM5 defined AML-MR group and combining AML-MR defined by gene mutations and cytogenetics to form a unified group.
Introduction
The proposed fifth edition of the World Health Organization classification (WHO-HAEM5)1 and the International Consensus Classification of myeloid neoplasms (ICC)2 were published nearly simultaneously in 2022 and described updated approaches to categorizing myeloid neoplasms. These classifications introduced new subtypes based on genetic characteristics, which may result in the identification of distinct subgroups within previously heterogeneous diagnostic categories. A feature of both systems was the assignment of a subtype in a hierarchical manner. Such an approach results in a major discrepancy between the 2 classifications which occurs after the categorization of acute myeloid leukemia (AML) with defining genetic abnormalities. ICC defines AML with mutated TP53 as a standalone entity, which takes priority over AML with myelodysplasia-related gene mutations (ICC-AML-MR-M), AML with myelodysplasia-related cytogenetics (ICC-AML-MR-CG), and AML not otherwise specified (AML-NOS). In contrast, WHO-HAEM5 does not consider TP53 status for classification purposes and instead proceeds with AML, myelodysplasia-related (WHO-AML-MR)–an entity initially defined by WHO 2017 with ontogeny, cytogenetics and morphology,3 which now mainly focuses on molecular and cytogenetic abnormalities, while still including AML transformation of MDS and MDS/MPN. Following the classification of AML-MR, WHO-HAEM5 proceeds to categorize cases as AML by differentiation (AML-DIFF).
Although both classifications have overlapping MR-defining molecular and cytogenetic criteria, there are notable differences. Compared with WHO-HAEM5, ICC MR-defining cytogenetic abnormalities include trisomy 8, monosomy 17, and del(20q), and exclude monosomy 13 and del(13q). The previously termed secondary-type mutations (SRSF2, SF3B1, U2AF1, ZRSR2, ASXL1, EZH2, BCOR, and STAG2) are now added to define WHO-HAEM5 category of AML-MR.1,4 In addition to these 8 genes, the ICC classification also includes RUNX1 to form its MR-defining gene mutations,2 because RUNX1 is frequently associated with older age, secondary AML, and secondary-type mutations.5-7 Nevertheless, the category of AML-MR is now the largest group of AML in the new classification systems, accounting for ∼35% by WHO-HAEM5 or 30% by ICC of all AML cases.8-10
Since the publication of the 2 classifications, confusion has arisen among practicing pathologists and clinicians with regards to the optimal implementation of these classification systems into everyday practice, especially for AML-MR. Therefore, a harmonized model for AML classification is greatly needed to improve AML subtyping, treatment decision making, and patient care. The objective of this study is to analyze and compare the new WHO-HAEM5 and ICC classifications with regards to AML-MR to develop a unified model for clinical practice.
Methods
Patients and samples
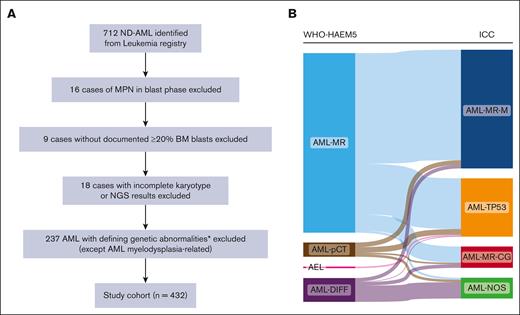
We conducted a single-center retrospective cohort study. The University Health Network/Princess Margaret Cancer Centre database was used to identify patients with AML with complete clinical and diagnostic results, as well as next-generation sequencing (NGS) data. Patients diagnosed with AML between 2016 and 2022 were retrospectively analyzed. Patients were classified based on WHO-HAEM5 and ICC criteria according to classification algorithms (supplemental Figure 1). A publicly available dataset from the BEAT-AML 2.0 study was used to validate our findings.11 The collection of samples and the study protocol adhered to the principles outlined in the Declaration of Helsinki and received approval from the University Health Network Research Ethics Board. Upon initial diagnosis of AML, all patients underwent bone marrow (BM) aspiration, conventional cytogenetics, and molecular testing/sequencing analyses, following established guidelines. Patients with AML with defining genetic abnormalities (other than AML-MR) were excluded from the study cohort, as were patients with incomplete blast count results, karyotype or NGS results and patients with myeloproliferative neoplasms (MPN) in blast phase (Figure 1A).
The flow chart of selecting patients with AML for this study and their composition based on WHO-HAEM5 and ICC classifications. (A) The flowchart outlining the eligibility criteria for the study. (B) The overlapping cases between the WHO and ICC classifications, demonstrating the flow of the study cohort within the 2 classifications. ∗APL with PML::RARA (4), AML with RUNX1::RUNX1T1 fusion (8), AML with CBFB::MYH11 fusion (17), AML with DEK::NUM214 fusion (2), AML with KMT2A rearrangement (16), AML with MECOM rearrangement (13), AML with NPM1 mutation (150), AML with CEBPA mutation (21), AML with BCR::ABL1 fusion (3), AML with other defined alterations (3).
The flow chart of selecting patients with AML for this study and their composition based on WHO-HAEM5 and ICC classifications. (A) The flowchart outlining the eligibility criteria for the study. (B) The overlapping cases between the WHO and ICC classifications, demonstrating the flow of the study cohort within the 2 classifications. ∗APL with PML::RARA (4), AML with RUNX1::RUNX1T1 fusion (8), AML with CBFB::MYH11 fusion (17), AML with DEK::NUM214 fusion (2), AML with KMT2A rearrangement (16), AML with MECOM rearrangement (13), AML with NPM1 mutation (150), AML with CEBPA mutation (21), AML with BCR::ABL1 fusion (3), AML with other defined alterations (3).
Treatment
Intensive chemotherapies (IC) were given to fit patients and included 7+3 (cytarabine plus daunorubicin), 7+3 plus midostaurin for FLT3-mutated AML, FLAG-IDA (fludarabine, cytarabine, filgrastim, and idarubicin), or Nove-HiDAC (mitoxantrone, etoposide, and modified high-dose cytarabine). Low-intensity therapy (LIT) regimens, such as hypomethylating agents (azacytidine or decitabine) alone or in combination with BCL2 inhibitor (venetoclax); low-dose cytarabine were administered to patients deemed not eligible for induction chemotherapy. Allogeneic hematopoietic stem cell transplantation (HCT) was carried out in patients with intermediate and high-risk disease in first complete remission (CR)12 but also for those primary patients with refractory or relapsed disease who achieved remission after salvage chemotherapy if an available donor was identified. Patients received 1 to 2 cycles of consolidation chemotherapy before proceeding with allogenic HCT. Best supportive care was offered to patients who were deemed not suitable for IC or LIT.
Karyotyping
Diagnostic BM samples were subjected to karyotyping analysis. Cytogenetic analysis was performed using standard chromosome banding techniques, and the results were documented in compliance with ISCN recommendations.13 A minimum of 20 metaphases were evaluated for each patient. Complex karyotype was defined as presence of ≥3 unrelated cytogenetic abnormalities, in the absence of other class-defining recurring genetic abnormalities.2,12
Molecular testing and sequencing
Total cellular RNA extracted from peripheral blood and BM samples was used for multiplex reverse transcriptase polymerase chain reaction to evaluate NPM1 mutation status, FLT3-ITD, and FLT3-TKD. Targeted sequencing (TAR-SEQ) was performed in patients diagnosed before 2018 using a 54-gene NGS myeloid panel.14 NGS was conducted in patients diagnosed after 2018 using a custom hybrid-capture–based myeloid panel consisting of 49 genes implicated in myeloid malignancies as previously reported.15-17 The limit of detection for variant calling was 2%. Variants were annotated and then classified as oncogenic mutations or variants of unknown significance, as previously described.18 The variants of unknown significance were later excluded from the analysis. When multiple mutations occurred in the same gene, the higher variant allele frequency (VAF) was used for analysis. Genes that overlapped in 2 panels were included in the analyses. The gene panel and exon coverage for hotspot genes is listed in supplemental Table 1.
Statistical analysis
Continuous variables were described by median and range and compared with Wilcoxon rank-sum test, whereas counts and percentages were described for categorical variables and compared with χ2 or Fisher exact test. Overall survival (OS) was calculated from the date of diagnosis until the last follow-up or death, whereas event-free survival (EFS) was calculated from the date of diagnosis until the last follow-up, relapse, or death. Survival estimations with 95% confidence intervals (CI) were computed using the Kaplan-Meier product-limit method and survival curves were compared using the log-rank test. Adjust P values for multiple comparisons was performed using Benjamin and Hochberg method.19 All analyses were performed using R (R version 4.2.3; RStudio version 2023.06.0 Build 421), and statistical significance was set at P < .05 (gene mutation correlation analysis was set at P < .01).
Results
Patient characteristics
The study cohort comprised a total of 432 patients (Table 1); a Sankey plot is provided in Figure 1B to illustrate the differences in diagnoses according to WHO-HAEM5 and ICC classifications. Among these patients, 354 were classified as AML, myelodysplasia-related (WHO-AML-MR) and the remaining were AML-DIFF (n = 47), acute erythroid leukemia (AEL, n = 3) and AML post cytotoxic therapy (AML-pCT, n = 28) (supplemental Table 2). Alternatively, using the ICC classification, 275 patients were classified as a combined group of AML-MR based on gene mutations and/or cytogenetics (ICC-AML-MR-M/CG), followed by 115 AML-TP53, and 42 AML-NOS. Table 2 summarizes the differences between the 2 classifications of the study cohort, of which 250 patients were overlapped to qualify for AML-MR by both systems, 32 were overlapped as AML-DIFF/NOS, all AEL cases were classified as AML-TP53, and 28 patients of AML-pCT were classified accordingly by ICC. Comparing the 2 groups, ICC-AML-MR-M/CG had significantly less frequent abnormal karyotype (P = .011), complex karyotype (P < .001), and monosomy 17 (P < .001), and greater number of gene mutations (P = .012) than WHO-AML-MR. In addition, by definition, TP53 was only present in WHO-AML-MR cohort (P < .001) and prior cytotoxic therapy was present only in ICC-AML-MR-M/CG as qualifier (P < .001). As expected, RUNX1 mutations were significantly enriched in ICC-AML-MR-M/CG compared with that in WHO-AML-MR (P = .004). Other clinicopathological features, including sex, age at diagnosis, baseline hematological parameters, chemotherapy intensity, HCT, and other genetic abnormalities were not significantly different between WHO-AML-MR and ICC-AML-MR-M/CG (Table 1).
Genetic landscape
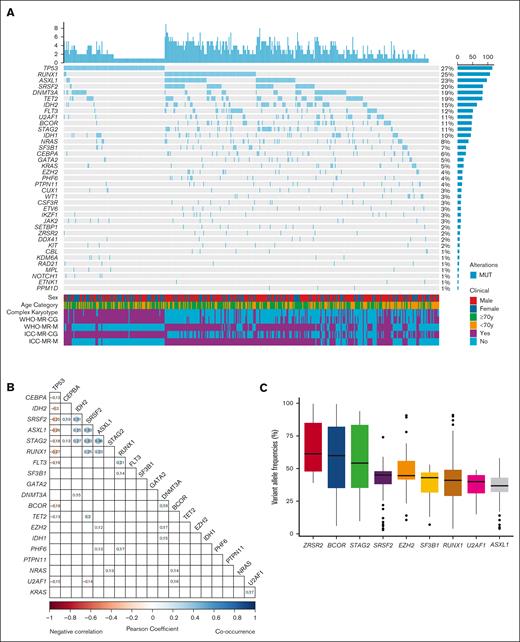
A total of 234 (median 3, range 0-9 per patient) mutations were identified in 420 patients (97.2%). Figure 2 describes the genetic mutation spectrum and mutational co-occurrence or negative correlation in the study cohort. Among the common genes in the panels, 12 genes were mutated in >10% of the cohort (Figure 2A). The most commonly mutated genes were TP53 (n = 115, 27%), followed by RUNX1 (n = 107, 25%), ASXL1 (n = 97, 23%), SRSF2 (n = 84, 20%), DNMT3A (n = 83, 19%), TET2 (n = 82, 19%), IDH2 (n = 64, 15%), FLT3 (n = 51, 12%), U2AF1 (n = 49, 11%), BCOR (n = 47, 11%), STAG2 (n = 46, 11%), and IDH1 (n = 45, 10%). Female gender, older age, and complex karyotype were enriched in patients with mutated TP53.
Mutation landscape of the study cohort. (A) Comutation oncoprint of the study cohort. Genes with genomic alterations are listed in descending order of frequency. Each column represents a patient, and each row represents a gene alteration or clinical feature. The top barplot shows the number of mutations for each patient and the right barplot shows the percentage of samples that have alterations for each gene. The bottom heatmap shows the clinical parameters of each patient. (B) Correlation plot of the commonly mutated genes. Blue color indicates positive correlation and red color indicates negative correlation. Values represent the coefficients and significant pairs are shown. (C) Analysis of variant allele frequencies (VAFs) of MR defining mutations in the study cohort. The boxplot shows the median (solid line), 25th, 75th percentiles, and minimum and maximum VAF observed across the patients who harbored the MR gene mutations. The order is sorted by median VAF from high to low.
Mutation landscape of the study cohort. (A) Comutation oncoprint of the study cohort. Genes with genomic alterations are listed in descending order of frequency. Each column represents a patient, and each row represents a gene alteration or clinical feature. The top barplot shows the number of mutations for each patient and the right barplot shows the percentage of samples that have alterations for each gene. The bottom heatmap shows the clinical parameters of each patient. (B) Correlation plot of the commonly mutated genes. Blue color indicates positive correlation and red color indicates negative correlation. Values represent the coefficients and significant pairs are shown. (C) Analysis of variant allele frequencies (VAFs) of MR defining mutations in the study cohort. The boxplot shows the median (solid line), 25th, 75th percentiles, and minimum and maximum VAF observed across the patients who harbored the MR gene mutations. The order is sorted by median VAF from high to low.
A total of 35 pairs of gene mutations showed significant correlation. Most notably, we found significant negative correlations between TP53 mutation and other 10 genes (CEBPA, IDH2, SRSF2, ASXL1, STAG2, RUNX1, FLT3, BCOR, TET2, and U2AF1). A cluster of mutation co-occurrence was seen between MR defining genes (ASXL1/SRSF2, ASXL1/STAG2, and SRSF2/STAG2) as well as IDH2 (IDH2/SRSF2, IDH2/ASXL1, and IDH2/STAG2) (Figure 2B). We also analyzed the VAF of the MR-defining gene mutations, of which ZRSR2, BCOR, and STAG2 had median VAFs >50% (Figure 2C).
Treatments and outcomes
Of 432 patients, 215 (50%) received IC, 93 (21%) received LIT, and 43 (10%) were given hypomethylating agent plus venetoclax, whereas best supportive care was given in 81 (19%) patients. Among patients who received intensive chemotherapy, CR was achieved in 143 (69%) patients of which 76 (60%) patients relapsed. HCT was carried out in 115 (27%) patients. The median follow-up time was 29.7 months, and median OS was 9.6 months. WHO-AML-MR had significantly inferior OS compared to that in ICC-AML-MR-M/CG (hazard ratio [HR], 1.25; 95% CI, 1.02-1.52; P = .032) and borderline inferior EFS (HR, 1.20; 95% CI, 0.99-1.44; P = .06). The rest of survival analyses were restricted to patients who underwent intensive chemotherapy. No significant differences in survival outcomes were observed in the patients who were intensively treated (WHO-AML-MR vs ICC-AML-MR-M/CG: HR, 1.20; 95% CI, 0.89-1.62; P = .24 in OS and HR: 1.16; 95% CI, 0.88-1.53; P = .28 in EFS; supplemental Figure 2, A and B). Based on risk stratification by European LeukemiaNetwork (ELN) 2022 criteria, the adverse-risk group had significantly worse OS and EFS than the intermediate-risk group (HR, 2.57; 95% CI, 1.38-4.79; P = .002 and HR, 1.94; 95% CI, 1.18-3.17; P = .008, respectively; supplemental Figure 2, C and D).
Impact of TP53 mutations on survival outcomes
Patient characteristics with or without mutated TP53 were summarized in supplemental Table 3. TP53 mutations were associated with significantly higher relapse rate, less frequent treatment with IC or hypomethylating agent plus venetoclax, significantly lower HCT and CR rates. Moreover, patients with mutated TP53 had significantly worse outcomes than those without TP53 mutations (OS HR, 2.98; 95% CI, 2.01-4.42; P < .001 and EFS HR, 2.70; 95% CI, 1.87-3.91; P < .001; supplemental Figure 3).
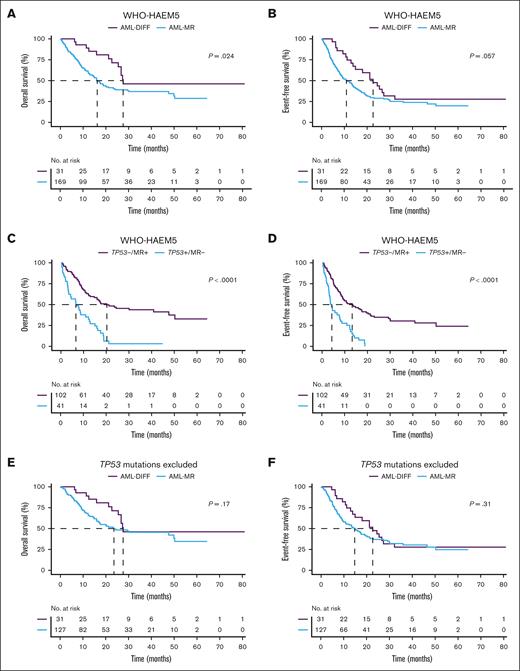
WHO-AML-MR had an inferior OS and a trend toward an inferior EFS compared to AML-DIFF (HR, 1.97; 95% CI, 1.08-3.59; P = .024 and HR, 1.60; 95% CI, 0.98-2.60; P = .057; Figure 3A and B). Because TP53 mutations define a standalone entity in ICC but not WHO-HAEM5, we reanalyzed WHO-HAEM5 criteria and allocated patients with TP53 mutations into a separate subgroup. AML-MR without concurrent TP53 mutations (TP53-MR+) showed significantly better OS than those with AML with mutated TP53 (TP53+MR-) (P < .001 in OS and EFS, respectively; Figure 3C and D). After excluding patients with mutated TP53, there were no statistical significances in the comparison of AML-MR vs AML-DIFF OS and EFS (HR, 1.54; 95% CI, 0.83-2.86; P = .17 and HR, 1.29; 95% CI, 0.78-2.14; P = .31; Figure 3E and F).
Kaplan-Meier survival plots comparing WHO-HAEM5 defined patients. (A, B) OS and EFS between AML-MR and AML-DIFF. (C, D) OS and EFS between AML-MR without TP53 mutations (TP53−/MR+) and AML with mutated TP53 but without MR gene mutations (TP53+/MR−). (E, F) OS and EFS in AML-MR and AML-DIFF after excluding the TP53 mutations.
Kaplan-Meier survival plots comparing WHO-HAEM5 defined patients. (A, B) OS and EFS between AML-MR and AML-DIFF. (C, D) OS and EFS between AML-MR without TP53 mutations (TP53−/MR+) and AML with mutated TP53 but without MR gene mutations (TP53+/MR−). (E, F) OS and EFS in AML-MR and AML-DIFF after excluding the TP53 mutations.
Previously, we had shown that TP53 mutations were associated with inferior outcomes in patients with AML with myelodysplasia-related changes (AML-MRC) regardless of TP53 allelic state.15 We sought to evaluate whether this holds true in the AML-MR cohort. A workflow to allocate TP53 allelic state in our cohort is presented in supplemental Figure 4A. Although patients with either single or double/multi-hit TP53 mutation(s) had significant worse OS (single-hit vs wild-type P < .001; multi-hit vs wild-type P = .003) and EFS (single-hit vs wild-type P < .001; multi-hit vs wild-type P = .002) compared with patients with TP53 wild-type, there were no significant differences between single-hit or multi-hit TP53 mutations among patients with AML-MR who were intensively treated (P = .3 and P = .52 in OS and EFS, respectively; supplemental Figure 4B and C).
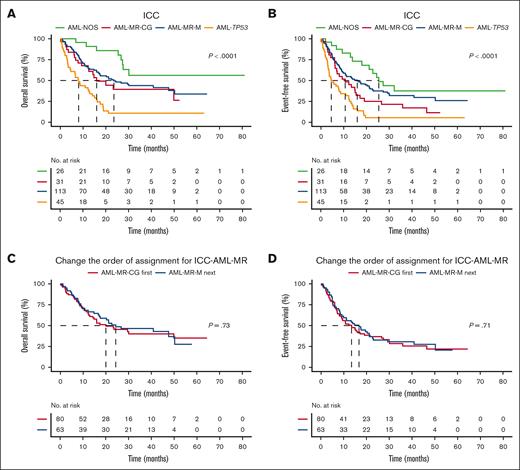
Based on ICC, AML-TP53 had significantly inferior compared with AML-NOS (HR, 5.9; 95% CI, 2.73-12.8; P < .001), ICC-AML-MR-M (HR, 2.8; 95% CI, 1.84-4.27; P < .001), and ICC-AML-MR-CG (HR, 2.32; 95% CI, 1.32-4.08; P = .004). ICC-AML-MR-M and ICC-AML-MR-CG had similar outcomes (HR: 0.83, 95% CI: 0.49-1.41, P = .519) and were both inferior compared with AML-NOS (HR, 2.11; 95% CI, 1.01-4.43; P = .048 and HR, 2.55; 95% CI, 1.11-5.88; P = .028, respectively; Figure 4A). Similar findings were also seen in EFS analysis (AML-TP53 vs AML-NOS, P < .01; AML-TP53 vs ICC-AML-MR-M, P < .01; AML-TP53 vs ICC-AML-MR-CG, P = .028; ICC-AML-MR-M vs AML-NOS, P = .138; ICC-AML-MR-CG vs AML-NOS, P = .02; ICC-AML-MR-M vs ICC-AML-MR-CG, P = .124; Figure 4B).
Kaplan-Meier survival plots comparing ICC defined patients. (A, B) OS and EFS between AML with mutated TP53, AML-MR defined by gene mutations (AML-MR-M), AML-MR defined by cytogenetics (AML-MR-CG), AML not otherwise specified (AML-NOS). (C, D) OS and EFS in patients with reversed defining order of AML-MR.
Kaplan-Meier survival plots comparing ICC defined patients. (A, B) OS and EFS between AML with mutated TP53, AML-MR defined by gene mutations (AML-MR-M), AML-MR defined by cytogenetics (AML-MR-CG), AML not otherwise specified (AML-NOS). (C, D) OS and EFS in patients with reversed defining order of AML-MR.
The order of defining ICC-AML-MR-M/CG by gene mutations or cytogenetics has limited prognostic significance
Because the ICC specifies that AML-MR defined by gene mutations takes precedence over AML-MR defined by cytogenetics for classification purposes, we further analyzed this group to see whether the order of assignment has a prognostic impact. As mentioned, AML-MR-M and AML-MR-CG grouped according to ICC guidelines exhibited similar survival outcomes. When assigning priority to MR-defining cytogenetics, the differences in OS and EFS between AML-MR-M and AML-MR-CG were not significant (HR, 0.92; 95% CI, 0.58-1.47; P = .73 and HR, 0.93; 95% CI, 0.61-1.40; P = .71, respectively; Figure 4C and D).
Impact of prior history of myeloid neoplasms and cytotoxic therapy
WHO-HAEM5 definition of AML-MR includes patients with a prior history of myeloid neoplasm (MDS or MDS/MPN) and progressed to full-blown leukemia. We found that in the patients who were intensively treated, AML-MR progressed from MDS or MDS/MPN had significantly better outcomes than de novo AML-MR (P = .012 and P = .031 for OS and EFS, respectively). Conversely, in the ICC defined AML-MR-M/CG group, there were no significant differences in OS and EFS between de novo and progression from MDS or MDS/MPN (P = .16 and P = .35, respectively) (supplemental Figure 5).
There were 28 patients with AML-pCT in our cohort. We attempted to investigate whether it is justifiable to consider post cytotoxic therapy as a disease qualifier as in ICC. Among patients who received treatment, the corresponding ICC classifications were 6 AML-TP53, 9 AML-MR-M/CG, and 4 AML-NOS. AML-TP53 and AML-MR-M/CG were not significantly different in OS (P = .843), but both were significantly worse than AML-NOS (P = .022 and P = .029, respectively). However, no significant difference was observed in EFS analysis (P = .81, P = .22, and P = .32, respectively) (supplemental Figure 6).
Validating our findings with a public dataset
To validate our findings, we used a publicly available data set from the BEAT AML 2.0 study and analyzed patients who received treatment without WHO-HAEM5 class defining recurrent genetic abnormalities comparable to the approach that we analyzed in our cohort (supplemental Figure 7). When classifying based on WHO-HAEM5, WHO-AML-MR had significantly worse OS compared to AML-DIFF (P = .007; supplemental Figure 8A). When separating TP53 as a separate entity, WHO-AML-MR had a trend toward inferior OS compared with AML-DIFF (P = .058), and both groups had significantly superior OS compared with the TP53 group (P < .001 and P < .001, respectively; supplemental Figure 8B).
Based on ICC criteria, patients with AML-TP53 had significantly worse OS than ICC-AML-MR-M/CG and AML-NOS (P < .001 and P < .001, respectively). Although patients with ICC-AML-MR-M/CG had shorter median OS than AML-NOS (11.9 vs 20.8 months), the difference was not statistically significant (P = .12; supplemental Figure 8C). Taking a similar approach as in our cohort, the order of assigning AML-MR by prioritizing gene mutations or cytogenetics did not have significant prognostic significance (P = .398 and P = .896, respectively; supplemental Figure 8D).
Discussion
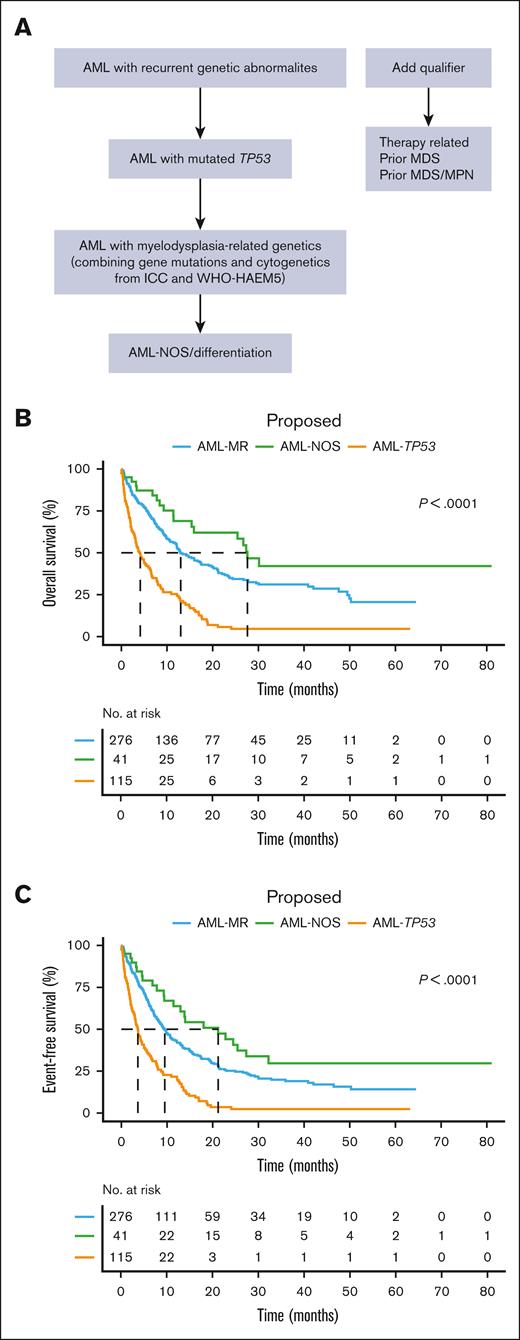
The publication of 2 classifications of hematolymphoid neoplasms proposed new challenges to practicing clinicians and pathologists. Many differences between the 2 systems merely stem from ambiguity and lack of evidence or arbitrary standards. Moreover, it is normal practice for academic institutions to propose, develop, and refine new classifications.20 Herein, we present a retrospective study with real-world data to evaluate AML-MR defined by WHO-HAEM5 and ICC. Our study highlights the importance of separating TP53-mutated AML as a standalone entity from AML-MR based on its distinct biology and outcomes, as outlined by ICC. Furthermore, whether we assign ICC MR defining mutation first, or cytogenetics first, does not significantly alter patient outcomes. Based on this, we suggest that MR defining mutations and cytogenetics can be grouped to form a single entity, as outlined by WHO-HAEM5. Considering these results, we propose a harmonized algorithm to better reflect AML pathobiology and clinical outcomes (Figure 5A); this harmonized algorithm is efficient at risk stratifying this large group of patients with AML after excluding AML with defining genetic abnormalities (Figure 5B and C).
Proposed classification algorithm and predicted outcomes. (A) Proposed algorithm for harmonization of 2 classifications with respect to AML myelodysplasia-related genetics. (B, C) Kaplan-Meier survival plots of OS and EFS based on the proposed algorithm.
Proposed classification algorithm and predicted outcomes. (A) Proposed algorithm for harmonization of 2 classifications with respect to AML myelodysplasia-related genetics. (B, C) Kaplan-Meier survival plots of OS and EFS based on the proposed algorithm.
TP53 mutations are frequently associated with complex karyotype, negative correlation with other gene mutations, and dismal outcomes regardless of therapy.2,4,15,21-24 The divergences in 2 classifications regarding TP53 are (1) WHO-HAEM5 does not have a TP53-AML category and (2) ICC includes pure erythroid leukemia in the AML-TP53 but WHO-HAEM5 includes it in the AML-DIFF. Our results show that TP53 mutations are associated with distinct pathological features and extremely dismal outcomes. However, because WHO-AML-MR does not separate TP53 mutated AML, we observed in our cohort that the clinical outcomes in this group were still heterogeneous. All of our AEL cases had mutated TP53 and 2 out of 3 had multi-hit TP53 mutations, which is in line with previous studies.25,26 To reflect the association with TP53 mutations and dismal prognosis, WHO-HAEM5 specifies that AEL diagnosis supersedes AML-MR. However, because of the rarity of this disease, future studies with larger cohort are required to further elucidate this entity, especially its association with biallelic TP53 mutations. From a treatment standpoint, CPX-351 (Vyxeos), a liposomal combination of daunorubicin and cytarabine, which was approved for treatment of adults with newly diagnosed therapy-related AML or AML-MRC,27 has shown lower response rate in TP53 mutated AML.28-31 As we previously reported, TP53 mutated AML showed extremely poor outcomes, irrespective of prior history of MDS or MDS/MPN, cytogenetic lesions used to define AML-MRC, TP53 allelic state or VAF, thus should be considered a distinct entity and warrant novel therapies urgently.15 Based on these results, TP53 mutated AML should be viewed as a separate entity, and likely requires a unique therapeutic approach.
Based on ICC’s algorithm, AML with myelodysplasia-related genetics is defined by 9 gene mutations first to form a group AML with myelodysplasia-related gene mutations followed by AML with myelodysplasia-related cytogenetic abnormalities. Our study shows that this approach is not necessary because we found that the order of assigning AML-MR does not predict for clinical outcomes. According to our results, contrary to WHO-AML-MR with TP53 excluded which showed no significant difference compared with AML-DIFF, ICC-AML-MR-M/CG demonstrated inferior OS relative to AML-NOS. This distinction can provide better discretion in prognostication. Although the validation cohort confirms significantly worse OS in AML-TP53 compared with ICC-AML-MR-M/CG or AML-NOS, there was no statistically significant difference in OS between ICC-AML-MR-M/CG and AML-NOS, although a numerically shorter median OS was observed in AML-MR-M/CG compared with AML- NOS group. The lack of statistically significant difference between these 2 groups might be due to a relatively small sample size in AML-NOS cohort, and/or the heterogeneity of patients within the validation cohort compared to our institutional cohort.
The impact of cytogenetics on survival outcome in AML-MR by the 2 classifications remains poorly understood. ICC differs from WHO-HAEM5 by the addition of trisomy 8, monosomy 17, and del(20q), and the omission of monosomy 13 and del(13q). In our cohort, the major discrepancy in terms of AML-MR defining cytogenetics were trisomy 8 followed by del(20q) (data not shown; all monosomy 17 patients had complex karyotype which fulfilled the criteria for WHO-AML-MR). A previous study found trisomy 8 was associated with poor prognosis in secondary AML,32 however, no survival impact was observed in our study (data not shown). In fact, the survival outcomes of patients who presented with cytogenetic abnormalities defined by ICC but not WHO were significantly better than those who had cytogenetic abnormalities defined in both systems (P = .025 in OS; supplemental Figure 9). This may imply that trisomy 8 is not a strong indicator for prognosis. Interestingly, although incorporated by ICC, monosomy 17 is significantly less frequent in ICC than WHO-HAEM5 defined AML-MR. This is mainly because TP53 mutations are associated with monosomy 17 and the ICC has introduced a standalone entity for TP53-mutated AML.33,34
Secondary AML, whether arising from antecedent myeloid neoplasms or prior cytotoxic therapy, are now diagnostic qualifiers in ICC, whereas in WHO-HAEM5, AML progressed from MDS or MDS/MPN are classified as AML-MR, and therapy-related AML is renamed as myeloid neoplasm post cytotoxic therapy. In our cohort, only 4 patients had a history of MDS or MDS/MPN alone, suggesting that AML progressing from MDS or MDS/MPN will almost always have MDS-type genetics. Thus, the divergence in WHO-HAEM5 and ICC with regard to the implementation of history of MDS or MDS/MPN as a diagnostic criterion for AML-MR or qualifier only affects a relatively small number of cases. As for prior cytotoxic therapy, although the number is limited, our results showed that AML-TP53 and AML-MR-M/CG were still inferior compared with AML-NOS, suggesting that genetic features may be better prognostic indicators than history of cytotoxic therapy, and further justifies the notion of considering it as a disease qualifier. The priority of ICC is to classify diseases according to their morphology and genetic features35 and a previous study on patients with AML treated with HCT had found that prior history contains limited prognostic value.36 Finally, no cases withgermline mutations were observed in our cohort, thus we did not investigate this qualifier’s clinical significance and did not include it in the proposed algorithm.
We acknowledge that our study has several limitations. First of all, this is a single-center study which may not be generalized to other settings. However, the treatment protocols are more uniform than multicenter studies. Secondly, some subgroup analyses were limited by small sample sizes. Especially we did not have cases of germline disposition, therefore we did not explore its feature as a disease qualifier. Future studies with larger patient cohorts are needed to confirm our data and comprehensively evaluate the minor differences in cytogenetics and mutations between the ICC and WHO-HAEM5. We also acknowledge that ICC does formally define a unified AML-MR entity but for analysis we had purposefully grouped the AML myelodysplasia-related gene mutations and cytogenetics together to compare with WHO AML-MR.
In conclusion, AML-MR defined by WHO-HAEM5 is a heterogeneous group compared with ICC; this difference was almost entirely because of the inclusion of patients with mutated TP53-mutated based on WHO criteria. When excluding patients with mutated TP53, AML-MR defined by gene mutations and cytogenetic abnormalities shows similar outcomes regardless of the order of assignment. Overall, we suggest harmonizing the classifications of AML with myelodysplasia-related genetics by excluding cases with TP53 mutations and combining MR-defining gene mutations and cytogenetic abnormalities in a single group.
Acknowledgments
The authors thank all the clinicians, nurses, and allied health professionals for their dedication to patients with leukemia at the University Health Network/Princess Margaret Cancer Centre.
Authorship
Contribution: Q.Z. collected and analyzed the data, and wrote the manuscript; D.Z. analyzed the data and revised the manuscript; M.Z. collected and analyzed the data; M.D., M.M., A.T., Y.W.T.Y., and C.W. reviewed and provided critical revisions to the manuscript; and H.C. designed and supervised the study, analyzed the data, and wrote the manuscript.
Conflict-of-interest disclosure: The authors declare no competing financial interests.
Correspondence: Hong Chang, Laboratory Medicine and Pathobiology, Temerty Faculty of Medicine, University of Toronto; Consultant Hematopathologist, Laboratory Hematology, Laboratory Medicine Program, University Health Network, 11E-413, 200 Elizabeth St, Toronto, ON, M5G 2C4 Canada; email: Hong.chang@uhn.ca.
References
Author notes
For original data, please contact the corresponding author, Hong Chang (hong.chang@uhn.ca).
The full-text version of this article contains a data supplement.

