Key Points
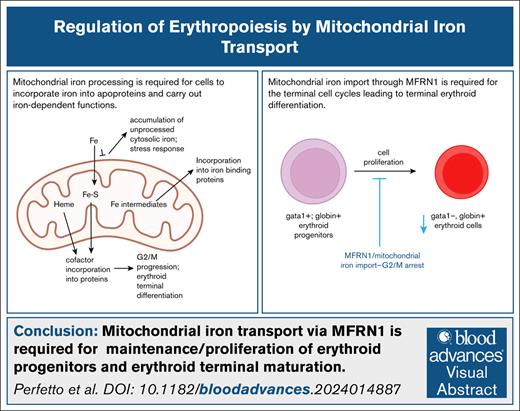
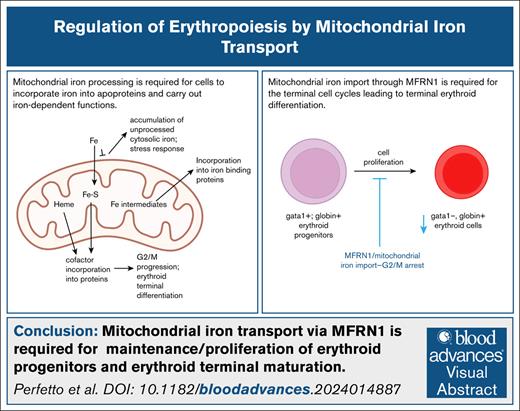
Mitochondrial iron transport is required for G2/M progression during the cell cycles of terminal erythropoiesis.
MFRN1 is required for maintenance/proliferation of erythroid progenitors and terminal maturation into globin-expressing erythroid cells.
Visual Abstract
Iron metabolism drives key erythropoietic processes, including hemoglobinization, survival, and proliferation. Here, we developed in vivo methods to interrogate how iron regulates erythropoiesis and report that mitochondrial iron transport via mitoferrin-1 (MFRN1) is essential for erythroid cell cycle progression. mfrn1 embryos had severely decreased erythroid cell number caused by cell cycle arrest at G2/M. They had enlarged nuclei, suggesting a mitotic defect. Iron supplementation rescued the cell cycle defect, implicating mitochondrial iron deficiency as its cause. In contrast, fpn1 mutants, anemic from systemic iron deficiency, had less severe decreases in erythroid mitochondrial iron than mfrn1 mutants and no proliferative defects. Single-cell RNA sequencing and fluorescence-activated flow sorting analyses for cd41 (thrombocytic) and gata1 reporters indicated that developmental defects in mfrn1 mutants were largely erythroid restricted. This defect was specific to terminally differentiating erythroid cells. Although mfrn1 mutant erythroid cells from 1.5 days post fertilization (dpf) embryos did not experience decreased cell number, mfrn1 mutant gata1+ erythroid progenitors were severely decreased at 3 dpf, and a further decrease in globin-expressing terminally differentiating erythroid cells. Although wild-type erythroid cells mostly lost expression of the gata1 progenitor marker by 3 dpf, mfrn1 mutant erythroid cells retained gata1 expression. These data are consistent with a model in which mitochondrial iron transport facilitates development of gata1+ erythroid progenitors and is required for the completion of erythropoiesis by facilitating mitosis in the terminal cell cycles.
Introduction
Iron deficiency anemia is a formidable public health problem, afflicting 27% of the world’s population and causing 8.8% of the world’s disability.1-3 In the United States, up to 77% of 12- to 21-year-old females are iron deficient.4-10 Iron metabolism defects in model organisms cause numerous erythropoietic defects via poorly understood mechanisms.11-16 Mitochondria are the site of eukaryotic heme and iron-sulfur (Fe-S) cluster synthesis and iron processing for incorporation into apoproteins.17 Mitoferrin (MFRN) proteins are the main importers of mitochondrial iron in eukaryotes.18 Loss of vertebrate MFRN1 significantly decreased heme synthesis, Fe-S cluster formation and assembly of mitochondrial iron binding proteins8,19-22 leading to severe anemia and embryonic lethality. Hematopoietic-specific deletion of MFRN1 caused anemia and increased erythroid progenitor numbers.7
Our studies aimed to determine how mitochondrial iron regulates erythropoiesis as distinct from systemic iron deficiency. Here, we used zebrafish as a model because they develop externally, allowing us to use vital dyes to track cell cycle and mitochondrial iron status in live embryos. To confirm that developmental defects were caused by deficient iron, we supplemented embryos with lipophilic iron chelates,18 not feasible in mammalian fetuses, which develop in utero. Because of the small number of cells in zebrafish embryos, the field has relied on visually sorting embryos into “mutant” and “wild-type (WT) and heterozygote” groups for fluorescence-activated flow sorting (FACS) experiments, which precludes interrogating subtler, potentially clinically relevant heterozygote phenotypes. We have therefore designed methods to label and sort erythroid cells from single zebrafish for imaging, mitochondrial iron, and cell cycle analyses, providing a resource to the zebrafish field and increasing the resolution of data acquisition from live organisms.
We interrogate erythropoietic defects in the absence of MFRN1 to model erythroid mitochondrial iron deficiency,8 or FPN1, which transports iron from the gut or yolk syncytia into the organism, as a model for systemic iron deficiency.9,23,24 We show that mitochondrial iron transport via MFRN1 is required for erythroid terminal differentiation, passing the G2/M cell cycle checkpoint and completion of proliferative cycles required for maturation. In contrast, FPN1-deficient erythroid cells, which have a systemic iron deficiency, did not experience these defects, likely because of higher mitochondrial iron levels. We hence demonstrate that mitochondrial iron transport plays a specific role during terminal erythropoiesis.
Methods and materials
Iron-hinokitiol treatment
Embryos were collected at 0 dpf, dechorionated, and incubated with 10 μM ferric ammonium citrate and 1 μM hinokitiol (Tokyo Chemical Industry; product no. H0142) or 20 μM ferric ammonium citrate with 15 μM hinokitiol in dimethyl sulfoxide in E3 media.18 Media was changed daily.
FACS sorting of zebrafish erythroid cells onto slides
Zebrafish embryos were washed with 1% bovine serum albumin in 100 μL phosphate-buffered saline (PBS; PBSB) and dissociated. PBSB (400 μL) was added and the suspension was strained with a 70-μM filter and centrifuged in a swinging bucket rotor for 5 minutes at 300g at room temperature (RT). Cells were fixed with 0.25% glutaraldehyde in PBSB for 5 minutes at room temperature (RT), washed in PBSB 3 times, and filtered. Green fluorescent protein–positive (GFP+) cells were sorted on a FACS Aria Fusion at 488 nm. Flow rate was set at 3 to 4. To sort cells onto slides, drop delay was adjusted each time to achieve >98% deflection. Cells were collected at 100 cells per spot and air-dried overnight in the dark.
Analysis of mitochondrial iron content
Zebrafish cells were stained with 10 μM rhodamine B-([1,10-phenanthroline-5-yl]-aminocarbonyl)benzyl ester (RPA; Bionet TS-7614) in PBSB for 30 minutes at RT in the dark. The cells were washed 3 times with PBSB and strained with a 70-μM filter. FACS analysis was carried out on an Aria FAC sorter; 488 nm and 532 nm lasers were used for GFP and RPA analysis, respectively.
Cell cycle analysis
Single embryos were washed twice with PBSB and incubated in ice-cold 1.5 mM 5-ethynyl-2′deoxyuridine (EdU; Thermo C10419) in 15% dimethyl sulfoxide for 1 hour. The embryos were washed twice with PBSB, incubated at 28°C for 30 minutes, and dissociated. Cells were washed twice with PBSB and fixed in 2% paraformaldehyde for 10 minutes, washed 3 times in PBSB, and permeabilized in 500 μL 0.1% Triton X-100 in PBSB for 15 minutes. Cells were washed 3 times in PBSB and subjected to a Click-It reaction to attach a 594-nm azide fluorophore to EdU (Thermo C10419). Cells were washed 3 times in PBSB and incubated with 1:1000 anti-GFP antibody (Abcam Ab290) for 30 minutes, washed 3 times with PBSB, and incubated with 1:800 anti-rabbit-488 antibody (Abcam Ab150077) for 30 minutes. The cells were washed 3 times in PBSB, mixed with 1:200 DyeCycle Violet (Invitrogen V35003), and filtered through a 70-μM strainer. The cells were incubated for 30 minutes and analyzed with an Aria FAC sorter; 450/50 nm, 488 nm, and 635 nm lasers were used for DyeCycle-Violet, GFP, and 594-EdU analysis, respectively. All incubations were performed in the dark at RT.
Statistical analysis
We analyzed statistical significance with 1-way analysis of variance and carried out multiple comparisons with a Tukey correction. Statistical significance was set at α = .05.
Preparation of zebrafish cells for single-cell RNA sequencing (scRNA-seq)
Ten, 3-days post fertilization (dpf) zebrafish embryos from WT and MFRN mutant fish were homogenized in 300 μL 10% fetal bovine serum (FBS) in PBS and filtered through a 70-μM strainer. The debris caught in the filter was genotyped (supplemental Methods). The suspension was again filtered through a 40-μM cell strainer.
scRNA-seq data analysis
10× Genomics scRNA-seq data processing and analyses were performed with the Seurat version 4.3.0 R package.25 Low-quality cells were excluded by filtering out cells with <1000 detected genes and cells with >15% mitochondrial RNA. Integration of the WT and MFRN mutant data was conducted using FindIntegrationAnchors function with default parameters. Data were normalized to counts per million and clustered using the RunPCA, FindNeighbors, and FindClusters functions using the first 30 principal components at 0.8 resolution. Two-dimensional projection of the clustering and visualization were carried out by the RunUMAP and DimPlot functions.
Zebrafish experiments were approved by the University of Delaware and University of Pittsburgh Institutional Animal Care and Use Committee.
Results
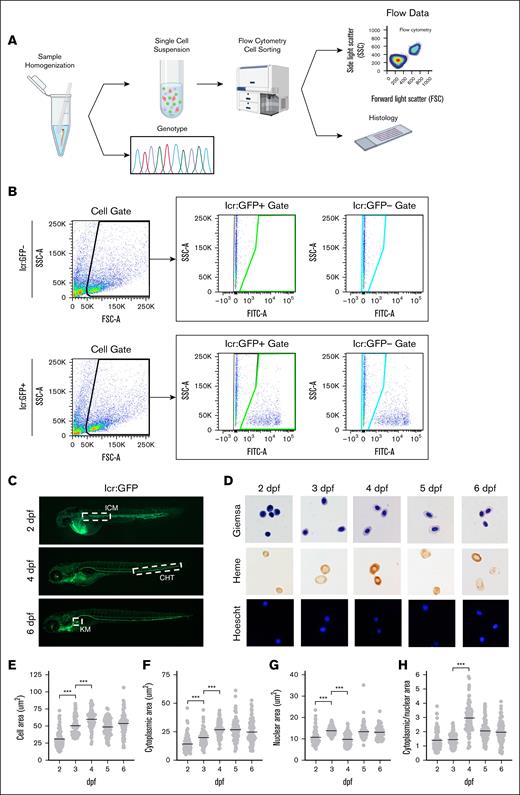
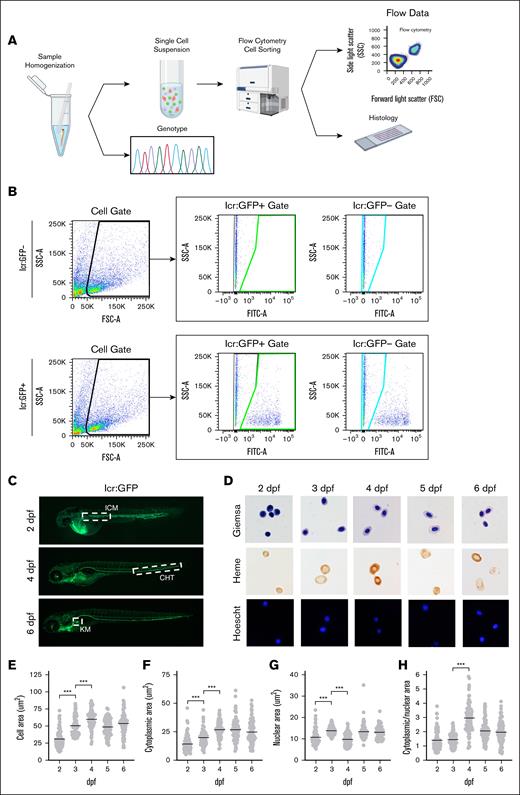
Previous zebrafish studies have obtained embryonic blood by tail amputation10 or sorting embryos based on visible phenotypes to obtain sufficient numbers of cells for FACS analysis.26 However, hematopoietic mutants have significantly decreased numbers of erythroid cells and cell losses during tail amputation preclude acquisition of quantitative data. Grouping zebrafish embryos into “WT/heterozygote” or “homozygous mutant” groups according to their visible phenotypes for batch processing26,27 precludes correlating quantitative information with genotypes, particularly because subtle, potentially clinically relevant heterozygote phenotypes are indistinguishable from WT embryos. Lastly, grouping by phenotype masks population variance within genotypes, necessitating development of methods to genotype and sort cells from single embryos (Figure 1A).
Experimental workflow and gating scheme used for sorting lcr:GFP+ erythroid cells. (A) Individual zebrafish are homogenized into a single-cell suspension in PBS containing 1% bovine serum albumin. Single cells were collected by filtration through a 70-μM cell strainer. Cells/debris caught in the filter were rinsed and collected for genotyping analysis by polymerase chain reaction (PCR) and Sanger sequencing of the PCR product. The filtrate (single-cell suspension) was processed for FACS and analysis. When indicated, cells were sorted onto microscope slides and processed for histological analysis. (B) Gating scheme to sort lcr:GFP+ and lcr:GFP− cells. Gates were set up using WT AB zebrafish embryos as a negative control. The single-cell population is gated by FSC and SSC (left panels; black outline). The GFP− population is defined by the FITC signal on cells from the negative controls that do not express GFP (teal outline); any FITC signal above that is defined as GFP+ (green outline). (C) lcr:GFP marks erythroid cells during development. At 2 dpf, primitive erythroid cells emerge from the ICM; at 4 dpf, definitive erythroid cells emerge from the CHT. By 6 dpf, the KM becomes the primary site of erythropoiesis. From 2 dpf onward, circulating erythroid cells (green) are also found in blood vessels. (D) Giemsa, Benzidine, and Hoechst staining of sorted lcr:GFP+ erythroid cells from pooled zebrafish embryos. Erythroid cells are hemoglobinized by 2 dpf but acquire a more elliptical shape at ∼4 dpf. (E) Erythroid cells grow in area through 4 dpf, largely due to increase in (F) cytoplasmic area. (G) Nuclear area is mostly constant from 2 to 6 dpf. (H) Cytoplasmic/nuclear area markedly increased ∼4 dpf, attributable to the increase in cytoplasmic area around this time. Magnification ×63. ∗∗∗P < .001. CHT, caudal hematopoietic tissue; FSC-A, forward scatter; ICM, intermediate cell mass; KM, kidney marrow; SSC-A, side scatter.
Experimental workflow and gating scheme used for sorting lcr:GFP+ erythroid cells. (A) Individual zebrafish are homogenized into a single-cell suspension in PBS containing 1% bovine serum albumin. Single cells were collected by filtration through a 70-μM cell strainer. Cells/debris caught in the filter were rinsed and collected for genotyping analysis by polymerase chain reaction (PCR) and Sanger sequencing of the PCR product. The filtrate (single-cell suspension) was processed for FACS and analysis. When indicated, cells were sorted onto microscope slides and processed for histological analysis. (B) Gating scheme to sort lcr:GFP+ and lcr:GFP− cells. Gates were set up using WT AB zebrafish embryos as a negative control. The single-cell population is gated by FSC and SSC (left panels; black outline). The GFP− population is defined by the FITC signal on cells from the negative controls that do not express GFP (teal outline); any FITC signal above that is defined as GFP+ (green outline). (C) lcr:GFP marks erythroid cells during development. At 2 dpf, primitive erythroid cells emerge from the ICM; at 4 dpf, definitive erythroid cells emerge from the CHT. By 6 dpf, the KM becomes the primary site of erythropoiesis. From 2 dpf onward, circulating erythroid cells (green) are also found in blood vessels. (D) Giemsa, Benzidine, and Hoechst staining of sorted lcr:GFP+ erythroid cells from pooled zebrafish embryos. Erythroid cells are hemoglobinized by 2 dpf but acquire a more elliptical shape at ∼4 dpf. (E) Erythroid cells grow in area through 4 dpf, largely due to increase in (F) cytoplasmic area. (G) Nuclear area is mostly constant from 2 to 6 dpf. (H) Cytoplasmic/nuclear area markedly increased ∼4 dpf, attributable to the increase in cytoplasmic area around this time. Magnification ×63. ∗∗∗P < .001. CHT, caudal hematopoietic tissue; FSC-A, forward scatter; ICM, intermediate cell mass; KM, kidney marrow; SSC-A, side scatter.
To characterize erythroid cells from single embryos, we used Tg(lcr:eGFP) transgenic fish, which express GFP under the control of the globin locus control region, marking erythroid cells as GFP+28 (Figure 1B). From 2 dpf, we observed circulating GFP+ erythroid cells (Figure 1C). We fixed and sorted GFP+ cells from multiple 2- to 6-dpf zebrafish embryos onto slides, staining cells with benzidine/Hoechst or Wright-Giemsa for heme or morphological analysis. Erythroid cell size grew and become more elliptical from 2 to 4 dpf (Figure 1E), predominantly driven by increases in cytoplasmic area (Figure 1F).29-31 Erythroid nuclear size was fixed by 2 dpf and did not condense from 2 to 6 dpf, unlike mammalian erythroid cells whose nuclei condense during terminal differentiation (Figure 1G). This suggests that condensation of zebrafish erythroid nuclei occurs during early differentiation, unlike in mammals.32-34 Morphological changes are reflected in increased cytosolic/nuclear area between 2 and 4 dpf (Figure 1H). These data show that FACS and immobilizing erythroid cells onto slides recapitulates observations from published zebrafish erythroid cell isolation methods.
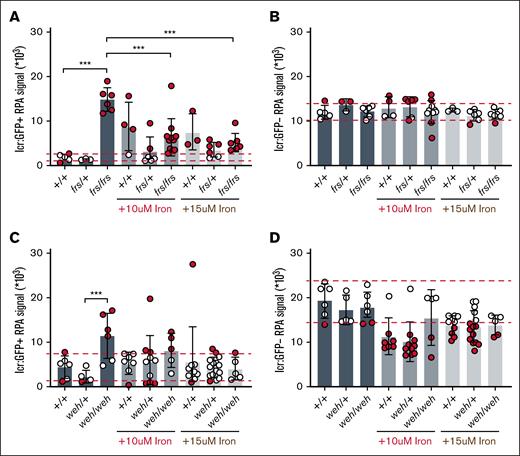
To understand how mitochondrial iron transport regulates erythropoiesis, we compared the erythropoietic phenotypes of previously identified frascati (frs; mfrn1) and weissherbst (weh; fpn1) zebrafish mutants.8,23 MFRN1 is the main mitochondrial iron transporter in erythroid cells,7,8,19 whereas FPN1 transports iron from the yolk to the embryo during early development,23,24 hence, weh embryos model systemic iron deficiency. We crossed frs (mfrn1) and weh (fpn1) mutants with Tg (globin lcr:eGFP) zebrafish to dissect their erythropoietic phenotypes. To quantitate mitochondrial iron, we stained 3-dpf WT and frs or weh mutant; Tg (lcr:eGFP) zebrafish embryos with RPA, a mitochondrial dye whose fluorescence is quenched by labile Fe2+ (the redox state in heme and Fe-S)35 and quantitated cellular RPA fluorescence from single embryos by FACS. Consistent with the importance of MFRN1 in mitochondrial iron import, frs/frs erythroid cells exhibited over 10-fold increased RPA fluorescence, indicating drastically decreased mitochondrial Fe2+ (Figure 2A).
RPA staining of live zebrafish embryos confirms decrease of mitochondrial iron in erythroid cells of mutant zebrafish lines and ability of Fe-hinokitiol to increase erythroid mitochondrial Fe2+ levels in mutant fish. (A) frs/frs mutant lcr:GFP+ erythroid cells have an increase in RPA signal, indicating significantly decreased Fe2+ levels relative to WT cells. Addition of iron-hinokitiol decreased RPA signal, indicating increased mitochondrial Fe2+. (B) frs/frs mutant lcr:GFP– (nonerythroid) cells did not significantly differ from WT cells in their RPA signal, indicating that Mfrn1 was largely not required for maintenance of nonerythroid mitochondrial Fe2+ levels. Addition of supplemental iron did not alter Fe2+ levels in frs/frs nonerythroid cells. (C) weh/weh mutant lcr:GFP+ erythroid cells have increased RPA signal, indicating significantly decreased Fe2+ levels relative to weh/+ cells. Addition of iron-hinokitiol decreased RPA signal, indicating increased mitochondrial Fe2+. (D) weh/weh mutant lcr:GFP– (nonerythroid) cells did not significantly differ from WT cells in their RPA signal, indicating that Fpn1 (despite its requirement for embryonic use of yolk iron) was largely not required for maintenance of nonerythroid mitochondrial Fe2+ levels. Addition of supplemental iron did not alter Fe2+ levels in weh/weh nonerythroid cells. ∗∗∗ Indicates statistical significance at 95% significance. Dashed red lines indicate 90% confidence intervals as defined by WT controls; red data points indicate data points that fall outside these 90% confidence intervals.
RPA staining of live zebrafish embryos confirms decrease of mitochondrial iron in erythroid cells of mutant zebrafish lines and ability of Fe-hinokitiol to increase erythroid mitochondrial Fe2+ levels in mutant fish. (A) frs/frs mutant lcr:GFP+ erythroid cells have an increase in RPA signal, indicating significantly decreased Fe2+ levels relative to WT cells. Addition of iron-hinokitiol decreased RPA signal, indicating increased mitochondrial Fe2+. (B) frs/frs mutant lcr:GFP– (nonerythroid) cells did not significantly differ from WT cells in their RPA signal, indicating that Mfrn1 was largely not required for maintenance of nonerythroid mitochondrial Fe2+ levels. Addition of supplemental iron did not alter Fe2+ levels in frs/frs nonerythroid cells. (C) weh/weh mutant lcr:GFP+ erythroid cells have increased RPA signal, indicating significantly decreased Fe2+ levels relative to weh/+ cells. Addition of iron-hinokitiol decreased RPA signal, indicating increased mitochondrial Fe2+. (D) weh/weh mutant lcr:GFP– (nonerythroid) cells did not significantly differ from WT cells in their RPA signal, indicating that Fpn1 (despite its requirement for embryonic use of yolk iron) was largely not required for maintenance of nonerythroid mitochondrial Fe2+ levels. Addition of supplemental iron did not alter Fe2+ levels in weh/weh nonerythroid cells. ∗∗∗ Indicates statistical significance at 95% significance. Dashed red lines indicate 90% confidence intervals as defined by WT controls; red data points indicate data points that fall outside these 90% confidence intervals.
Iron supplementation is a first-line treatment for iron deficiency, and Fe3+ chelates (because transferrin binds Fe3+) model pharmacologic iron supplementation.5,18,36 We asked whether Fe (ferric ammonium citrate)-hinokitiol, a lipophilic iron chelate that transports iron across membranes, could restore mitochondrial Fe2+ levels in vivo. This is a critical control because lipophilic Fe3+ bypasses transferrin-mediated iron uptake that reduces Fe3+ to Fe2+ in acidified endosomes via Six Transmembrane Epithelial Antigen of Prostate (STEAP) proteins.37 We treated zebrafish embryos with Fe-hinokitiol (supplemental Figure 1), which significantly decreased RPA fluorescence, indicating effective reduction of Fe3+-hinokitiol to Fe2+ (Figure 2A). Fe-hinokitiol treatment had no effect on mitochondrial Fe2+ levels in nonerythroid cells, indicating that responses to iron supplementation are cell specific (Figure 2B).
The mitochondrial iron defect in weh/weh mutant erythroid cells was less severe than that of frs mutants (Figure 2C). This is likely because of the presence of MFRN1, or because erythroid FPN1 deficiency increases iron retention.38 Similar to frs/frs mutants, mitochondrial Fe2+ content was unaffected in weh/weh nonerythroid cells (Figure 2D). Although weh/weh embryos model systemic iron deficiency, erythroid iron deficiency is more pronounced because of increased iron demand.38Figure 2A,C showed that iron doses that restored erythroid mitochondrial iron caused a paradoxical decrease in WT mitochondrial iron levels, potentially indicating that these doses are toxic (supplemental Figure 2).
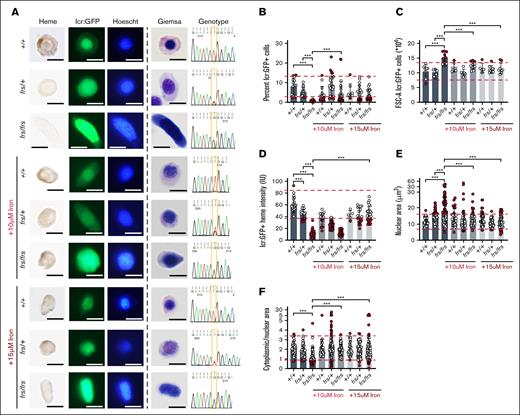
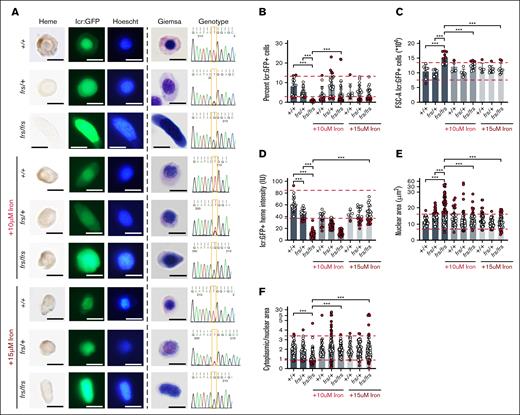
We sorted and imaged erythroid cells from 3-dpf single embryos from frs/+; Tg (globin lcr:eGFP) incrosses (Figure 1), analyzing potentially clinically significant phenotypes by delineating 90% confidence intervals on the WT population, used to define reference ranges in clinical laboratory tests,39,40 in addition to analyses of statistical significance. We obtained high quality sequencing data that distinguished between genotypes (Figure 3A). Despite the small numbers of frs/frs erythroid cells (Figure 3B), we could sort them onto slides for morphological and heme staining. Consistent with previous work, they were poorly hemoglobinized and had larger nuclei than WT and heterozygote cells (Figure 3A). Iron-hinokitiol (15 μM) increased frs/frs erythroid mitochondrial Fe2+ to WT levels, increased hemoglobinization, and decreased the cell and nuclear size of frs/frs erythroid cells (Figure 3A; supplemental Figures 2-4). The proportion of GFP+ erythroid cells in frs/frs embryos was significantly decreased compared with WT and heterozygote siblings but was increased by iron (Figure 3B). This decrease in erythroid cell number occurred relatively later in erythroid development. At 1.5 dpf, there was no relative decrease in the frs/frs lcr:GFP+ erythroid population (supplemental Figure 5). Three-dpf frs/frs erythroid cells were significantly larger than WT or frs/+ cells, and their cell size was decreased by iron supplementation (Figure 3C). Benzidine staining indicated significantly decreased frs/+ and frs/frs erythroid hemoglobinization (Figure 3D). The decreased hemoglobinization in frs/+ heterozygotes was not visibly detectable in whole embryos (supplemental Figure 2) but many erythroid cells had benzidine staining intensity below the lower bound of 90% confidence intervals set by WT erythroid cells.39,40 These data highlight the importance of quantitating subtle phenotypes in heterozygote animals. Iron supplementation significantly increased frs/frs erythroid hemoglobinization but not frs/+ erythroid cells, perhaps indicating homeostatic mechanisms that prevent acquisition of excess iron (Figure 3D). frs/frs erythroid cells were much larger than WT controls, and many frs/+ nuclei were larger than the 90% confidence intervals of WT nuclei (Figure 3D), significantly decreasing cytoplasmic-to-nuclear ratio, which was reversible by iron supplementation (Figure 3D-E). Collectively, these data indicate that the frs/frs erythropoietic defects result from defective mitochondrial iron transport.
Sorting, imaging, and genotyping of single 3-dpf zebrafish WT, frs/+, and frs/frs embryos demonstrate feasibility of sorting erythroid cells from single embryos; iron supplementation significantly ameliorates the effects of mfrn1 deficiency. (A) Sorting of GFP+ erythroid cells from single zebrafish embryos onto slides and followed by benzidine and Hoechst, or Giemsa staining. Genomic DNA was extracted from unsorted cells/debris and subjected to PCR with primers flanking the mutation region; the isolated PCR product was sequenced. Heterozygotes had overlapping nucleotide peaks at the mutation site. GFP+ WT cells were benzidine stained, indicating that sorted cells were from the erythroid lineage; iron treatment showed some evidence of toxicity (wrinkled morphology, decreased benzidine staining of individual cells). Both Hoechst and Giemsa staining revealed that frs/frs erythroid cells had very enlarged nuclei. This phenotype was largely reversed by iron supplementation. (B) Both frs/+ and frs/frs mutant embryos had a significantly decreased number of erythroid cells. Erythroid cell proportion in frs/frs were significantly increased by iron treatment. (C) FSC analysis indicates that frs/frs erythroid cells are significantly larger than WT and frs/+. This abnormality was largely reversed by iron supplementation. (D) ImageJ analysis of benzidine stained cells indicated a significant decrease in heme staining in both frs/+ and frs/frs erythroid cells (see supplemental Figure 3). Iron supplementation (15 μM) was required for restoration of hemoglobinization levels to WT. (E) ImageJ analysis of Giemsa-stained cells revealed that frs/+ and frs/frs erythroid cells had enlarged nuclei. These phenotypes could be reversed by iron supplementation. (F) The ratio of cytoplasmic/nuclear area was decreased in frs/+ and frs/frs erythroid cells and these phenotypes could be reversed by iron supplementation though cell shapes qualitatively remained more variable than WT cells (see supplemental Figure 4). ∗∗∗ Indicates >95% significance. FSC-A, forward scatter.
Sorting, imaging, and genotyping of single 3-dpf zebrafish WT, frs/+, and frs/frs embryos demonstrate feasibility of sorting erythroid cells from single embryos; iron supplementation significantly ameliorates the effects of mfrn1 deficiency. (A) Sorting of GFP+ erythroid cells from single zebrafish embryos onto slides and followed by benzidine and Hoechst, or Giemsa staining. Genomic DNA was extracted from unsorted cells/debris and subjected to PCR with primers flanking the mutation region; the isolated PCR product was sequenced. Heterozygotes had overlapping nucleotide peaks at the mutation site. GFP+ WT cells were benzidine stained, indicating that sorted cells were from the erythroid lineage; iron treatment showed some evidence of toxicity (wrinkled morphology, decreased benzidine staining of individual cells). Both Hoechst and Giemsa staining revealed that frs/frs erythroid cells had very enlarged nuclei. This phenotype was largely reversed by iron supplementation. (B) Both frs/+ and frs/frs mutant embryos had a significantly decreased number of erythroid cells. Erythroid cell proportion in frs/frs were significantly increased by iron treatment. (C) FSC analysis indicates that frs/frs erythroid cells are significantly larger than WT and frs/+. This abnormality was largely reversed by iron supplementation. (D) ImageJ analysis of benzidine stained cells indicated a significant decrease in heme staining in both frs/+ and frs/frs erythroid cells (see supplemental Figure 3). Iron supplementation (15 μM) was required for restoration of hemoglobinization levels to WT. (E) ImageJ analysis of Giemsa-stained cells revealed that frs/+ and frs/frs erythroid cells had enlarged nuclei. These phenotypes could be reversed by iron supplementation. (F) The ratio of cytoplasmic/nuclear area was decreased in frs/+ and frs/frs erythroid cells and these phenotypes could be reversed by iron supplementation though cell shapes qualitatively remained more variable than WT cells (see supplemental Figure 4). ∗∗∗ Indicates >95% significance. FSC-A, forward scatter.
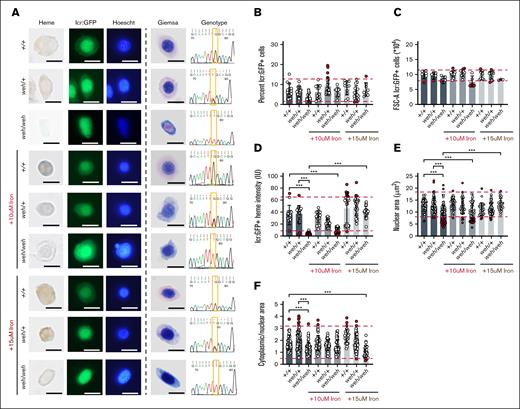
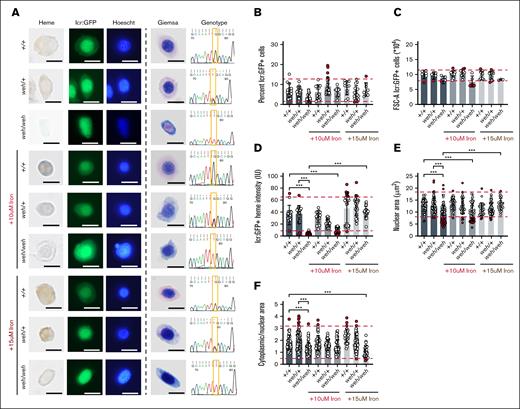
Is this erythropoietic defect specific to MFRN1 loss of function? We investigated erythroid differentiation in weh (fpn1) mutant; Tg (globin lcr:eGFP) zebrafish, which mimic systemic iron deficiency.9,23weh/weh erythroid cells had defective hemoglobinization, but their cell and nuclear sizes were not larger than WT and heterozygote cells (Figure 4A; supplemental Figures 6 and 7). Unlike frs/frs embryos, weh/weh embryos did not have decreased erythroid cell numbers (Figure 4B). weh/weh erythroid cells were similar in size to their WT counterparts (Figure 4C). Supplementation with iron-hinokitiol restored hemoglobinization in weh/weh zebrafish to WT levels (Figure 4D; representative whole-mount embryo supplemental Figure 2B). The nuclear areas of weh/weh erythroid cells were significantly smaller than those of WT cells, reversed by 15 μM Fe-hinokitiol (Figure 4E) although cytoplasmic-to-nuclear ratios were similar across genotypes (Figure 4F).
Sorting, imaging, and genotyping of single 3-dpf zebrafish WT, weh/+, and weh/weh embryos demonstrate feasibility of sorting erythroid cells from single embryos; iron supplementation ameliorates the effects of FPN1 deficiency. (A) Sorting of GFP+ erythroid cells from single zebrafish embryos onto slides and followed by benzidine and Hoechst, or Giemsa staining. Both Hoechst and Giemsa staining revealed that weh/weh erythroid cells were heme deficient and smaller than WT cells. This phenotype was largely reversed by iron supplementation. (B) weh/weh mutant embryos did not have significantly decreased numbers of erythroid cells at 72 hours post fertilization (hpf). (C) Analysis of forward scatter (FSC) confirmed that weh/weh erythroid cells are significantly smaller than WT and weh/+. This abnormality was reversed by iron supplementation. (D) ImageJ analysis of benzidine stained cells indicated a significant decrease in heme staining in weh/weh erythroid cells. Iron supplementation (15 μM) was required for restoration of hemoglobinization levels to WT levels (supplemental Figure 6). (E) ImageJ analysis of Giemsa-stained cells revealed that weh/weh erythroid cells had smaller nuclei than WT, which was corrected by iron supplementation. (F) The ratio of cytoplasmic/nuclear area was decreased in weh/weh erythroid cells and these phenotypes could not be reversed by iron supplementation, and cell morphology remained qualitatively different from WT cells (see supplemental Figure 7). Scale bar, 5 μm. ∗∗∗ Indicates >95% significance by multiple comparisons with Tukey-Kramer correction.
Sorting, imaging, and genotyping of single 3-dpf zebrafish WT, weh/+, and weh/weh embryos demonstrate feasibility of sorting erythroid cells from single embryos; iron supplementation ameliorates the effects of FPN1 deficiency. (A) Sorting of GFP+ erythroid cells from single zebrafish embryos onto slides and followed by benzidine and Hoechst, or Giemsa staining. Both Hoechst and Giemsa staining revealed that weh/weh erythroid cells were heme deficient and smaller than WT cells. This phenotype was largely reversed by iron supplementation. (B) weh/weh mutant embryos did not have significantly decreased numbers of erythroid cells at 72 hours post fertilization (hpf). (C) Analysis of forward scatter (FSC) confirmed that weh/weh erythroid cells are significantly smaller than WT and weh/+. This abnormality was reversed by iron supplementation. (D) ImageJ analysis of benzidine stained cells indicated a significant decrease in heme staining in weh/weh erythroid cells. Iron supplementation (15 μM) was required for restoration of hemoglobinization levels to WT levels (supplemental Figure 6). (E) ImageJ analysis of Giemsa-stained cells revealed that weh/weh erythroid cells had smaller nuclei than WT, which was corrected by iron supplementation. (F) The ratio of cytoplasmic/nuclear area was decreased in weh/weh erythroid cells and these phenotypes could not be reversed by iron supplementation, and cell morphology remained qualitatively different from WT cells (see supplemental Figure 7). Scale bar, 5 μm. ∗∗∗ Indicates >95% significance by multiple comparisons with Tukey-Kramer correction.
Although both frs (mfrn1) and weh (fpn1) mutants exhibited hemoglobinization defects, only frs/frs mutants had decreased erythroid cell numbers. Because erythropoiesis and cell cycle progression are coregulated,41-45 we examined potential roles for mfrn1 and fpn1 in cell cycle regulation. To identify proliferating cells, we incubated 3-dpf embryos in a thymidine analog, EdU, and attached an azide fluorophore in EdU-labeled cells. Cells were stained with DyeCycle Violet for DNA content measurements. Because EdU fluorophore attachment quenched GFP fluorescence, we labeled GFP+ cells with primary antibodies. The DyeCyclelow EdUnegative population was gated as G0/G1, whereas the DyeCyclehighEdunegative population was gated as G2/M. The EdUpositive population was defined as S phase (supplemental Figure 8).
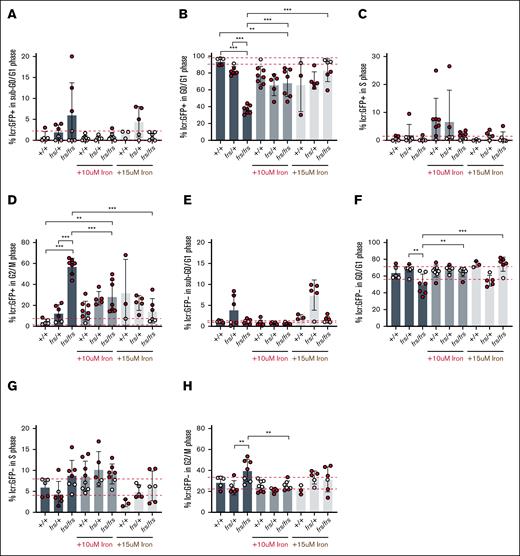
Earlier in development at 1.5 dpf, there was no erythroid cell number defect in frs/frs embryos (supplemental Figure 5); similarly, we did not observe cell cycle defects in the GFP+ erythroid population at this point (supplemental Figure 9). We carried out similar analyses at 3 dpf when there was decreased erythroid cell number. At 3 dpf, the number of GFP+ (erythroid) cells with sub-G0 DNA did not significantly differ between genotypes (Figure 5A). Most 3 dpf WT erythroid cells were in G0/G1, in contrast to erythroid cells earlier in development at 1.5 dpf, which were more proliferative and mostly in S and G2/M phases (supplemental Figures 9 and 12). While there were no statistically significant differences between the proportion of WT and frs/+ erythroid cells in G0/G1, most frs/+ embryos had proportions of G0/G1 erythroid cells below the 90% confidence intervals defined by WT embryos. There were significantly decreased proportions of frs/frs erythroid cells in G0/G1, suggesting an exit from quiescence. This was reversed by iron supplementation (Figure 5B). We did not observe altered proportions of frs/frs mutant erythroid cells in S phase (Figure 5C), but the proportion of frs/+ erythroid cells in G2/M had doubled and most frs/frs erythroid cells were in G2/M suggesting cell cycle arrest (Figure 3). Iron supplementation decreased the proportion of frs/frs erythroid cells in G2/M, suggesting release from cell cycle arrest (Figure 5D), corresponding to increased erythroid cell numbers after iron treatment (Figure 3B).
Iron transport via Mfrn1 is required for erythroid cell cycle progression. (A) Mfrn1 deficiency does not cause increased erythroid cell death. We did not observe a significant difference between WT, frs/+, and frs/frs groups in the numbers of cells with sub-G0 DNA. (B) Most WT erythroid cells were in G0/G1, suggesting they were quiescent. There was a significant decrease in the numbers of frs/+ and frs/frs erythroid cells in G0/G1. Addition of supplemental iron significantly increased the percentage of frs/frs erythroid cells in G0/G1. (C) There were no significant differences between groups in the percentage of erythroid cells in S phase. (D) frs/+ and frs/frs mutants had a significant increase in the percentage of erythroid cells arrested in G2/M. Addition of supplemental iron significantly reduced the percentage of mutant erythroid cells in G2/M arrest. However, even iron supplementation could not reduce the percentage of erythroid cells in G2/M to WT levels. (E) Mfrn1 deficiency did not significantly affect cell death in nonerythroid (GFP−) cells. (F) Mfrn1 deficiency significantly decreased the proportion of nonerythroid cells in G0/G1, suggesting an increase in the number of cells exiting quiescence. Supplemental iron restored the proportion of cells in G0/G1 to WT levels. (G) There were no significant differences between groups in the percentage of erythroid cells in S phase. (H) frs/frs mutants had a significant increase in the percentage of nonerythroid cells arrested in G2/M. Addition of supplemental iron significantly reduced the percentage of frs/frs nonerythroid cells in G2/M arrest to WT levels. ∗∗P < .01; ∗∗∗P < .001; ∗∗ and ∗∗∗ obtained for pairs with 95% significance.
Iron transport via Mfrn1 is required for erythroid cell cycle progression. (A) Mfrn1 deficiency does not cause increased erythroid cell death. We did not observe a significant difference between WT, frs/+, and frs/frs groups in the numbers of cells with sub-G0 DNA. (B) Most WT erythroid cells were in G0/G1, suggesting they were quiescent. There was a significant decrease in the numbers of frs/+ and frs/frs erythroid cells in G0/G1. Addition of supplemental iron significantly increased the percentage of frs/frs erythroid cells in G0/G1. (C) There were no significant differences between groups in the percentage of erythroid cells in S phase. (D) frs/+ and frs/frs mutants had a significant increase in the percentage of erythroid cells arrested in G2/M. Addition of supplemental iron significantly reduced the percentage of mutant erythroid cells in G2/M arrest. However, even iron supplementation could not reduce the percentage of erythroid cells in G2/M to WT levels. (E) Mfrn1 deficiency did not significantly affect cell death in nonerythroid (GFP−) cells. (F) Mfrn1 deficiency significantly decreased the proportion of nonerythroid cells in G0/G1, suggesting an increase in the number of cells exiting quiescence. Supplemental iron restored the proportion of cells in G0/G1 to WT levels. (G) There were no significant differences between groups in the percentage of erythroid cells in S phase. (H) frs/frs mutants had a significant increase in the percentage of nonerythroid cells arrested in G2/M. Addition of supplemental iron significantly reduced the percentage of frs/frs nonerythroid cells in G2/M arrest to WT levels. ∗∗P < .01; ∗∗∗P < .001; ∗∗ and ∗∗∗ obtained for pairs with 95% significance.
Proportions of sub-G0 nonerythroid cells did not differ between genotypes (Figure 5E). frs/frs embryos had decreased numbers of nonerythroid G0/G1 cells that were increased by iron treatment, suggesting that some nonerythroid cells require mfrn1 for iron transport and cell cycle regulation (Figure 5F). They did not experience S phase defects (Figure 5G) but had increased proportions of cells in G2/M, reversed by 10 μM Fe-hinokitiol; 15 μM Fe-hinokitiol increased percentages of G2/M WT and frs/+ cells, suggesting toxicity (Figure 5H).
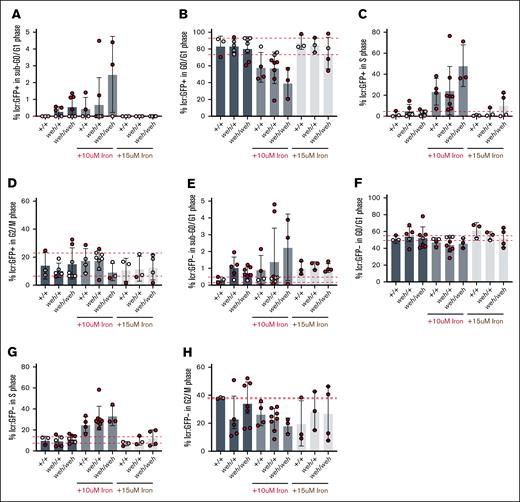
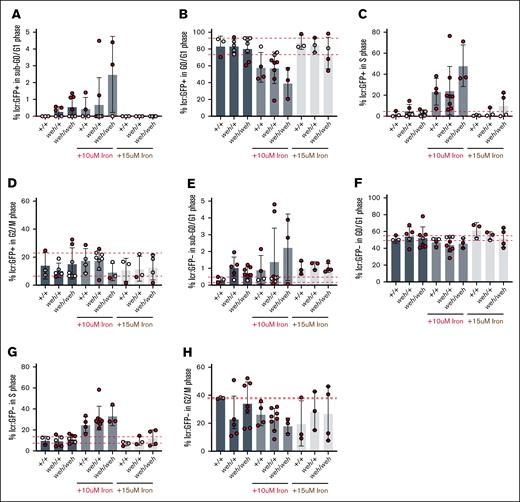
Does cell cycle arrest occur in systemic iron deficiency? We analyzed cell cycle status in GFP+ cells obtained from incrosses of weh/+; Tg (lcr:GFP) zebrafish. The average percentages of erythroid cells in sub-G0 did not differ between genotypes (Figure 6A). In contrast to the frs mutants, weh mutants did not have decreased G0/G1 GFP+ erythroid cells (Figure 6B). Similarly, percentages of erythroid cells in S phase (Figure 6C) and in G2/M (Figure 6D) were similar across genotypes. We also did not observe genotype-dependent differences in percentages of nonerythroid cells with sub-G0 DNA (Figure 6E), in G0/G1 (Figure 6F), S phase (Figure 6I), or G2/M (Figure 6H). These data indicate that frs/frs mutant erythroid cells undergo G2/M arrest, which is ameliorated by supplemental iron, indicating that mitochondrial iron transport via MFRN1 is required for cell cycle progression during erythropoiesis.
Fpn1 is not required for erythroid cell cycle progression although homozygous mutants are deficient in mitochondrial iron (Figure 2). (A) Fpn1 deficiency does not significantly increase erythroid cell death (percentage of cells with sub-G0/G1 DNA), but there are increased numbers of weh/+ and weh/weh embryos with increased numbers of percentage of sub-G0 DNA relative to vehicle-treated WT. Addition of 15 μM iron reduced cell death to WT levels. (B) weh/+ and weh/weh mutants did not differ from the WT group in the number of erythroid cells in G0/G1. This remained consistent with iron supplementation. (C) There were no significant differences between groups in the percentage of erythroid cells in S phase. (D) There were no significant differences between groups in the percentage of erythroid cells in G2/M. (E) Fpn1 deficiency increased cell death in nonerythroid (GFP−) cells. Addition of iron increased cell death in WT cells, so there were no differences in the percentage of nonerythroid cell with sub-G0/G1 between WT and mutant groups. (F) Fpn1 deficiency did not significantly decrease the proportion of nonerythroid cells in G0/G1. (G) There were no significant differences between groups in the percentage of erythroid cells in S phase. (H) There were no significant differences between groups in the percentage of nonerythroid cells in G2/M.
Fpn1 is not required for erythroid cell cycle progression although homozygous mutants are deficient in mitochondrial iron (Figure 2). (A) Fpn1 deficiency does not significantly increase erythroid cell death (percentage of cells with sub-G0/G1 DNA), but there are increased numbers of weh/+ and weh/weh embryos with increased numbers of percentage of sub-G0 DNA relative to vehicle-treated WT. Addition of 15 μM iron reduced cell death to WT levels. (B) weh/+ and weh/weh mutants did not differ from the WT group in the number of erythroid cells in G0/G1. This remained consistent with iron supplementation. (C) There were no significant differences between groups in the percentage of erythroid cells in S phase. (D) There were no significant differences between groups in the percentage of erythroid cells in G2/M. (E) Fpn1 deficiency increased cell death in nonerythroid (GFP−) cells. Addition of iron increased cell death in WT cells, so there were no differences in the percentage of nonerythroid cell with sub-G0/G1 between WT and mutant groups. (F) Fpn1 deficiency did not significantly decrease the proportion of nonerythroid cells in G0/G1. (G) There were no significant differences between groups in the percentage of erythroid cells in S phase. (H) There were no significant differences between groups in the percentage of nonerythroid cells in G2/M.
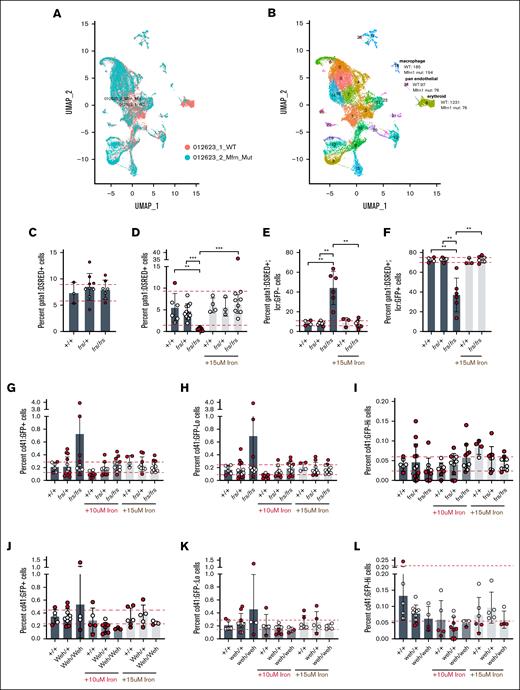
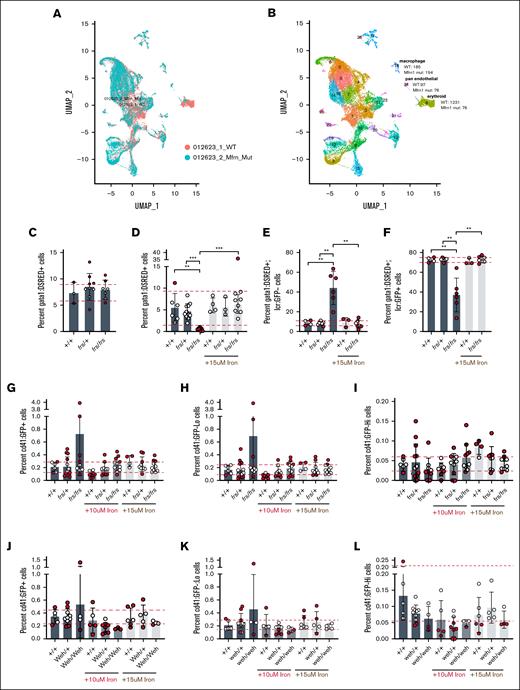
Iron deficiency can decrease erythropoietic commitment in hematopoietic stem cell46 or megakaryocytic-erythroid progenitor47 by preferential expansion of hematopoietic stem cells,46 or biasing megakaryocytic-erythroid progenitors to megakaryopoiesis.47 We asked whether the erythropoietic defect in mfrn1 deficiency7,8 was caused by altered lineage commitment. We conducted scRNA-seq analysis of pooled WT and frs/frs embryos (genotypes in supplemental Figure 10). Single cells obtained from 3-dpf embryos were subjected to a 10× Genomics pipeline. The scRNA-seq data were processed and clustered using Seurat version 4.3.025 at a resolution of 0.8 (Figure 7A) and clusters were annotated by expression of marker genes (Figure 7B; supplemental Figure 11). Defects in mfrn1 deficient embryos were predominantly restricted to the erythroid lineage (cluster 6). frs/frs embryos had a large drop in the number of cells in this cluster, with only 76 erythroid cells sequenced of 10 000 cells (Figure 7A; supplemental Table 1). GFP and globin expression was restricted to cluster 6 (Figure 7B; supplemental Table 2) in which ∼1 of 3 of WT erythroid cells expressed gata1a, an early marker of erythroid differentiation,48-50 whereas over half of the frs/frs erythroid cells expressed gata1a (Figure 7B). Although gata1 is required for erythroid specification and initiation of erythropoiesis, gata1 downregulation is essential for terminal erythropoiesis.49,51 Retention of gata1a expression in frs/frs erythroid cells therefore indicates arrested differentiation.
Mfrn1 is primarily required for erythroid cell maturation; neither mfrn1 (frs) nor fpn1 (weh) mutants have significant increases in the thrombocytic lineage that indicate lineage shifts in the MEP population. (A-B) scRNA-seq analysis indicates that the primary phenotype of mfrn1 deficiency is in formation of the mature erythroid lineage, which is gata1a−/globin+. There is also a significant defect in the development of gata1a+ erythroid cells in frs/frs mutants. (C) frs/frs mutants had normal proportions of gata1a+ cells at 24 hpf, indicating normal formation of erythroid precursors. (D) Vehicle-treated frs/frs mutants had a significant decrease in the proportion of gata1a+ cells at 72 hpf that was rescued to WT levels with 15 μM Fe-hinokitiol. (E-F) frs/frs mutant embryos have a significantly higher proportion of gata1a+:lcr-−cells and lower proportion of gata1a+:lcr+ cells at 72 hpf that is rescued to WT levels with 15 μM Fe-hinokitiol. (G) At 96 hpf, there was no significant difference in the proportion of CD41+ cells between vehicle-treated WT, frs/+, or frs/frs embryos. (H) frs and frs/frs mutants did not experience alterations in the development of cd41low cells, indicating that development of the adult hematopoietic stem cell population was unaltered. (I) frs and frs/frs mutants did not experience alterations in the development of CD41high cells, indicating that development of the thrombocyte population was unaltered. (J) At 96 hpf, FPN1 mutation status or iron treatment did not alter percentages of total CD41+ cells. (K) fpn1 mutants did not experience alterations in the development of CD41low cells, indicating that development of the adult hematopoietic stem cell population was unaltered. (L) fpn1 mutants did not experience alterations in the development of CD41high cells, indicating that development of the thrombocyte population was unaltered. ∗∗P < .01; ∗∗∗P < .001. mut, mutant; UMAP, uniform manifold approximation and projection.
Mfrn1 is primarily required for erythroid cell maturation; neither mfrn1 (frs) nor fpn1 (weh) mutants have significant increases in the thrombocytic lineage that indicate lineage shifts in the MEP population. (A-B) scRNA-seq analysis indicates that the primary phenotype of mfrn1 deficiency is in formation of the mature erythroid lineage, which is gata1a−/globin+. There is also a significant defect in the development of gata1a+ erythroid cells in frs/frs mutants. (C) frs/frs mutants had normal proportions of gata1a+ cells at 24 hpf, indicating normal formation of erythroid precursors. (D) Vehicle-treated frs/frs mutants had a significant decrease in the proportion of gata1a+ cells at 72 hpf that was rescued to WT levels with 15 μM Fe-hinokitiol. (E-F) frs/frs mutant embryos have a significantly higher proportion of gata1a+:lcr-−cells and lower proportion of gata1a+:lcr+ cells at 72 hpf that is rescued to WT levels with 15 μM Fe-hinokitiol. (G) At 96 hpf, there was no significant difference in the proportion of CD41+ cells between vehicle-treated WT, frs/+, or frs/frs embryos. (H) frs and frs/frs mutants did not experience alterations in the development of cd41low cells, indicating that development of the adult hematopoietic stem cell population was unaltered. (I) frs and frs/frs mutants did not experience alterations in the development of CD41high cells, indicating that development of the thrombocyte population was unaltered. (J) At 96 hpf, FPN1 mutation status or iron treatment did not alter percentages of total CD41+ cells. (K) fpn1 mutants did not experience alterations in the development of CD41low cells, indicating that development of the adult hematopoietic stem cell population was unaltered. (L) fpn1 mutants did not experience alterations in the development of CD41high cells, indicating that development of the thrombocyte population was unaltered. ∗∗P < .01; ∗∗∗P < .001. mut, mutant; UMAP, uniform manifold approximation and projection.
To determine whether frs/frs mutants had defective erythropoietic commitment, we crossed frs mutants with Tg(gata1:dsRed)52 zebrafish and quantitated dsRed fluorescent cells at 1 dpf, when gata1 is largely expressed by erythroid progenitors.53 We found no significant differences in numbers of dsRed+ cells between genotypes, suggesting that mfrn1 is not required for erythroid specification (Figure 7C), consistent with mfrn1 being a downstream target of gata1 transcription.54 To determine whether mfrn1 deficiency favored proliferation of gata1+ progenitors at the expense of terminal erythropoiesis, we crossed frs mutants with Tg(gata1:dsRed) and Tg(lcr:GFP) fish. At 3 dpf, frs/frs embryos had significantly decreased percentages of gata1-expressing cells compared with WT and frs/+ embryos (Figure 7D). These data suggest that frs/frs gata1a+ erythroid progenitors did not undergo compensatory expansion at the expense of terminal erythropoiesis. This decrease was reversed by iron supplementation (Figure 7D). Most 3-dpf WT and frs/+ gata1-expressing cells were lcr:GFP+, indicating that gata1 is primarily expressed in committed erythroid cells. In contrast, >40% of frs/frs gata1+ cells were lcr:GFP−, indicating developmental arrest at a progenitor stage. This developmental block was released by iron supplementation (Figure 7E-F). These data are consistent with the requirement for gata1 for globin gene transcription and indicate the importance of mfrn1 for maintenance or expansion of gata1+ erythroid progenitors. The proliferative phenotypes in erythroid progenitors occurred during terminal differentiation at ∼3 dpf; 2-dpf lcr:GFP+/gata1:dsRed+ and gata1:dsRed+ erythroid progenitors did not have cell cycle defects (supplemental Figure 12).
Lastly, we asked whether iron deficiency increased thrombocytosis, akin to megakaryocytic bias in iron-deficient mice.47 We crossed frs or weh mutants with Tg(cd41:GFP) zebrafish.55 CD41 is expressed in early hematopoietic progenitors and thrombocytes. Four-dpf Tg(cd41:GFP) embryos have GFP+ hematopoietic cells corresponding to hematopoietic progenitor (GFPlow) or thrombocyte (GFPhigh) populations.55 There were no differences in WT vs frs mutants in overall cd41:GFP+ (Figure 7G), GFPlow (Figure 7H), or GFPhigh (Figure 7I) proportions; these percentages were unaltered by iron treatment (gating strategy in supplemental Figure 13). Similarly, proportions of cd41-expressing cells were unaltered in weh mutants (Figure 7J-L). These data indicate the absence of thrombocytic bias in frs/frs mutants. More broadly, they suggest that hematopoietic lineage fate regulation by iron is not conserved between vertebrate species, or that iron is important for adult hematopoietic fate decisions46,47 rather than in embryonic hematopoiesis, the context of this study.
Earlier studies with murine erythroleukemia cell lines recapitulated the hemoglobinization and mitochondrial heme defect in Mfrn1 loss of function, but because these cells have severe defects in cell cycle regulation, we could not recapitulate our zebrafish studies with these cells.18 Here, we used HUDEP2 (human umbilical cord-derived progenitor erythroid 2) cells, a human cell line that proliferates during differentiation but enters quiescence after terminal differentiation.56MFRN1−/− HUDEP2 cells did not have cell cycle defects before induction differentiation, similar to our observations in the zebrafish (supplemental Figure 14). Upon erythropoietic induction, MFRN1−/− cells died, making it impossible to collect cell cycle data. It is possible that apoptosis occurred downstream of proliferative arrest. These observations recapitulate our findings, and previously published data in other tissues, that iron transport via MFRN proteins is essential for cell cycle regulation in actively proliferating primary cells.57
Discussion
Despite the centrality of iron metabolism in erythropoiesis, its regulatory mechanisms remain unclear. Critically, we showed in vivo that mitochondrial iron import by MFRN1 is critical for G2/M progression during terminal erythropoiesis (Figure 7M; supplemental Figure 15). In contrast, we did not observe cell cycle defects in weh/weh (fpn1-deficient) erythroid cells. Iron and its cofactors are key components of many cell cycle regulators, including DNA polymerases, primases,32-34,58 and ribonucleotide reductase.59 Heme and Fe-S clusters are synthesized in the mitochondria, a key link between mitochondrial iron and cell cycle (supplemental Figure 15). In addition to erythroid cells,42,45,60 many cell types undergo cell cycle arrest during iron dysregulation.61-64 Iron deficiency causes arrests cultured cells at the G1/S transition via upregulation of CDK inhibitors p21 and p27 or increased proteosomal degradation of cyclin D1,61,63,64 but direct links between iron deficiency and cyclin D1 or p21/p27 regulation are unknown. We speculate that this phenotype was not observed in zebrafish because local iron concentrations in the erythropoietic niche were higher than in cell culture studies, which used iron chelators.
Mfrn1 deficiency causes embryonic lethality from anemia, and hematopoietic-specific Mfrn1 ablation drastically increased erythroid progenitors, with concomitant 50% decrease in erythrocytes.7 These data are consistent with our observation that gata1-expressing progenitors are overrepresented in the frs/frs erythroid compartment. Deletion of Mfrn1 and Mfrn2 caused proliferative defects in hepatocytes, decreasing the regenerative capacity of livers subjected to partial hepatectomy.57 These data underscore the physiological importance of mitochondrial iron transport in cell cycle regulation. However, given the links between iron deficiency and G1/S arrest, and the importance of iron in ribonucleotide reductase, the rate limiting enzyme of the S phase, the G2/M arrest in frs/frs (mfrn1) erythroid cells was surprising.
How might mitochondrial iron regulate mitosis? Figure 3 indicates that frs/frs erythroid cells have enlarged nuclei, consistent with G2/M arrest (Figure 5). We did not observe any binucleate cells, suggesting that the defect occurs before telophase. Several cytoskeletal genes related to mitosis were upregulated in frs/frs erythroid cells, including ferritin heavy chain–like genes, required for maintenance of the erythroid microtubule cytoskeleton62; npm1, a nucleophosmin involved in centrosome duplication and cell proliferation65,66; and actin (supplemental Table 3). Our data predict that mitochondrial iron regulates cytoskeletal processes essential for mitosis; clinically, mitochondrial iron deficiency may cause macrocytic phenotypes in erythroid cells.
Importantly, we developed techniques enabling data collection from small numbers of cells. Underscoring our technical accomplishment, only 76 erythroid frs/frs erythroid cells were sequenced from 10 000 cells loaded for 10× Genomics analysis. Our work significantly increases the experimental rigor of zebrafish experiments, enabling us to distinguish between individual WT and heterozygote animals, enabling quantitation of population variability within genotypes. The external development of zebrafish embryos allows us to assay cell cycle, mitochondrial levels, and carry out iron supplementation, currently intractable in mammalian organisms. Hence, these methods significantly add to our ability to study development in vivo.
Our results revealed key differences in zebrafish and mammalian erythropoiesis. Primitive mammalian erythroblasts actively proliferate after lineage commitment.67 During development, globins, heme synthesis, and iron metabolism genes are transcriptionally upregulated. Concomitantly, morphological changes such as nuclear condensation occur.32-34,58 Although most of these changes are observed in definitive erythroblasts, they also occur in proliferating primitive erythroblasts.68 In contrast, our studies show that zebrafish erythroid cells contain high levels of hemoglobin at in early erythropoiesis. Their nuclear size is relatively constant during terminal erythropoiesis (Figure 1). mfrn1 mutant erythroid cells have enlarged nuclei, indicating that nuclear condensation is part of the zebrafish erythropoiesis, but suggests that nuclear condensation occurs earlier in zebrafish erythropoietic differentiation.28,32-34
Iron deficiency contributes to many diseases whose pathophysiology is poorly understood. Conceptually, we reveal the importance of mitochondrial iron transport in cytosolic and nuclear processes including cell cycle regulation and maintenance of erythroid morphology. Unraveling the complexities of intracellular iron trafficking is key to understanding the pathophysiology of iron deficiency and therapeutic mechanisms of iron supplementation.
Acknowledgments
The authors thank members of the Yien and Tejero laboratories for discussion and feedback. The authors especially thank Hugh Hammer (University of Pittsburgh) and his team, and Gwen Talham (University of Delaware) for assistance with zebrafish husbandry, and the late Richard West (University of Delaware) for extensive technical assistance in developing the flow cytometry techniques in this work. The authors thank Dewayne Falkner, Ailing Liu, and Nan Sheng at the University of Pittsburgh Flow Core for technical assistance. The authors thank the University of Pittsburgh Medical Center (UPMC) Children’s Hospital Genomics and Pitt Single Cell cores for assistance with single-cell RNA sequencing (scRNA-seq). The authors are grateful to Robert Lafyatis and Delphine Gomez for help with scRNA-seq experimental design. The authors thank Enrico Novelli and Samit Ghosh at the University of Pittsburgh for their intellectual engagement and feedback during the project, and Diane Ward and Jerry Kaplan (University of Utah) for critical comments on the manuscript. Schematics and the visual abstract were created with Biorender.com (2025).
This work was supported by the Cooley's Anemia Foundation (Y.Y.Y.) and the National Institutes of Health grants R03 DK118307, P01 HL032262, R35 GM1133560, and R01 DK137107 (Y.Y.Y.), R35 GM137976 (A.N.S.), and T32 (M.P.; Principal Investigator: Novelli, T32 HL0535120).
Authorship
Contribution: M.P., A.D., M.I., A.M., H.M., M.C., and Y.Y.Y. designed the research; M.P., A.D., M.I., A.M., H.M., M.C., and S.O. performed the research; H.M. and S.O. contributed analytical tools; M.P., A.D., M.I., A.M., H.M., and M.C. collected the data; M.P., M.I., J.T., S.O., A.N.S., and Y.Y.Y. analyzed and interpreted the data; M.P., S.O., and Y.Y.Y. performed statistical analysis; and A.N.S. and Y.Y.Y. wrote the manuscript.
Conflict-of-interest disclosure: The authors declare no competing financial interests.
Correspondence: Yvette Y. Yien, University of Pittsburgh, Division of Classical Hematology, 200 Lothrop St, Pittsburgh, PA 15261; email: yieny@pitt.edu.
References
Author notes
Single-cell RNA sequencing data have been deposited in the Gene Expression Omnibus database (accession number GSE277034).
Original data are available on request from the corresponding author, Yvette Y. Yien (yieny@pitt.edu).
The full-text version of this article contains a data supplement.

