Key Points
A man with cytopenias, dysplasia, excess blasts, P53 and RUNX1 mutations, and ring chromosome 7 recovered after stopping lenalidomide.
Introduction
Bone marrow abnormalities due to medication may be classified as early, predictable, and dose dependent (as in antimetabolite or DNA-damaging antineoplastic chemotherapy), idiosyncratic (eg, chloramphenicol), or delayed, sometimes resulting from selective outgrowth of stem cell clones with mutations. The last of these, termed therapy-related myeloid neoplasms (t-MNs), generally resemble de novo myelodysplastic syndromes (MDS) clinically and genetically with skewing toward high-risk types, or they show KMT2A gene translocation in association with prior etoposide treatment. In class-to-class comparisons, t-MNs are worse than de novo types.1 Less frequently, acute myeloid leukemias (AMLs) with favorable core binding factor translocations or acute promyelocytic leukemia with t(15;17) PML/RARA are identified, and these fare similarly to de novo cases.1 Here we present a case in which treatment with lenalidomide over a period of 4 years led to emergence of a dominant, altered hematopoietic stem cell clone with a resulting phenotype of MDS. With discontinuation of the drug, there was complete hematological and karyotypic normalization. We propose the term “therapy-dependent MDS” as a moniker for this effect. This case exposes an instance where there is an inherent competitive advantage of normal hematopoietic stem cells over a mutant clone.
Case description
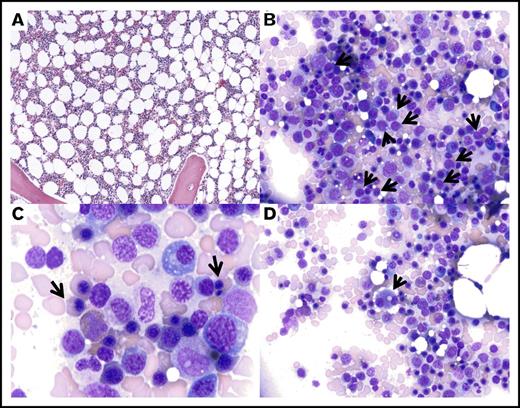
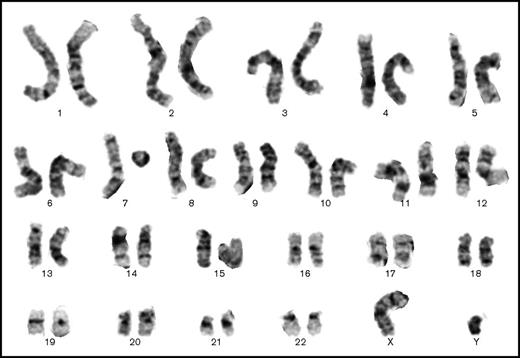
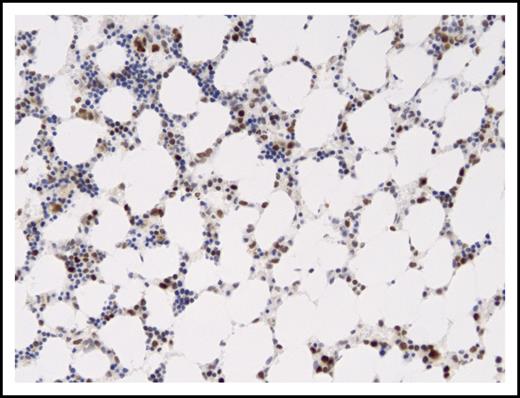
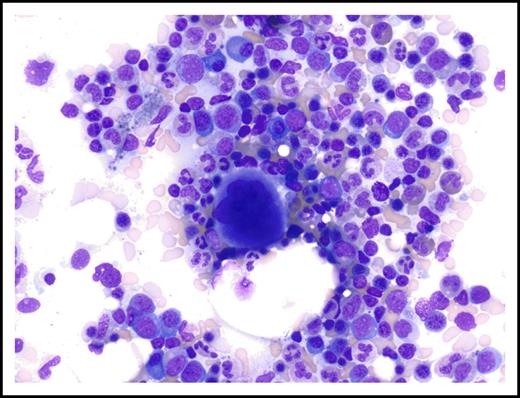
A 52-year-old man with a 19-year history of cadaveric renal transplantation for autosomal dominant polycystic kidney disease was found to have elevation of serum immunoglobulin G concentration to 2.6 g/dL because of an immunoglobulin G λ paraprotein identified on immunoelectrophoresis, with a background normal polyclonal immunoglobulin pattern. A bone marrow biopsy on April 7, 2009 revealed plasmacytosis, 11.5% of the enumerated cells in the aspirate, and 15% of the cells in the biopsy on CD138 immunostain. Although the plasma cells did not have morphological features of malignancy, they formed small clusters, and an elevated fraction stained for λ on in situ hybridization stains. Based on rapidly worsening renal function and increasing serum λ light chains, the patient was treated with 6 cycles of bortezomib and dexamethasone, with disappearance of the paraprotein within 3 months. In November 2009, he was started on lenalidomide 15 mg once daily × 21/28 days. The patient resumed hemodialysis in early March 2010, and therefore, his dose of lenalidomide was reduced to 5 mg daily × 21/28 days. A bone marrow biopsy in October 2012 revealed no convincing evidence of plasma cell dyscrasia, and therefore, dexamethasone was discontinued. He was maintained on lenalidomide until September 2013, at which time routine blood studies showed worsening moderate macrocytic anemia and thrombocytopenia (Table 1). Bone marrow examination showed normocellular marrow with mild dyserythropoiesis, including megaloblastoid changes, binucleation and nuclear budding, dysplastic megakaryocytes, and mildly increased blasts (Figure 1). There was no evident plasma cell neoplasm. The karyotype was reported as “46,XY,?r(7)[17]/46,XY[3],” indicating a probable ring chromosome 7 in 17 out of 20 cells counted (Figure 2). A diagnosis of MDS, RAEB-1, possibly therapy related, was rendered. Retrospective targeted genomic analysis of DNA extracted from cells on the Wright-Giemsa–stained marrow aspirate slide as well as from paraffin-embedded aspirate clot material was performed, and similar results were obtained from both samples: a missense mutation in the DNA binding domain of TP53 and a frameshift mutation in RUNX1 (Table 2). No mutations were found in mutational hot spots for ABL1, ASXL1, BCOR, BCORL1, BRAF, CALR, CBL, CDKN2A, CSF3R, DNMT3A, ETV6, EZH2, FBXW7, FLT3, GATA2, HRAS, IDH1, IDH2, JAK2, KIT, KRAS, MPL, MYD88, NPM1, NRAS, PHF6, PTEN, PTPN11, SETBP1, SF3B1, SRSF2, TET2, U2AF1, WT1, or ZRSR2. Immunostain of the marrow biopsy confirmed abnormal accumulation of P53 protein, with moderate to strong staining of ∼40% of the marrow cells (Figure 3). Fluorescence in situ hybridization analysis of the paraffin-embedded aspirate clot section did not detect any loss of P53 locus copy number. Lenalidomide was discontinued, and 3 months later, the hemoglobin had returned to normal (Table 3). After an additional 2 months, the MCV had also normalized, and the patient had only mild thrombocytopenia (Figure 4). Additional marrow studies at that time were not considered to be clinically warranted. Follow-up marrow studies were performed 3 years later (September 2016), however, in order to meet approval criteria for another renal transplant. At that time, blood counts were in the normal range except for a hemoglobin concentration of 12.9 g/dL and platelet count of 139 × 103/μL. The marrow showed normal morphology (Figure 5) and a normal karyotype. There was no evidence of recurrent plasma cell neoplasm by morphology, immunoglobulin light chain stains, or serology. In addition, immunostaining for P53 did not show a significant increase in reactivity (Figure 4).
Complete blood counts and automated differential (Sysmex 2100XE) with laboratory reference ranges, in chronological order, 4 years after continuous treatment with lenalidomide
| . | Reference range . | 3/29/2013 . | 8/5/2013 . | 9/9/2013 . | 9/11/2013 . |
|---|---|---|---|---|---|
| White blood cells, × 109/L | 4.00-10.00 | 6.17 | 3.16 (L) | 3.13 (L) | 3.21 (L) |
| Red blood cells, × 1012/L | 4.50-5.90 | 3.39 (L) | 2.74 (L) | 2.76 (L) | 2.64 (L) |
| Hemoglobin, g/dL | 13.5-17.5 | 11.9 (L) | 9.4 (L) | 9.1 (L) | 8.8 (L) |
| Hematocrit, % | 42.0-54.0 | 36.9 (L) | 28.6 (L) | 30.0 (L) | 28.6 (L) |
| MCV, fL | 82.0-103.0 | 108.8 (H) | 104.4 (H) | 108.7 (H) | 108.3 (H) |
| MCH, pg | 26.0-34.0 | 35.1 (H) | 34.3 (H) | 33 | 33.3 |
| MCHC, g/dL | 30.0-37.0 | 32.2 | 32.9 | 30.3 | 30.8 |
| RDW, % | 11.5-14.5 | 15.5 (H) | 14.6 (H) | 16.5 (H) | 16.2 (H) |
| Platelets, × 109/L | 150-399 | 135 (L) | 75 (L) | 61 (L) | 51 (L) |
| Neutrophils, × 109/L | 1.84-7.80 | 3.23 | 0.82 (L) | 1.00 (L) | 1.28 (L) |
| Immature granulocytes, × 109/L | 0.00-0.15 | 0.01 | 0.01 | 0.01 | 0.01 |
| Lymphocytes, × 109/L | 0.72-5.20 | 1.99 | 1.81 | 1.61 | 1.27 |
| Monocytes, × 109/L | 0.12-1.00 | 0.58 | 0.42 | 0.49 | 0.56 |
| Eosinophils, × 109/L | 0.00-0.60 | 0.33 | 0.09 | 0.02 | 0.08 |
| Basophils, × 109/L | 0.00-0.30 | 0.03 | 0.01 | 0 | 0.01 |
Dates are given in month/day/year format.
H, high; L, low; MCH, mean corpuscular hemoglobin; MCHC, mean corpuscular hemoglobin concentration; MCV, mean cell volume; RDW, red blood cell distribution width.
Dysplastic marrow morphology following lenalidomide therapy. Representative images of the bone marrow aspirate from September 2013, showing mildly decreased cellularity for age (A; magnification ×60, hematoxylin and eosin stain) with relative erythroid hyperplasia, slightly increased frequency of blasts (B, arrows; magnification ×240, Wright-Giemsa stain), nuclear abnormalities in the erythroid precursors (C, arrows; magnification ×600, Wright-Giemsa stain), and dysplastic small megakaryocytes with binucleation and separated nuclei (D, arrow; magnification ×240, Wright-Giemsa stain).
Dysplastic marrow morphology following lenalidomide therapy. Representative images of the bone marrow aspirate from September 2013, showing mildly decreased cellularity for age (A; magnification ×60, hematoxylin and eosin stain) with relative erythroid hyperplasia, slightly increased frequency of blasts (B, arrows; magnification ×240, Wright-Giemsa stain), nuclear abnormalities in the erythroid precursors (C, arrows; magnification ×600, Wright-Giemsa stain), and dysplastic small megakaryocytes with binucleation and separated nuclei (D, arrow; magnification ×240, Wright-Giemsa stain).
Contemporaneous marrow karyotype showing 1 normal chromosome 7 and 1 probable ring chromosome 7. The other chromosomes have a normal banding pattern (Giemsa stain, 48-hour culture).
Contemporaneous marrow karyotype showing 1 normal chromosome 7 and 1 probable ring chromosome 7. The other chromosomes have a normal banding pattern (Giemsa stain, 48-hour culture).
Summary of targeted hot spot mutation sequencing of marrow aspirate material preserved on a Wright-Giemsa–stained slide or as a formalin-fixed, paraffin-embedded (FFPE) block (performed at BioReference Laboratories, Elmwood Park, NJ)
| Gene . | Alteration . | Variant category . | Coverage . | Allele frequency . | Complementary DNA change . | Marrow aspirate material . |
|---|---|---|---|---|---|---|
| TP53 | p.Tyr234Cys | Disease associated | 5 867 | 37.84 | c.701A>G | Slide |
| RUNX1 | p.? | Disease associated | 1 299 | 41.65 | c.508+2T>C | Slide |
| TP53 | p.Tyr234Cys | Disease associated | 13 361 | 40.66 | c.701A>G | FFPE block |
| RUNX1 | p.? | Disease associated | 593 | 37.27 | c.508+2T>C | FFPE block |
Moderate to strong P53 expression in cells of marrow sample with P53 mutation. P53 immunostained section of marrow from September 2013 (Leica Bond III automated stainer with manufacturer’s antibody). Magnification ×150; immunostain with diaminobenzidine chromogen and hematoxylin counterstain.
Moderate to strong P53 expression in cells of marrow sample with P53 mutation. P53 immunostained section of marrow from September 2013 (Leica Bond III automated stainer with manufacturer’s antibody). Magnification ×150; immunostain with diaminobenzidine chromogen and hematoxylin counterstain.
Follow-up blood counts, in chronological order, after discontinuation of treatment with lenalidomide
| . | 10/7/2013 . | 11/4/2013 . | 12/23/2013 . | 1/20/2014 . | 2/17/2014 . | 9/12/2016 . |
|---|---|---|---|---|---|---|
| White blood cells, × 109/L | 3.42 (L) | 4.32 | 9.22 | 7.67 | 8.05 | 7.95 |
| Red blood cells, × 1012/L | 2.65 (L) | 2.72 (L) | 4.40 (L) | 4.58 | 4.60 | 4.30 |
| Hemoglobin, g/dL | 9.1 (L) | 9.9 (L) | 15.0 | 15.1 | 14.5 | 12.9 |
| Hematocrit, % | 28.8 (L) | 31.1 (L) | 47.5 | 47.3 | 45.9 | 40.7 |
| MCV, fL | 108.7 (H) | 114.3 (H) | 108.0 (H) | 103.3 (H) | 99.8 | 92.9 |
| MCH, pg | 34.3 (H) | 36.4 (H) | 34.1 (H) | 33.0 | 31.5 | 29.5 |
| MCHC, g/dL | 31.6 | 31.8 | 31.6 | 31.9 | 31.6 | 31.7 |
| RDW, % | 16.9 (H) | 19.3 (H) | 13.7 | 13.2 | 13.3 | 14.8 |
| Platelets, × 109/L | 119 (L) | 181 | 137 (L) | 136 (L) | 126 (L) | 139 |
| Neutrophils, × 109/L | 1.78 (L) | 2.47 | 6.53 | 4.96 | 5.05 | 5.34 |
| Immature granulocytes, × 109/L | 0.01 | 0.02 | 0.02 | 0.02 | 0.02 | 0.02 |
| Lymphocytes, × 109/L | 1.28 | 1.59 | 1.89 | 1.97 | 2.21 | 1.79 |
| Monocytes, × 109/L | 0.35 | 0.20 | 0.67 | 0.54 | 0.63 | 0.56 |
| Eosinophils, × 109/L | 0.00 | 0.03 | 0.09 | 0.15 | 0.11 | 0.21 |
| Basophils, × 109/L | 0.00 | 0.01 | 0.02 | 0.03 | 0.03 | 0.03 |
Dates are given in month/day/year format. The last column is at the time of the repeat bone marrow biopsy.
Normal appearance of marrow aspirate on follow-up examination 3 years after discontinuation of treatment with lenalidomide (September 2016). Magnification ×310; Wright-Giemsa stain.
Normal appearance of marrow aspirate on follow-up examination 3 years after discontinuation of treatment with lenalidomide (September 2016). Magnification ×310; Wright-Giemsa stain.
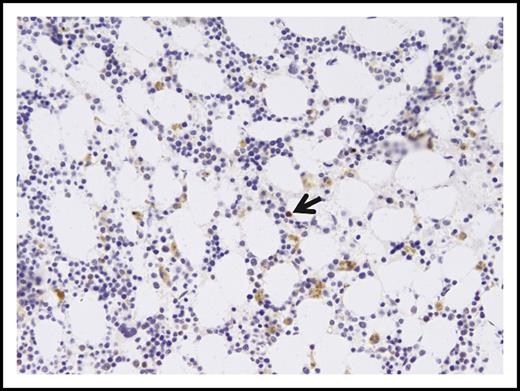
P53 immunostaining of marrow from September 2016. The extracellular brown pigment is hemosiderin. Rare nuclei showed moderate intensity staining (arrow). Magnification ×140; immunostain with diaminobenzidine chromogen and hematoxylin counterstain.
P53 immunostaining of marrow from September 2016. The extracellular brown pigment is hemosiderin. Rare nuclei showed moderate intensity staining (arrow). Magnification ×140; immunostain with diaminobenzidine chromogen and hematoxylin counterstain.
Discussion
We present here an unusual case of lenalidomide-dependent MDS. The relatively indolent nature of the patient’s underlying disease and his relatively good health compared with most patients treated with this drug presented a rare opportunity for long-term exposure, promoting the development of an unexpected and previously unreported phenomenon.
There are several pathogenic mechanisms for t-MNs. In the most conceptually obvious route, a DNA-damaging agent creates or activates an oncogene in a founder cell of a leukemic clone. This route is likely in the case of etoposide, which causes AML with KMT2A gene fusions involving various partners. The translocation breakpoint occurs primarily in KMT2A intron 8 within a 10-nucleotide sequence encompassing a 4-nucleotide overhang created by topoisomerase 2, and formation of this lesion is facilitated by addition of topoisomerase 2 inhibitors in in vitro assays.2 However, most cases of t-MNs are genetically similar to high-grade MDS, and a more complex route of transformation has been posited that stresses that relative competitive advantage of the mutant clone over normal stem cells. As such, P53 mutations are overrepresented in t-MN and in high-grade MDS and AML with myelodysplasia-related changes compared with de novo MDS and AML. In a landmark analysis of t-MN genomes, Wong et al noted that overall genomic mutation frequency was not higher in therapy-related AML compared with de novo AML, and retrospective analysis of material obtained prior to cytotoxic treatment revealed the presence of clones with the same mutations in P53 as in the AMLs that later evolved in those patients.3 These findings led them to conclude that “cytotoxic therapy does not directly induce TP53 mutations. Rather, they support a model in which rare HSPCs carrying age-related TP53 mutations are resistant to chemotherapy and expand preferentially after treatment.”3
We found a P53 gene mutation that was likely heterozygous without alteration of the other allele, based on fraction of mutant reads and on lack of copy number loss of the P53 locus. The P53 gene mutation was mirrored by increased detection of P53 protein by immunostaining. The transience of the cytopenias, dysplastic changes, increased blasts, abnormal karyotype, and P53 expression all support the conclusion that the dominance of the dysplastic clone was dependent on an ongoing drug effect in our case. This regressing dysplastic clone starkly contrasts with the permanent and progressive nature of typical t-MNs. However, they may be mechanistically similar in that it is possible that the mutation in P53 seen in our case favored resistance to a toxic effect of lenalidomide. Myelosuppression was recognized with increased frequency as a significant adverse event in the phase 2 trial of lenalidomide for myeloma4 and confirmed in subsequent metaanalysis.5 Toxicity was especially frequent at higher doses in the setting of renal failure.6 However, unlike alkylating chemotherapy, lenalidomide does not damage DNA, but rather acts through other mechanisms, including by changing protein levels by causing targeted degradation of transcription factors IKZF1 and IKZF3 by direct interaction7-9 or through an oxidation-dependent mechanism.10 Therefore, it is reasonable to conclude that the off-target effect of lenalidomide on marrow stem cells is transient. In the usual t-MN, the proliferative capacity of the neoplastic clone(s) overpowers the normal residual stem cells, leading to marrow failure. In our case, the derepressed normal stem cells outcompeted the mutant cells after removal of the myelosuppressive agent. The phenomenon of regression of dysplastic clones has been noted in other contexts, such as after autologous bone marrow transplantation.11,12 Our case begs the question of whether the renewed proliferative advantage of the normal stem cells over the mutant clone reflects only a relief from the myelosuppressive effect of lenalidomide on the normal marrow. It is also conceivable that lenalidomide was a necessary stimulus for growth of the dysplastic clone, by causing transcriptional changes that synergized with mutations in altered signaling pathways. For example, we note that Narla et al reported upregulation of both JAK2 and FLT3 by lenalidomide in vitro.13 However, we did not identify mutations in either of these genes in the myelodysplastic marrow sample. It is heartening to imagine that there may be unexplored fail-safe mechanisms that confer advantages to the dominance of normal marrow clones.
Authorship
Contribution: I.J.M. wrote the manuscript and prepared the figures and tables except for Figure 2; W.-T.H. provided Figure 2 and expertise on cytogenetics interpretation; P.V. provided additional clinical information and insight and critical review of the manuscript; and J.W. provided targeted genomic sequencing and fluorescence in situ hybridization analysis.
Conflict-of-interest disclosure: The authors declare no competing financial interests.
Correspondence: Ira J. Miller, Department of Pathology, Rush University Medical Center, 1653 West Congress Pkwy, Chicago, IL 60612-3833; e-mail: ira_miller@rush.edu.

