Key Points
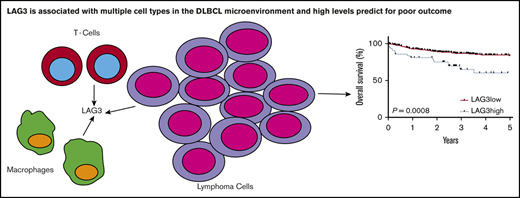
LAG3 is commonly found on malignant B cells in DLBCL, which may have implications for current clinical studies using anti-LAG3 compounds.
LAG3 is found at high levels on CD8 T cells and CD4 Tregs, with almost universal coexpression of PD-1 and TIM3.
Abstract
Blockade of the PD-1 axis has modest efficacy in diffuse large B-cell lymphoma (DLBCL), but data regarding LAG3 are sparse. The impact of LAG3 digital gene expression was tested in 309 patients with DLBCL treated with standard chemoimmunotherapy. Cellular distribution of LAG3 protein was determined by immunohistochemistry and flow cytometry. In tumor-infiltrating lymphocytes (TILs), LAG3 expression was highest on CD4+ regulatory T cells (Tregs) and was also highly expressed on CD8+ T cells compared with CD4+ non-Tregs (both P = .008). LAG3high TILs were enriched in PD-1 and TIM-3. LAG3 was also expressed on a proportion of malignant B cells, and these patients had significantly higher LAG3 messenger RNA in their biopsies (P = .03). LAG3high gene expression was associated with inferior survival in discovery/validation cohorts, independent of cell of origin and the international prognostic index. Patients who were PD-L1high were fivefold more likely to be LAG3high (P < .0001). Patients who were LAG3high/PD-L1high had an inferior progression-free survival (P = .011) and overall survival (P = .005) compared with patients who were LAG3low/PD-L1high. Digital spatial protein analysis confirms LAG3 expression on T cells and, surprisingly, tumor-associated macrophages (TAMs) at higher levels than found on CD20+ B cells in the tumor microenvironment. LAG3 is frequently expressed on CD4+ Tregs and CD8+ TILs, typically with other immune checkpoints, and is also present in a proportion of malignant B cells in DLBCL and in areas enriched for TAMs. LAG3high expression is associated with poor outcome independent of conventional prognosticators.
Introduction
The inability of the immune system to eradicate malignancy is a hallmark of cancer, and expression of the immune checkpoint ligand PD-L1 can predict outcome in diffuse large B-cell lymphoma (DLBCL), including following front-line chemoimmunotherapy.1-3 Trials suggest that, in some patients, the PD-1 axis is a potential therapeutic target4 ; however, given the modest efficacy observed,5 further optimization of checkpoint blockade is required to induce durable outcomes. Further data will assist the rational design of novel combination checkpoint-blockade therapies that may improve results. Dual blockade of the PD-1 axis with the immune checkpoint LAG3 is under clinical investigation.6,7 Data regarding the cellular distribution of LAG3, its association with other checkpoints, and its impact on outcome in DLBCL are sparse. LAG3 is expressed early in T-cell activation and reaches a peak in 24 to 48 hours. LAG3 is frequently coexpressed with other immune checkpoint markers in the setting of chronic viral infection or tumor and defines significant T-cell dysfunction.
LAG3 shares significant homology with CD4 but binds to major histocompatibility complex class II with an affinity ∼100 times that of CD4.8 It is found on activated CD4+ and CD8+ T cells, CD4+ regulatory T cells (Tregs), natural killer cells, and, occasionally, immunosuppressive plasma cells.9,10 In LAG3-knockout animal models, there is extensive T-cell expansion in response to infection.11,12 High levels of LAG3 on T cells correlate with reduced ability to clear and control viruses, such as HIV.13,14 We have previously demonstrated that high expression of LAG3 in Epstein-Barr virus (EBV)–associated Hodgkin lymphoma leads to EBV-specific T-cell immune suppression, and we have also demonstrated the association of LAG3 with EBV-associated DLBCL.15,16 A high level of LAG3 is associated with more aggressive features and confers poor prognosis in follicular lymphoma and chronic lymphocytic leukemia (CLL).17,18 Interestingly, in CLL, LAG3 expression is not restricted to T cells, with a proportion of malignant B cells also expressing LAG3.
Murine models indicate that combined blockade of the PD-1 axis and LAG3 enhances rejection of multiple tumor types, even when single-agent blockade of anti–PD-1 therapy was ineffective.19 Ongoing phase 1 studies of LAG3, predominantly in solid tumors, show promising early results.6,20
Here, we establish the expression of LAG3 within specific T-cell subsets and its relationship with other immune checkpoints in DLBCL. LAG3 expression by malignant B cells was also examined. Digital spatial profiling (DSP) also demonstrates an unexpected strong association between LAG3 and tumor-associated macrophages. We also assessed the impact of LAG3 on the outcome of patients who received frontline treatment with rituximab/cyclophosphamide/doxorubicin/vincristine/prednisone (R-CHOP).
Methods
Patient samples
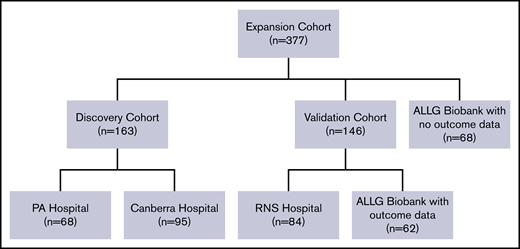
Details about the discovery (n = 163), validation (n = 146), and expansion (n = 377) cohorts tested by NanoString gene expression are provided in the consort diagram (Figure 1). Only de novo cases of DLBCL were included. Patients with grade 3B or transformed follicular lymphoma, HIV+ patients, and individuals who had undergone organ transplantation were excluded. Median follow-up was 3.75 years (discovery) and 3.5 years (validation). The study was approved by the ethics committee at participating centers. Clinical details are included in supplemental Table 1.
Consort diagram outlining patients with DLBCL with tissues tested for gene expression. The discovery cohort consisted of 163 patients with histologically confirmed DLBCL from the Princess Alexandra (PA) Hospital (n = 68), and the Canberra Hospital (n = 95) identified from a prospectively maintained clinical lymphoma database. All patients received chemoimmunotherapy with R-CHOP and otherwise were selected solely by availability of formalin-fixed paraffin-embedded tissue for RNA extraction and clinical annotation (including survival data). Findings were validated in an independent cohort of 146 patients treated with R-CHOP. This contained cases identified at the Royal North Shore (RNS) Hospital, Sydney (n = 84) from a prospectively maintained clinical lymphoma database and 62 patients from the Australasian Leukaemia and Lymphoma Group (ALLG) Biobank for whom outcome data were available. For the expansion cohort (used for association and correlation analysis), discovery and validation tissues (n = 309) were combined with 68 de novo DLBCL samples from the ALLG Biobank for which baseline clinical information and tissue data, but not outcome data, were available (total 377 tissues).
Consort diagram outlining patients with DLBCL with tissues tested for gene expression. The discovery cohort consisted of 163 patients with histologically confirmed DLBCL from the Princess Alexandra (PA) Hospital (n = 68), and the Canberra Hospital (n = 95) identified from a prospectively maintained clinical lymphoma database. All patients received chemoimmunotherapy with R-CHOP and otherwise were selected solely by availability of formalin-fixed paraffin-embedded tissue for RNA extraction and clinical annotation (including survival data). Findings were validated in an independent cohort of 146 patients treated with R-CHOP. This contained cases identified at the Royal North Shore (RNS) Hospital, Sydney (n = 84) from a prospectively maintained clinical lymphoma database and 62 patients from the Australasian Leukaemia and Lymphoma Group (ALLG) Biobank for whom outcome data were available. For the expansion cohort (used for association and correlation analysis), discovery and validation tissues (n = 309) were combined with 68 de novo DLBCL samples from the ALLG Biobank for which baseline clinical information and tissue data, but not outcome data, were available (total 377 tissues).
RNA quantification
RNA was extracted from formalin-fixed paraffin-embedded tumor biopsies using a RecoverAll Total Nucleic Acid Isolation Kit for FFPE Tissues (Ambion, Life Technologies), as per the manufacturer’s instructions, and stored at −80°C. Genes were digitally quantified using the nCounter platform (NanoString Technologies) as previously outlined.2,21,22 A targeted gene panel was chosen to permit quantification of LAG3, COO categorization (by Lymph2Cx assay), and analysis of selected immune effectors (CD4, CD8, CD56, TNF-α) and immune checkpoints (PD-1, PD-L1, PD-L2, TIM-3). Data from this analysis are available in supplemental Data file 1.
Immunohistochemistry
Diagnostic biopsy samples were available to generate tissue microarrays (TMAs) on 28 DLBCL cases from the Princess Alexandra Hospital (PAH). These were sectioned at 4 μm thickness and underwent single staining for LAG3 (EPR4392; abcam), PD-L1 (SP263; Ventana Medical Systems, Oro Valley, AZ), CD4 (SP35; Cell Marque), CD8 (C8/144B; Dako Denmark, Glostrup, Denmark), and TIM-3 (ab185703; abcam) using the BenchMark ULTRA IHC/ISH Staining Module (Ventana Medical Systems) with hematoxylin counter staining. The percentages of LAG3+, PD-L1+, CD8+, and CD4+ cells per sample were scored independently by 2 hematopathologists (C.G. and S.B.); discrepancies were resolved by consensus. An immunohistochemistry (IHC) validation cohort of 86 DLBCL biopsies on TMAs from the MD Anderson Cancer Center (MDACC) were stained for LAG3 and independently scored by 2 hematopathologists (X.T. and K.H.Y.). The PAH samples also underwent costaining for LAG3 and PAX5 (SP34; Cell Marque); the percentage of double-positive cells per sample was scored independently by 2 hematopathologists (C.G. and S.B.), and discrepancies were resolved by consensus.
Sixteen cases of DLBCL were also assessed for multiplex protein expression using the GeoMx platform (NanoString Technologies). Three regions of interest (ROIs) were selected for each DLBCL TMA core, isolating CD3 (15/16), CD20 (16/16), and CD68 (16/16) regions utilizing immunofluorescence. One case had insufficient CD3 cells identified for meaningful analysis. ROIs were then assessed for protein expression with multiple immune oncology markers from the NanoString IO Protein panel normalized to the geometric mean of 3 housekeeping proteins (GAPDH, histone H6, and S6).23
Flow cytometry
To investigate LAG3 cellular distribution in detail, a separate cohort of 8 DLBCL fresh-frozen deaggregated lymph nodes obtained from the PAH pathology laboratory underwent flow cytometric analysis. Clonally expanded and nonclonally expanded CD20+ B-cell populations were detectable by forward/side scatter, CD10 and/or CD5 λ and κ light chain restriction flow cytometric analysis of fresh-frozen deaggregated DLBCL lymph nodes. Surface and intracellular LAG3 was quantified on CD20+ B cells by comparing results with/without permeabilization and fixation. LAG3 and other immune checkpoints (PD-1, TIM-3) were measured on infiltrating T-cell subsets: CD8+ T cells, CD4+ natural Tregs (nTregs; CD25highCD127low), CD4+ induced Tregs (iTregs; CD25lowCD127low), and CD4+ non-Tregs (CD25+CD127+).24,25 Flow cytometry data were acquired on an LSRFortessa X-20 cell analyzer controlled by FACSDiva software (both from BD Biosciences).
Statistical analysis
Differences in values between groups of data were assessed for statistical significance using the 2-tailed Mann-Whitney U test. Categorical data were compared using the Fisher’s exact test or χ2 test. Overall survival (OS) was measured from diagnosis to date of last follow-up or death. Progression-free survival (PFS) was measured from the date of diagnosis to the date of last follow-up, disease progression, or death. Survival analysis used Kaplan-Meier curves and the log-rank test. Multivariate analysis was performed using Cox regression. All tests were 2-sided at the threshold of P = .05. All analyses were performed using GraphPad Prism platform (version 7; GraphPad Software, La Jolla, CA) and Statistical Package for the Social Sciences (SPSS) version 24 (IBM, New York, NY), with the exception of the maximum log-rank statistics evaluation, which was performed using R maxstat package.26
Results
LAG3 is frequently expressed on tumor-infiltrating CD4+ nTregs and CD8+ T cells
LAG3 protein expression on tumor-infiltrating lymphocytes (TILs) was initially measured by IHC (n = 28) on the PAH cohort. Results were validated in an independently scored cohort (n = 86) from MDACC. TIL LAG3 expression ≥1% was seen in 71% of PAH cases, with a median expression of 3% (range, 0-30), compared with 84% of samples from the MDACC cohort (median expression, 10%; range, 0-100).
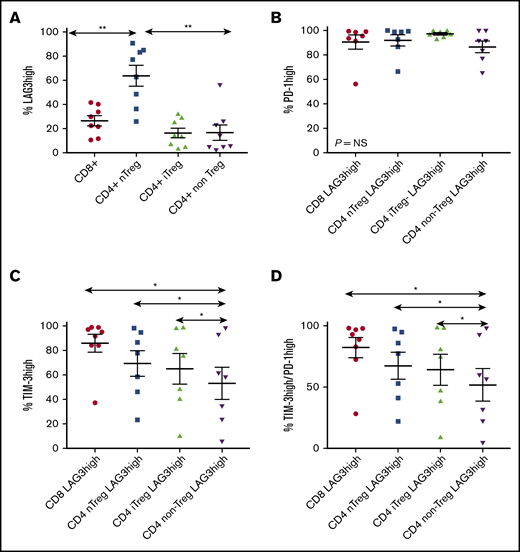
To more precisely establish LAG3 cellular specificity, TIL subsets from a separate cohort of 8 DLBCL fresh-frozen deaggregated lymph nodes were assessed by flow cytometry (Figure 2). A median of 64% of T cells was CD4+ (range, 21-89), and a median of 28% was CD8+ (range, 7-75). The majority of CD4+ T cells were non-Tregs (median, 52%; range, 30-71), a median of 21% was nTregs (range, 2-43), and 24% were iTregs (range, 11-32). Within CD4+ subsets, nTregs had a greater proportion of LAG3high T cells (median, 70%; range, 26-91) compared with iTregs (median, 14%; range, 4-32) and non-Tregs (median, 10%; range, 2-56; both P = .008). Interestingly, LAG3highCD8+ T cells (median, 26%; range, 11-42) were more abundant than LAG3highCD4+ T cells (median, 13%; range, 3-29; P = .008), but were lower than CD4+ nTreg subset (Figure 2A; P = .006).
Expression of LAG3 on TILs in DLBCL. Fresh-frozen deaggregated lymph nodes were examined using flow cytometry. (A) Greater percentages of LAG3high T cells are found in CD4+ nTregs compared with other T-cell subsets, with high percentages also observed in CD8+ T cells. (B) LAG3high TILs had almost universal coexpression of PD-1. (C) TILs coexpressing TIM-3 and LAG3 were common but were significantly increased in all subsets compared with non-Treg CD4+ T cells. (D) TILs with coexpression of LAG3, TIM-3, and PD-1 were significantly increased in all T-cell subsets compared with non-Treg CD4+ T cells. *P < .05, **P < .01. NS, not significant.
Expression of LAG3 on TILs in DLBCL. Fresh-frozen deaggregated lymph nodes were examined using flow cytometry. (A) Greater percentages of LAG3high T cells are found in CD4+ nTregs compared with other T-cell subsets, with high percentages also observed in CD8+ T cells. (B) LAG3high TILs had almost universal coexpression of PD-1. (C) TILs coexpressing TIM-3 and LAG3 were common but were significantly increased in all subsets compared with non-Treg CD4+ T cells. (D) TILs with coexpression of LAG3, TIM-3, and PD-1 were significantly increased in all T-cell subsets compared with non-Treg CD4+ T cells. *P < .05, **P < .01. NS, not significant.
Coexpression of PD-1 and TIM-3 with LAG3 was then tested. The majority of LAG3high TILs were PD-1high: median >90% in all 4 LAG3high TIL subsets examined (Figure 2B). The majority of LAG3high TILs also coexpressed TIM-3: a median of 93% (range, 37-99) of CD8+ T cells, a median of 78% of nTregs (range, 23-98), and a median of 76% of iTregs (range, 10-99); by comparison, only 58% (range, 6-98) of CD4LAG3high non-Treg TILs were TIM-3high (all P < .05 vs CD4+ non-Tregs; Figure 2C). Of LAG3high TILs coexpressing PD-1 and TIM-3, 91% (median; range, 28-98) were CD8+, 77% (median; range, 22-97) were nTregs, 75% (median; range, 9-98) were iTregs, and 56% (median; range, 4-97) were CD4+ non-Tregs, demonstrating that LAG3 is predominantly associated with high coexpression of other T-cell immune checkpoints within the tumor microenvironment (TME) in DLBCL, particularly in CD4+ nTregs and the CD8+ T-cell subset (Figure 2D). LAG3highCD4+ non-Treg TILs consisted of significantly fewer double-positive PD-1/TIM-3 cells compared with Tregs or CD8+ T cells.
LAG3 expression on DLBCL malignant B cells
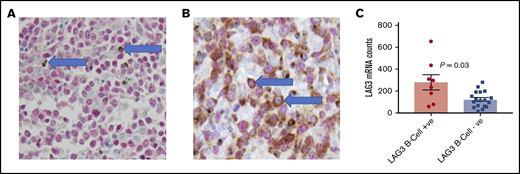
In 9 of 28 (32%) samples from the PAH cohort, LAG-3 IHC revealed large morphologically abnormal cells that expressed LAG3 in ≥5% of cells per sample (median, 45%; range, 5-80; Figure 3). These cells were assumed to be malignant B cells and exhibited cytoplasmic and membranous staining. These findings were confirmed in the MDACC cohort, which was assessed independently. In this cohort, 9 of 86 (10%) cases expressed LAG3 (using a 5% cutoff) on malignant B cells; a median of 70% of these cells (range, 30-100) expressed LAG3.
LAG3 expression in DLBCL (A) Case 1. LAG3 (brown) staining in PAX5− TILs (arrows). PAX5 (red) nuclear staining highlights B cells (original magnification ×40). (B) Case 2. Malignant B cells (arrows) show LAG3 expression (PAX5+/LAG3+) (original magnification ×40). (C) Patients with LAG3+ DLBCL cells by IHC had significantly higher total LAG3 mRNA gene counts in their diagnostic biopsies.
LAG3 expression in DLBCL (A) Case 1. LAG3 (brown) staining in PAX5− TILs (arrows). PAX5 (red) nuclear staining highlights B cells (original magnification ×40). (B) Case 2. Malignant B cells (arrows) show LAG3 expression (PAX5+/LAG3+) (original magnification ×40). (C) Patients with LAG3+ DLBCL cells by IHC had significantly higher total LAG3 mRNA gene counts in their diagnostic biopsies.
To confirm that the large atypical LAG3+ cells were malignant, costaining for LAG3 and PAX5 (a B-cell lineage–specific marker) was performed on the PAH cohort (Figure 3A-B), which confirmed LAG3+/PAX5+ malignant cells in all 9 of the initial PAH cases (median, 47%; range 30-80). Eight of 9 samples also had NanoString gene expression results available and had a higher level of LAG3 messenger RNA (mRNA; median digital gene count, 265) compared with the remaining 18 cases for which gene expression data were available (median count, 115; P = .03; Figure 3C).
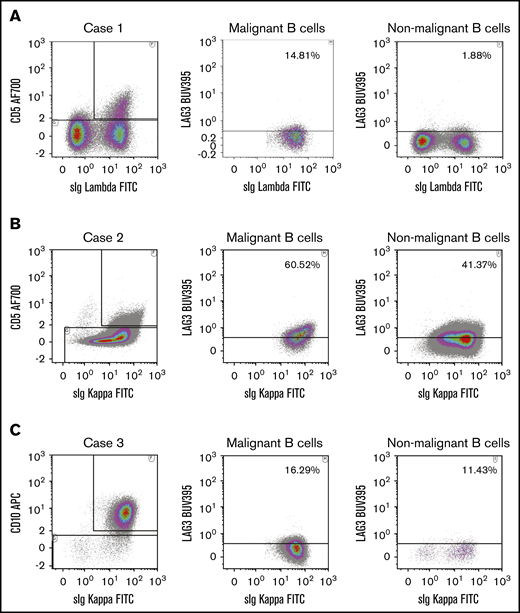
To further confirm malignant cell expression of LAG3, flow cytometry was performed on a separate cohort of 8 DLBCL fresh frozen deaggregated lymph nodes (Figure 4). In 7 of 8 cases, clonally expanded light chain restricted (malignant) and nonclonally expanded CD20+ B-cell populations were detected. Staining with or without permeabilization was performed in these cases to determine the proportion of intracellular and surface LAG3. LAG3 was detected in a proportion of clonal B cells in all 7 cases, likely indicating that flow cytometry is more sensitive than IHC for this type of analysis. Consistent with IHC, intracellular and surface staining was observed in clonal B cells (intracellular: median, 22%; range, 11.7-60.5; surface: median, 33%; range, 8.5-60.2) and in nonclonal B cells (intracellular: median, 11.4%; range, 1.9%-46.2%; surface: median, 12.8%; range, 8.5-37.6). There was no statistical difference between the proportions of LAG3high cells (for intracellular or surface staining) in clonal B cells or in nonclonal B cells.
Flow cytometry to detect LAG3 on clonally restricted B cells in DLBCL. Clonally expanded and nonclonally expanded CD20+ B-cell populations were detectable by forward/side scatter, CD10 and/or CD5 λ and κ light chain restriction flow cytometric analysis on fresh frozen deaggregated DLBCL lymph nodes. Representative flow cytometric plots show gating strategies and LAG3 staining in Case 1 (A), Case 2 (B), and Case 3 (C). In each case, clonally expanded CD20+ B cells were distinguished from nonclonally restricted CD20+ B-cell populations by gating on CD5+/κ+(or λ+) or CD10+/κ+ cells. sIg, soluble immunoglobulin.
Flow cytometry to detect LAG3 on clonally restricted B cells in DLBCL. Clonally expanded and nonclonally expanded CD20+ B-cell populations were detectable by forward/side scatter, CD10 and/or CD5 λ and κ light chain restriction flow cytometric analysis on fresh frozen deaggregated DLBCL lymph nodes. Representative flow cytometric plots show gating strategies and LAG3 staining in Case 1 (A), Case 2 (B), and Case 3 (C). In each case, clonally expanded CD20+ B cells were distinguished from nonclonally restricted CD20+ B-cell populations by gating on CD5+/κ+(or λ+) or CD10+/κ+ cells. sIg, soluble immunoglobulin.
Impact of LAG3 gene expression on outcome
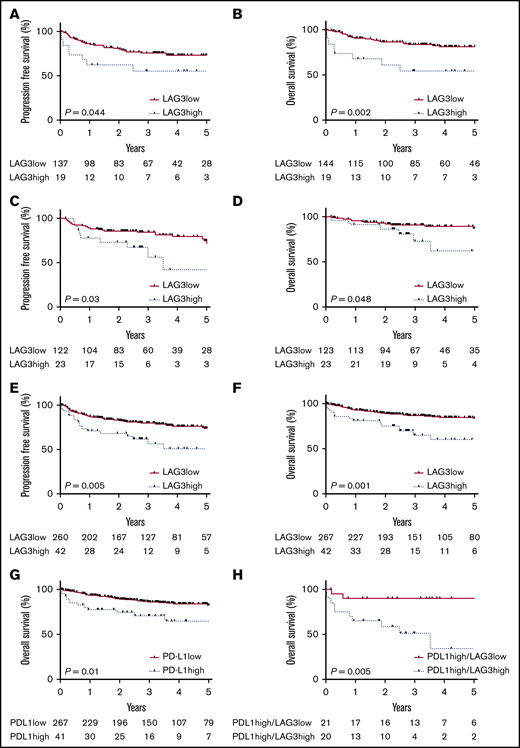
The mean LAG3 digital gene count was 224 for the discovery cohort (95% confidence interval [CI], 191-259). Next, the discovery cohort was analyzed to determine a LAG3 digital gene count cutoff that dichotomized patients into high- and low-risk subsets for adverse OS over the follow-up period. Maximally selected rank statistics were used to select the optimal cutoff point for a high vs low LAG3 digital gene count based on the most disparate statistically significant 5-year OS curve.26 Using a cutoff of 462 (equating to the highest octile of LAG3 mRNA expression), patients with high LAG3 digital gene count (≥462) had a markedly inferior PFS compared with those with a low LAG3 digital gene count (5-year PFS, 55.4% vs 73.2%, respectively; hazard ratio [HR], 2.16; 95% CI, 0.78-5.97; P = .044; Figure 5A). OS was also inferior for patients with high LAG3 digital gene count compared with low LAG3 digital gene count (5-year OS, 54.4% vs 81.4%; HR, 3.29; 95% CI, 0.99-10.91; P = .002; Figure 5B).
PFS and OS stratified by LAG3. Kaplan-Meier survival curves stratified by LAG3high or LAG3low mRNA digital gene counts. PFS (A) and OS (B) for patients in the discovery cohort. PFS (C) and OS (D) for patients in the validation cohort. PFS (E) and OS (F) for patients in the combined discovery and validation cohorts. (G) OS for patients from the combined cohort with high expression of PD-L1 mRNA. (H) OS for PD-L1high cases in the combined cohort stratified by the LAG3high prognostic cutoff.
PFS and OS stratified by LAG3. Kaplan-Meier survival curves stratified by LAG3high or LAG3low mRNA digital gene counts. PFS (A) and OS (B) for patients in the discovery cohort. PFS (C) and OS (D) for patients in the validation cohort. PFS (E) and OS (F) for patients in the combined discovery and validation cohorts. (G) OS for patients from the combined cohort with high expression of PD-L1 mRNA. (H) OS for PD-L1high cases in the combined cohort stratified by the LAG3high prognostic cutoff.
This same digital gene count was used in the validation cohort (Figure 5C-D). This cutoff identified the highest 16% of expressers of LAG3 (ie, similar to the discovery cohort) and showed inferior 5-year PFS for patients with high LAG3 digital gene count compared with low LAG3 digital gene count (42.1% vs 74.6%, respectively; HR, 2.23; 95% CI, 0.85-5.91; P = .03). Five-year OS was again inferior in the high LAG3 group (62.6% vs 87.2%; HR, 2.48; 95% CI, 0.72-8.54; P = .048).
The differences in 5-year OS (78.0% in the discovery cohort and 82.3% in the validation cohort) and baseline characteristics (median age, 62 years in both groups; 57% males and 45% males and 44% and 47% had an International Prognostic Score [IPI] of 3-5 in the discovery and validation cohorts, respectively) between the 2 cohorts were not statistically different, justifying the pooling of all 309 patients for LAG3 survival analysis, using the same LAG3 digital gene count cutoff as before. Analysis of the pooled data showed that high LAG3 mRNA (>462) was associated with inferior PFS (5-year PFS, 50.8% vs 73.8%; HR, 2.12; 95% CI, 1.06-4.24; P = .005) and OS (5-year OS, 60.1% vs 84.0%; HR, 2.7; 95% CI, 1.74-9.11; P = .001) compared with low LAG3 digital gene count (Figure 5E-F). LAG3 was a significant predictor of outcome in non–germinal center B-cell (GCB) cases but not in GCB cases (supplemental Figure 1).
Multivariate and association analysis
In a multivariate model that also included CD4, CD8, CD56, CD68, and PD-L1 in the combined cohort, high LAG3 mRNA expression (P = .026) was independent of IPI (P < .01) and cell-of-origin (COO) (P = .35), by Lymph2Cx assay, as a predictor of poor OS. LAG3 (P = .045) was also an independent predictor of PFS (IPI, P = .001; COO, P = .87).
The discovery and validation samples were combined with 68 de novo DLBCL biopsy samples from the Australasian Leukaemia and Lymphoma Group Biobank (that had baseline clinical data but not outcome data) for an expansion cohort of 377 cases, to test for associations. Applying the 462 gene count cutoff, patients with high LAG3 were more likely non-GCB (64%) compared with low LAG3 patients typed as non-GCB (34%) (P = .0009), as assessed by the Lymph2Cx assay. Otherwise, no LAG3 association was observed with IPI (or its individual components), sex, or EBER-ISH (EBV) status (all P > .05).
LAG3 stratifies outcome in PD-L1high patients with DLBCL
PD-L1 has previously been shown to be associated with outcome in patients with DLBCL treated with R-CHOP.2 Consistent with this finding, PD-L1 expression in the combined cohort was found to be a predictor of outcome. As with LAG3, we used the top octile of PD-L1 expressers to define high PD-L1 gene count. Using this cutoff, patients with high PD-L1 had inferior 5-year PFS (48.2% vs 73.9%; HR, 2.12; 95% CI, 1.04-4.33; P = .005) and 5-year OS (65% vs 83%; HR, 2.2; 95% CI, 0.97-5.29; P = .01) compared with patients with low PD-L1. LAG3 was modestly correlated with PD-L1 (r = 0.55, P < .0001). Consistent with this, LAG3high patients were 5 times more common among the PD-L1high population (49% vs only 9% in the PD-L1low population; P < .0001). Next, we tested whether LAG3high/PD-L1high expression in the combined cohort might identify patients with a particularly poor outcome by investigating the ability of LAG3high to stratify PD-L1high patients (Figure 5G-H). Patients who were LAG3high/PD-L1high had a poor outcome (5-year PFS, 24.1% vs 72.2%; HR, 3.63; 95% CI, 1.33-9.87; P = .011; 5-year OS, 34.1% vs 90.0%; HR, 6.48; 95% CI, 2.07-20.3; P = .005) compared with patients who were LAG3low/PD-L1high.
Soluble LAG3 as a minimally invasive biomarker
Paired plasma samples (pretherapy and at the time of interim positron emission tomography [PET] after 4 cycles of R-CHOP) were available for 13 patients from the Australasian Leukaemia and Lymphoma Group Biobank. Circulating soluble LAG3 was quantified using the MSD R-PLEX assay at the TetraQ facility (Brisbane, Australia). We observed higher soluble LAG3 in patients with DLBCL at diagnosis compared with healthy controls (P < .0001; Figure 6). Patients whose interim PET/CT was negative experienced a significant drop in soluble LAG3 levels between time points (P = .008), whereas no change in soluble LAG3 levels was observed in those whose interim PET/CT remained positive. There was no association between soluble LAG3 and tumor gene expression of LAG3. In addition, the supernatant from 3 DLBCL cell lines (SUDHL2, SUDHL4, Pfeiffer) was assayed using the same method, but no soluble LAG3 was detected.
Circulating paired soluble LAG3 levels in patients with DLBCL. (A) Paired soluble LAG3 levels at diagnosis (Pre) and after 4 cycles of R-CHOP (Post) compared with healthy subjects (Controls). (B) Paired soluble LAG3 levels in patients whose interim PET/computed tomography (CT) remained positive after 4 cycles of R-CHOP. (C) Paired soluble LAG3 levels in patients whose interim PET/CT was negative after 4 cycles of R-CHOP. *P < .05, **P < .01.
Circulating paired soluble LAG3 levels in patients with DLBCL. (A) Paired soluble LAG3 levels at diagnosis (Pre) and after 4 cycles of R-CHOP (Post) compared with healthy subjects (Controls). (B) Paired soluble LAG3 levels in patients whose interim PET/computed tomography (CT) remained positive after 4 cycles of R-CHOP. (C) Paired soluble LAG3 levels in patients whose interim PET/CT was negative after 4 cycles of R-CHOP. *P < .05, **P < .01.
DSP shows high levels of LAG3 protein expression in T-cell and macrophage regions of DLBCL tumors
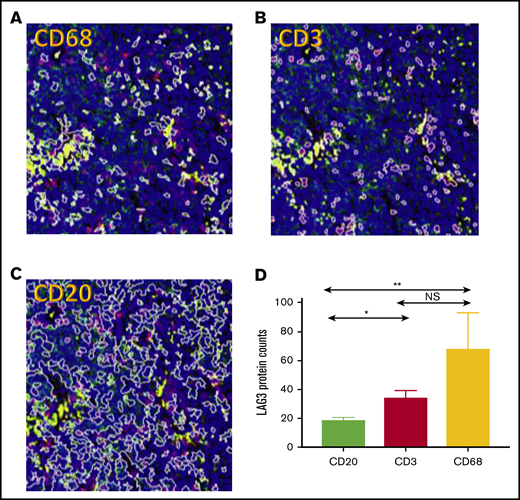
Each of the ROIs (CD3, CD68, CD20) selected was assessed for LAG3 protein expression. The digital protein counts for LAG3 across all samples was significantly lower in CD20 ROIs (median, 15.82; range, 6.4-49.5) compared with CD3 ROIs (median, 24.6; range, 10.1-77.8) and CD68 ROIs (median, 27.6; range, 7.3-402.2) (Figure 7). Across the 3 selected ROIs, the median percentage that each contributed to total LAG3 was CD20 (23%), CD6 (41%), and CD3 (36%). Although, in general, most of the LAG3 was found in CD3 and CD68 areas, there were cases in which LAG3 predominated in CD20 areas.
DSP of CD3, CD68, and CD20 regions in DLBCL TME. Representative sample of selected ROIs in 1 case of DLBCL with the same region of tumor demarcated based on CD68 (A; yellow), CD3 (B; red), and CD20 (C; green) ROIs and nuclei/DNA (blue). Original magnification ×20. (D) Average digital counts for LAG3 across all 16 tested cases for CD20, CD3, and CD68, with the CD3 and CD68 ROIs showing significantly higher LAG3 digital protein counts. *P < .05, **P < .01.
DSP of CD3, CD68, and CD20 regions in DLBCL TME. Representative sample of selected ROIs in 1 case of DLBCL with the same region of tumor demarcated based on CD68 (A; yellow), CD3 (B; red), and CD20 (C; green) ROIs and nuclei/DNA (blue). Original magnification ×20. (D) Average digital counts for LAG3 across all 16 tested cases for CD20, CD3, and CD68, with the CD3 and CD68 ROIs showing significantly higher LAG3 digital protein counts. *P < .05, **P < .01.
Interestingly, LAG3 in CD68 regions was very strongly associated with CD20, indicating that these macrophage areas appeared to be in close proximity to CD20 cells (r = 0.8; P < .001; supplemental Figure 2). It has previously been described that DSP assignment in the setting of melanoma that CD8 Tcells in close proximity to melanocytes was predictive of favorable outcomes and that DSP acted as an accurate low-resolution molecular proximity assay within the TME. LAG3 in these CD68 ROIs was also highly correlated with PD-1 (r = 0.76; P = .002), TGFB1 (r = 0.73; P = .003), PD-L2 (r = 0.68; P = .006), FOXP3 (r = 0.62; P = .015), and CD40L (r = 0.61; P = .017) and negatively correlated with CD163 (r = −0.53; P = .045) and CD44 (r = −0.67; P = .007). The LAG3high (median cutoff) CD68 regions were enriched for PD-1, TGFB, and PD-L2, but they were also significantly negatively correlated with CD163 (supplemental Figure 2). This indicates that these CD68 LAG3-rich areas are skewed toward an M1 type of macrophage. Further studies are required to assess whether these potential antitumor macrophage responses are attenuated by this LAG3 expression.
CD20 LAG3 expression was not significantly correlated with any immune checkpoints.
In the CD3 ROIs, LAG3 was very strongly correlated with CD40L (r = 0.88; P < .001), PD-1 (r = 0.87; P < .0001), TGFB (r = 0.85; P < .001), PD-L2 (r = 0.71; P = .005), CD56 (r = 0.66; P = .012), and ARG1 (r = 0.6, P = 0.026) in keeping with areas of immune response but with significant immune exhaustion.
Discussion
In this study, LAG3 was most highly expressed on CD4+ Tregs and CD8+ TILs and was typically coexpressed with PD-1 and TIM-3. LAG3 was also present in a proportion of malignant B cells in DLBCL, and these patients had significantly higher LAG3 total gene counts in their diagnostic biopsies. Digital protein spatial profiling also indicates a strong association of LAG3 with macrophages in the TME. Soluble LAG3 levels declined with therapy in patients with responsive disease, suggesting that soluble LAG3 may have utility as a minimally invasive disease response biomarker. However, sequential samples, including blood taken while in remission, from larger numbers of patients and with prolonged follow-up are required before any definitive statements can be made.
High LAG3 gene expression was associated with inferior PFS and OS. Although elevated LAG3 was significantly more likely to type as non-GCB, the impact of LAG3 gene expression on outcome was independent of COO and IPI. LAG3high/PDL1high expression in the combined cohort appeared to identify patients with a particularly poor outcome. Results suggest that combination blockade of the PD-1 axis and the immune checkpoint LAG3 warrants further investigation.
In follicular lymphoma, intratumoral LAG3high T cells frequently coexpress TIM-3 and PD-1 and are associated with reduced cytokine and cytotoxic granule production.17 Similarly, in DLBCL, we observe frequent coexpression of TIM-3 and PD-1, consistent with a functionally exhausted immune phenotype. Blockade of the PD-1 axis in DLBCL has been disappointing.5 It is possible that the high coexpression of PD-1 with LAG3 on infiltrating CD4+ nTregs and CD8+ T cells contributes to anti–PD-1 resistance in DLBCL. Recent studies in Hodgkin lymphoma support this; LAG3-expressing Tregs were shown to be strongly associated with immune suppression and inferior outcomes.27 Furthermore, there is emerging evidence that expression of LAG3 by intratumoral T cells is a major determinant of response to chimeric antigen receptor T cells, with the 11% of patients expressing the highest levels of LAG3 having high relapse and refractory response rates.28 Interestingly, the addition of an anti-LAG3 antibody to PD-1 blockade in patients who developed resistance to anti–PD-1 has resulted in second responses in solid tumors.6
Another important finding was that, in DLBCL, LAG3 is expressed by malignant and nonmalignant cells in the TME in a subset of patients; these cases had higher LAG3 gene expression. These results are consistent with previous studies that reported LAG3 expression by malignant cells in DLBCL using IHC.29,30 Of note, these studies quantified LAG3 on malignant B cells by morphological criteria and single-stain IHC only. Our results, using flow cytometry to identify clonal B cells on fresh-frozen deaggregated lymph nodes, suggest it is likely that IHC may underestimate the number of DLBCL cases that express LAG3 on the malignant B cell. Interestingly, in CLL, LAG3 expression is also not restricted to T cells, with a proportion of malignant CLL cells expressing LAG3.18 However, although LAG3 had a predominantly intracellular distribution in CLL cells, intracellular and surface LAG3 are observed in DLBCL.
Nonclonal B cells also expressed LAG3. Interestingly, a subset of regulatory LAG3high B cells was recently identified.9 The role of LAG3-expressing clonal and nonclonal B cells remains unclear, and further research is required to understand LAG3 expression in normal B cells. Interestingly, Hodgkin lymphoma and DLBCL are LAG3-expressing lymphoproliferative disorders that are known to be enriched in immunosuppressive macrophages.31 LAG3-expressing B cells might polarize tissue-resident macrophages to promote a tolerogenic TME, a notion supported by recent models of inflammatory bowel disease.32 LAG3 may also bind to stable peptide MHC class II complexes to activate an immune-suppression pathway.33 Our spatial profiling findings demonstrate that CD68-rich regions in the TME contribute significantly to the expression of LAG3 in the tumor; intriguingly, it appears to be more strongly associated with M1, rather than M2, macrophages. In addition, we show that these macrophages appear to exist in close proximity to the malignant B cell and, thus, are likely to impact response to therapy. Further studies are required to understand these complex immune cell interactions and how they may impact outcome and future therapeutic strategies.
Consistent with findings in solid cancers, the current study found that high levels of LAG3 were associated with inferior PFS and OS, independently of conventional prognosticators.34-36 The combination of intratumoral PD-L1high/LAG3high appears to be associated with particularly poor outcome, although findings require further validation in independent cohorts. Patients with elevated PD-L1, but low LAG3, mRNA levels did not appear to have inferior outcomes.
In summary, we provide intriguing data delineating a key role for intratumoral LAG3 in DLBCL. This is likely to be a complex interaction involving LAG3 on CD4+ nTregs, CD8+ T cells, and clonal and nonclonal B cells that likely involves other immune checkpoints. Combination blockade of the PD-1 axis and the immune checkpoint LAG3 warrants investigation. This should include mechanistic studies to determine the relative contribution of different LAG3-expressing cellular populations, as well as to quantify the impact that blockade of multiple checkpoints might have on immune function.
Acknowledgments
The authors thank Paula Ridge and David Gan (Pathology Queensland) for technical assistance in optimizing PD-L1, LAG3, and LAG3/PAX5 IHC staining and editing drafts of the section describing IHC methodology. Use of samples from the ACT Haematology Research Tissue Bank and the ALLG tissue bank is acknowledged.
This work was supported in part by a research grant from Bristol-Myers Squibb. C.K. is supported by an NHMRC Early Career Fellowship and by Cancer Cure Australia/Cancer Australia, M.K.G. was supported by the Leukaemia Foundation, and S.B. is supported by Pathology Queensland Study, Education and Research Committee. The Translational Research Institute is supported by a grant from the Australian government.
Authorship
Contribution: G.G., S.G., A.G., S.J., J.W.T., S.B., W.S.S., K.H.Y., E.A., L.M.d.L., S.C.L., M.B.S., X.T., Z.Y.X.-M., A.H., S.-J.H., D.C., and C.G. performed assays; G.T. analyzed data; W.S.S., R.B., M.H., S.J., K.H.Y., and D.T. contributed samples and results of analyses; C.K. designed and performed assays and analyzed data; M.K.G. conceived and oversaw the project; C.K. and M.K.G. wrote the manuscript; and all authors approved the final version of the manuscript.
Conflict-of-interest disclosure: D.T. has received personal fees from Janssen, Roche, and Amgen; grants from Roche, Takeda, and Amgen; and nonfinancial support from Roche and Amgen (outside of the submitted work). M.H. has received personal fees from Takeda, Roche, MSD, AbbVie, Amgen, and Janssen (outside of the submitted work). C.G. has received nonfinancial support for domestic travel and accommodations from Novo Nordisk. C.K. has received grants from Bristol-Myers Squibb (related to the submitted work), as well as personal fees from MSD, Roche, Celgene, and Janssen and nonfinancial support from MSD, Takeda, and Roche (outside of the submitted work). M.K.G. has received personal fees and sat on advisory boards for from MSD and Janssen, grants and personal fees from Gilead and Celgene, and grants from Janssen and Bristol-Myers Squibb (related to the submitted work), as well as personal fees from BMS and Amgen and other from Takeda (outside of the submitted work). The remaining authors declare no competing financial interests.
Correspondence: Colm Keane, Level 4 East, Mater Research Institute–University of Queensland, Translational Research Institute, Brisbane, QLD 4102, Australia; e-mail: colm.keane@mater.uq.edu.au.
References
Author notes
The full-text version of this article contains a data supplement.

