

Key Points
Artemisinins increased CHOP, decreased MCL1, and synergized with BCL2 inhibitors and SOR against human acute leukemia cells in vitro.
Combination of a potent artemisinin analog with SOR plus VEN reduced AML xenografts and primagrafts in vivo.

Abstract
Artemisinins are active against human leukemia cell lines and have low clinical toxicity in worldwide use as antimalarials. Because multiagent combination regimens are necessary to cure fully evolved leukemias, we sought to leverage our previous finding that artemisinin analogs synergize with kinase inhibitors, including sorafenib (SOR), by identifying additional synergistic antileukemic drugs with low toxicity. Screening of a targeted antineoplastic drug library revealed that B-cell lymphoma 2 (BCL2) inhibitors synergize with artemisinins, and validation assays confirmed that the selective BCL2 inhibitor, venetoclax (VEN), synergized with artemisinin analogs to inhibit growth and induce apoptotic cell death of multiple acute leukemia cell lines in vitro. An oral 3-drug “SAV” regimen (SOR plus the potent artemisinin-derived trioxane diphenylphosphate 838 dimeric analog [ART838] plus VEN) killed leukemia cell lines and primary cells in vitro. Leukemia cells cultured in ART838 had decreased induced myeloid leukemia cell differentiation protein (MCL1) levels and increased levels of DNA damage–inducible transcript 3 (DDIT3; GADD153) messenger RNA and its encoded CCATT/enhancer-binding protein homologous protein (CHOP), a key component of the integrated stress response. Thus, synergy of the SAV combination may involve combined targeting of MCL1 and BCL2 via discrete, tolerable mechanisms, and cellular levels of MCL1 and DDIT3/CHOP may serve as biomarkers for action of artemisinins and SAV. Finally, SAV treatment was tolerable and resulted in deep responses with extended survival in 2 acute myeloid leukemia (AML) cell line xenograft models, both harboring a mixed lineage leukemia gene rearrangement and an FMS-like receptor tyrosine kinase-3 internal tandem duplication, and inhibited growth in 2 AML primagraft models.
Introduction
Most patients with acute leukemias are still treated principally with the same drug regimens used for the past 4 decades, even though these therapies result in substantial mortality and serious morbidities. Although current treatments cure most children with acute lymphoblastic leukemias (ALLs), ∼20% of pediatric and ∼50% of adult ALL cases still relapse, particularly in poor prognostic categories including cases harboring mixed lineage leukemia chromosomal rearrangements (MLLr).1,2 Relapsed ALL generally requires intensive treatment, such as chimeric antigen receptor–T-cell and/or allogeneic stem cell transplantation.3,4 Acute myeloid leukemia (AML) is cured in only ∼30% of patients treated in the United States,5,6 and standard AML chemotherapy causes severe morbidity with treatment-related deaths in ∼10% of younger patients, precluding use in frail senior patients; this is a substantial limitation because the median AML patient is 67 years old.7,8 AML is now recognized to be an extremely heterogenous disease characterized by parallel evolution and emergence in an individual patient of multiple codominant cellular clones, each harboring a different set of mutations as well as chromatin modifications that result in gene-expression abnormalities.9,10 This molecular understanding not only rationalizes disappointing clinical observations that even mutation-targeted inhibitors have predominantly induced only partial responses as single agents in patients,11,12 but also motivates efforts to develop novel effective, low-toxicity multiagent combinations of antileukemic agents.13-15
Artemisinins, a large class of derivatives of the natural compound artemisinin, are used worldwide to treat malaria with essentially no human toxicity.16,17 Artemisinins are also active against multiple human cancer cell types,18-29 including leukemia cells resistant to standard clinical antineoplastic drugs and harboring poor-prognosis genetic aberrations, for example, BCR-ABL, FMS-like receptor tyrosine kinase-3 internal tandem duplication (FLT3-ITD), and MLLr.18-20,30,31 We reported that artemisinin-derived trioxane diphenylphosphate dimer 838 (ART838)32-34 was ∼88-fold more potent than artesunate (AS), the major clinical artemisinin derivative, against 23 human AML and ALL cell lines tested, with minimal in vitro toxicity to normal human hematopoietic stem-progenitor cells (HSPCs).18 Our prior observation that artemisinins synergized in vitro with kinase inhibitors, including sorafenib (SOR), against leukemia cell lines18 stimulated us to seek additional targeted drugs that might synergize with ART838 and SOR as a tolerable 3-drug combination. As we chose here to emphasize AMLs containing the prevalent and particularly poor-prognosis MLLr and FLT3-ITD mutations, all experiments depicted in our main figures evaluated MOLM14 and/or MV4;11 AML cell lines, each harboring both MLLr and FLT3-ITD, and additional acute leukemia cell lines and primary cases were investigated less extensively.
Leukemia cells cultured with ART838 reduced myeloid leukemia cell differentiation protein (MCL1) and upregulated integrated stress response messenger RNA (mRNA)/protein DNA damage–inducible transcript 3 (DDIT3)/CCATT/enhancer-binding protein (C/EBP) homologous protein (CHOP), potential biomarkers for artemisinin action. SOR reduced MCL1 with minimal CHOP elevation, suggesting that SOR plus ART838 plus venetoclax (VEN; SAV) combine to target MCL1 and B-cell lymphoma 2 (BCL2) via discrete mechanisms. The SAV combination demonstrated strong synergy in vitro and clear efficacy/tolerability in AML xenograft and primagraft models. Thus, SAV warrants further development for leukemia treatment.
Methods
Antibodies, compounds, other reagents
Supplemental Table 1 details the reagents used.
Cells
Leukemia cell lines, primary cells, and luciferase (luc)-yellow fluorescent protein (YFP) labeling of AML cells are described in supplemental Table 2 and supplemental Methods. Western blots of several of the cell lines and primary cases for BCL2, MCL1, and BCLxL are in supplemental Figure 1, along with the 50% inhibitory concentrations (IC50s) of competitive inhibitors of these BCL2-family proteins.
Cell-metabolic assays
Cell metabolism was assessed by alamarBlue assays (Life Technologies, Grand Island, NY) following the manufacturer’s guidelines. Cell death was verified by Annexin V/7-aminoactinomycin D (7AAD) staining (BioLegend, San Diego, CA) per the manufacturer’s guidelines.18
Leukemia xenograft/primagraft assays
Immunodeficient NOD.Cg-Rag1tm1MomIl2rgtm1Wjl/SzJ (NRG) mice were bred at the University of Maryland Baltimore (UMB) from breeders purchased from The Jackson Laboratory (JAX; Bar Harbor, ME). Seven to 14 days after IV (tail vein) transplant of 0.5 × 10⁶ to 1 × 10⁶ luc/YFP-labeled leukemia cells, luminescence (AML burden) was quantitated on treatment day 0 in each NRG mouse by bioluminescence imaging (BLI) (Xenogen IVIS Spectrum; PerkinElmer, Waltham, MA). Mice were allocated to treatment groups (usually ≥5-10 mice per group) so that each group had similar average day 0 luminescence, then groups were administered drug orally (by mouth; gavage). Luminescence of each mouse was assessed over time and compared with that mouse’s day 0 AML burden (fold-change). Clinical behavior, appearance, weight, and survival were also monitored.
Western blotting
Cellular protein was extracted, quantitated, electrophoresed, and western blotted with monoclonal antibodies. Antibody-specific band intensities were quantitated by densitometry (ChemiDOC XRS+ and Image Laboratory system; Bio-Rad, Hercules, CA) and normalized to β-actin.35
Quantitative reverse transcription PCR
Total RNA was isolated, complementary DNA was synthesized, and SYBR Green quantitative polymerase chain reaction (PCR) was performed in triplicate (Applied Biosystems QuantStudio 6 Flex and Real-Time PCR software; ThermoFisher Scientific); primer sequences are shown in supplemental Methods. Cycle threshold values were normalized to glyceraldehyde-3-phosphate dehydrogenase.35,36
Data analysis
The different drug treatments of cells and mice are color-coded consistently across all figures. Statistical analyses were performed using Prism 8.4 GraphPad software (San Diego, CA). Data are presented as arithmetic mean plus or minus standard error of the mean (SEM) from ≥3 independent experiments unless otherwise indicated. AML burden (luminescence) fold-change values are geometric means. To compare experimental groups, P values were calculated by analysis of variance, followed by the Dunnett multiple-comparisons test unless otherwise indicated (*P < .05; **P < .01; ***P < .001; no asterisk, P > .05). For time-to-event end points of in vivo xenograft experiments, Kaplan-Meier survival curves were compared by log-rank (Mantel-Cox).
Results
BCL2 inhibitors synergized with ART838 to inhibit growth and enhance apoptotic death of human acute leukemia cells
We screened a library of 111 targeted antineoplastics37-43 to identify drugs that synergized with ART838 and/or AS.18 To identify broad synergism against AMLs and ALLs, screening was performed in 3 human acute leukemia cell lines: MOLM14 AML (harboring MLLr KMT2A-MLLT3, FLT3-ITD), KOPN8 ALL (harboring MLLr KMT2A-MLLT1), and RCH-ACV ALL (non-MLLr) (supplemental Table 2). Each drug was ranked by “synergy score,” the observed growth inhibition of the drug pair compared with the additive effect predicted by the Bliss independence model, averaged across all 3 cell lines44-46 (supplemental Methods; Figure 1A; supplemental Figure 2A). Two of the 3 most synergistic drugs were the only BCL2-competitive inhibitors in the library: ABT737 (chemically similar to clinically tested navitoclax [NAV]; inhibits BCL2, BCLxL, and BCLW)47,48 and ABT199 (renamed VEN; selectively inhibits BCL2).49 Cooperativity of ABT737, VEN, or NAV with ART838 and AS was confirmed in MOLM14 AML (supplemental Figure 2B-D). Because NAV causes clinical thrombocytopenia,50,51 we prioritized VEN for further studies focused on MOLM14 and MV4;11 AMLs (both containing MLLr and FLT3-ITD, along with other mutations).
![ART838 synergized strongly with BCL2 inhibitors to inhibit growth and induce death of human leukemia cells. (A) Top 5 hits from the artemisinin synergy screen; BCL2 inhibitors are shown in bold. Synergy scores >0 indicate drug synergy, 0 additivity, and <0 antagonism. (B) Antileukemic synergy between ART838 and VEN against KOPN8 ALL, and ML2 and MV4;11 AML cell growth was validated by alamarBlue assays following 48-hour culture with ART838, VEN, or ART838 plus VEN.18,52,53 Data points represent means of 3 independent experiments performed with triplicate samples plus or minus SEM, normalized to vehicle (dimethyl sulfoxide [DMSO])-treated controls set to 1. Combination indices (CIs) were determined using CompuSyn software based on Chou-Talalay principles52,53; CI < 1 indicates synergy; CI = 1, additivity; CI > 1, antagonism. CI at each drug’s IC50 is shown in bold. (C) Percentage of viable cells was quantitated by flow cytometry after Annexin V/7AAD staining of KOPN8 ALL, ML2, and MV4;11 AML cells following short (18-hour) treatment with either DMSO (○; colored symbols are as shown in the key in panel A), ART838 (200 nM), VEN (50 nM), or ART838 (200 nM) plus VEN (50 nM), with and without preincubation with 10 nM pan-caspase inhibitor QVD.54 Data points represent the percentage of viable (Annexin V−/7AAD−) cells averaged from 3 independent experiments. Statistical comparisons were performed for combination treatments vs single-drug treatments, at each drug dose (B), or for drug treatment groups vs DMSO control (C). *P < .05; **P < .01; ***P < .001; no asterisk if P > .05.](https://ash.silverchair-cdn.com/ash/content_public/journal/bloodadvances/5/3/10.1182_bloodadvances.2020003429/1/m_advancesadv2020003429f1.png?Expires=1767739739&Signature=P7RIonwNNLwPKeAa3lo0OcNCx~KUCDDC8Xx9X73PAR5HMYKxbuxoBK5ccFXfrlkvTXQCSWUshcr-cYX6DoJuOHs2BTAkrleRIDMidoOEonG6y9mKWvZuxrdYhCervi6RzLhJUyqvcT-MX-NnKT8kMkLtAyS-79uUYXn4wWkoCF45yJHlJe4Do4qj2NgNV6vyFq40JVTmgzGdsIZNSZ7GiWGj4-3pbPH1myQR~sMcaX6leuD-s2-P5TiBAh6jWKif6ssqBcASlliN1jOEe7knsiBxF~eW~6lOYYmdWKCG97X-EOqjZXrtE1crptZ4IbavPAx2H2nkq7m-gP4-szfHQQ__&Key-Pair-Id=APKAIE5G5CRDK6RD3PGA)
ART838 synergized strongly with BCL2 inhibitors to inhibit growth and induce death of human leukemia cells. (A) Top 5 hits from the artemisinin synergy screen; BCL2 inhibitors are shown in bold. Synergy scores >0 indicate drug synergy, 0 additivity, and <0 antagonism. (B) Antileukemic synergy between ART838 and VEN against KOPN8 ALL, and ML2 and MV4;11 AML cell growth was validated by alamarBlue assays following 48-hour culture with ART838, VEN, or ART838 plus VEN.18,52,53 Data points represent means of 3 independent experiments performed with triplicate samples plus or minus SEM, normalized to vehicle (dimethyl sulfoxide [DMSO])-treated controls set to 1. Combination indices (CIs) were determined using CompuSyn software based on Chou-Talalay principles52,53 ; CI < 1 indicates synergy; CI = 1, additivity; CI > 1, antagonism. CI at each drug’s IC50 is shown in bold. (C) Percentage of viable cells was quantitated by flow cytometry after Annexin V/7AAD staining of KOPN8 ALL, ML2, and MV4;11 AML cells following short (18-hour) treatment with either DMSO (○; colored symbols are as shown in the key in panel A), ART838 (200 nM), VEN (50 nM), or ART838 (200 nM) plus VEN (50 nM), with and without preincubation with 10 nM pan-caspase inhibitor QVD.54 Data points represent the percentage of viable (Annexin V−/7AAD−) cells averaged from 3 independent experiments. Statistical comparisons were performed for combination treatments vs single-drug treatments, at each drug dose (B), or for drug treatment groups vs DMSO control (C). *P < .05; **P < .01; ***P < .001; no asterisk if P > .05.
ART838 synergized strongly with BCL2 inhibitors to inhibit growth and induce death of human leukemia cells. (A) Top 5 hits from the artemisinin synergy screen; BCL2 inhibitors are shown in bold. Synergy scores >0 indicate drug synergy, 0 additivity, and <0 antagonism. (B) Antileukemic synergy between ART838 and VEN against KOPN8 ALL, and ML2 and MV4;11 AML cell growth was validated by alamarBlue assays following 48-hour culture with ART838, VEN, or ART838 plus VEN.18,52,53 Data points represent means of 3 independent experiments performed with triplicate samples plus or minus SEM, normalized to vehicle (dimethyl sulfoxide [DMSO])-treated controls set to 1. Combination indices (CIs) were determined using CompuSyn software based on Chou-Talalay principles52,53 ; CI < 1 indicates synergy; CI = 1, additivity; CI > 1, antagonism. CI at each drug’s IC50 is shown in bold. (C) Percentage of viable cells was quantitated by flow cytometry after Annexin V/7AAD staining of KOPN8 ALL, ML2, and MV4;11 AML cells following short (18-hour) treatment with either DMSO (○; colored symbols are as shown in the key in panel A), ART838 (200 nM), VEN (50 nM), or ART838 (200 nM) plus VEN (50 nM), with and without preincubation with 10 nM pan-caspase inhibitor QVD.54 Data points represent the percentage of viable (Annexin V−/7AAD−) cells averaged from 3 independent experiments. Statistical comparisons were performed for combination treatments vs single-drug treatments, at each drug dose (B), or for drug treatment groups vs DMSO control (C). *P < .05; **P < .01; ***P < .001; no asterisk if P > .05.
In Chou-Talalay drug combination index (CI) synergy analyses of 48-hour alamarBlue assays,52,53 VEN and ART838 exhibited significant synergy at their IC50s (shown in bold in Figure 1B) against KOPN8 ALL (MLLr) and 2 MLLr AML cell lines: ML2 (harboring KMT2A-MLLT4) and MV4;11, neither tested in the synergy screen (Figure 1B). Significant synergy between VEN and AS was observed against MOLM14 AML and 5 other leukemia cell lines (supplemental Figure 3).
After 18-hour culture of KOPN8 ALL, ML2, or MV4;11 AML with VEN or ART838 alone, percentages of viable (Annexin−/7AAD−) cells were only slightly reduced; these drug concentrations and relatively short culture durations were used to avoid extensive cytolysis observed at later time points and with higher concentrations of single drugs. In contrast, parallel culture with the VEN plus ART838 combination resulted in significantly lower viable cell percentages with high levels of apoptotic/dead (Annexin+7AAD− and Annexin+7AAD+) cells (Figure 1C; supplemental Figure 4). Apoptotic cell death was blocked by pretreatment with pan-caspase inhibitor Q-VD-OPh (QVD) (Figure 1C).54 VEN similarly enhanced AS-induced apoptosis (supplemental Figure 5).
The SAV combination potently inhibited leukemia cell growth but spared normal HSPCs
Because we found previously that SOR synergized with artemisinins,18 we next tested the antileukemic activity of the SAV combination. In 48-hour alamarBlue assays with each drug at ∼25%, ∼50%, and ∼100% (shown in bold in Figure 2A) of its IC50 against MOLM14 and MV4;11 AML cells, SAV demonstrated synergistic CI values (Figure 2A).52,53 Similar results were observed testing KOPN8 ALL and ML2 AML cells (supplemental Figure 6). SAV induced ≥95% apoptosis in flow cytometric assays of the tested 3 leukemia cell lines and 6 primary AML/ALL cases. SAV was statistically superior to VEN plus SOR against MV4;11, MOLM14, AML45, and AML1526. Although SAV was not substantially superior to VEN plus SOR in all tested cell lines/primary cases, it is possible that the high efficacy of VEN plus SOR obscured the additional contribution of ART838 and/or the high spontaneous apoptosis of primary cells cultured ex vivo reduced the dynamic range of these assays (Figure 2B; supplemental Figure 7).
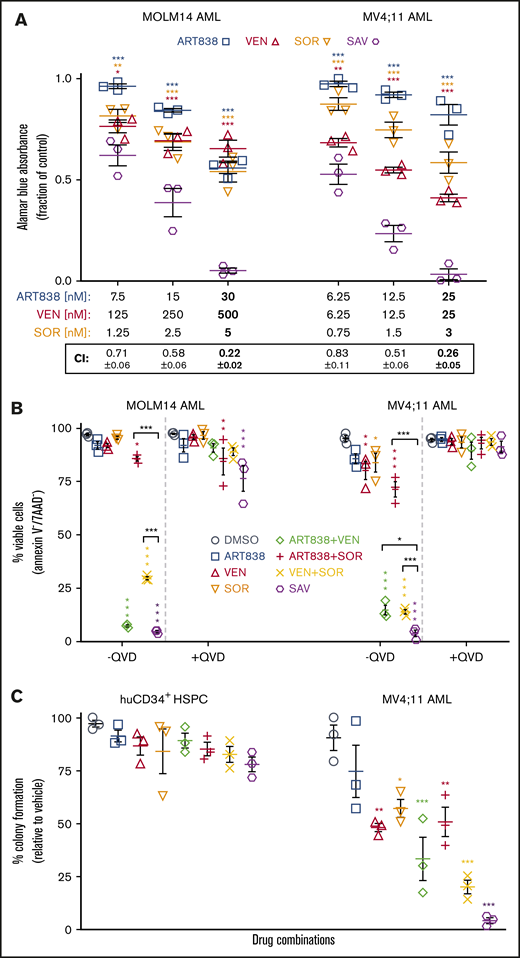
SOR, ART838, and VEN synergized to inhibit growth and stimulate apoptotic cell death of human AML cell lines, but spared normal human CD34+HSPCs. (A) MOLM14 and MV4;11 AML cells were cultured for 48 hours with ART838, VEN, SOR, or SAV using 3 sets of drug concentrations by using 2 twofold dilutions from the approximate IC50 of each drug (in bold) for each cell line.18,52,53 Graphs plot growth inhibition relative to DMSO, by alamarBlue assays (means of 3 experiments performed with triplicate samples plus or minus SEM). (B) Summary of 3 annexin V/7AAD flow cytometric experiments (mean plus or minus SEM) using MOLM14 and MV4;11 AML cells treated for 18 hours with DMSO, ART838 (200 nM), VEN (50 nM), SOR (5 μM), ART838 plus VEN, ART838 plus SOR, VEN plus SOR, or SAV, with or without QVD. Data points represent percentage of viable (Annexin V−/7AAD−) cells. (C) Colored symbols are as shown in the keys in panels A and B. Primary human CD34+ HSPCs, or MV4;11 AML cells were cultured with drug(s) for 24 hours, then diluted (>100-fold) and 100 to 500 cells plated in 1 mL of semisolid methylcellulose medium (H4434 for HSPCs and H4230 for MV4;11 AML cells; Stem Cell Technologies, Vancouver, Canada). Seven to 14 days later, total (erythroid plus nonerythroid for CD34+ HSPCs) colonies (≥20 cells) were enumerated.99 Graph summarizes means of 3 independent experiments with triplicate samples plus or minus SEM. Statistical comparisons were for groups cultured with SAV vs single drugs (A) or with each drug vs DMSO (B-D). *P < .05; **P < .01; ***P < .001; no asterisk if P > .05.
SOR, ART838, and VEN synergized to inhibit growth and stimulate apoptotic cell death of human AML cell lines, but spared normal human CD34+HSPCs. (A) MOLM14 and MV4;11 AML cells were cultured for 48 hours with ART838, VEN, SOR, or SAV using 3 sets of drug concentrations by using 2 twofold dilutions from the approximate IC50 of each drug (in bold) for each cell line.18,52,53 Graphs plot growth inhibition relative to DMSO, by alamarBlue assays (means of 3 experiments performed with triplicate samples plus or minus SEM). (B) Summary of 3 annexin V/7AAD flow cytometric experiments (mean plus or minus SEM) using MOLM14 and MV4;11 AML cells treated for 18 hours with DMSO, ART838 (200 nM), VEN (50 nM), SOR (5 μM), ART838 plus VEN, ART838 plus SOR, VEN plus SOR, or SAV, with or without QVD. Data points represent percentage of viable (Annexin V−/7AAD−) cells. (C) Colored symbols are as shown in the keys in panels A and B. Primary human CD34+ HSPCs, or MV4;11 AML cells were cultured with drug(s) for 24 hours, then diluted (>100-fold) and 100 to 500 cells plated in 1 mL of semisolid methylcellulose medium (H4434 for HSPCs and H4230 for MV4;11 AML cells; Stem Cell Technologies, Vancouver, Canada). Seven to 14 days later, total (erythroid plus nonerythroid for CD34+ HSPCs) colonies (≥20 cells) were enumerated.99 Graph summarizes means of 3 independent experiments with triplicate samples plus or minus SEM. Statistical comparisons were for groups cultured with SAV vs single drugs (A) or with each drug vs DMSO (B-D). *P < .05; **P < .01; ***P < .001; no asterisk if P > .05.
Artemisinins and SOR each reduced MCL1 protein levels, but by distinct mechanisms
Because artemisinins, including dihydroartemisinin (DHA), the active metabolite of several artemisinins, reduce MCL1 protein levels via the integrated stress response pathway55 in ALLs harboring BCR-ABL,20 we assessed whether ART838 (not metabolized to DHA18,34 ) reduced MCL1 in AML/ALL cell lines lacking BCR-ABL. To avoid nonspecific cell death–associated reduction of MCL1, we used drug concentrations and a short (18-hour) artemisinin exposure where >85% of cells remained viable (Figure 2B). AS, ART838, or SOR reduced MCL1 protein levels in MOLM14, MV4;11, ML2 AML, and KOPN8 ALL cell lines (Figure 3A; supplemental Figure 8). Specificity was observed, in that none of these drugs affected BCL2 or BCLxL protein levels, VEN increased MCL1 levels, and cytosine arabinoside (AraC; the most effective clinical drug against AML56,57 ) did not affect MCL1 levels. MCL1 mRNA levels were not changed by ART838 or AS (Figure 3B; supplemental Figure 9), and ART838 did not significantly alter MCL1 protein half-life in KOPN8 ALL or ML2 AML cells (supplemental Figure 10). Importantly, all of these leukemia cell lines are sensitive to the selective competitive MCL1 inhibitor S6384558 (IC50 range, 7-177 nM; supplemental Figure 1B), suggesting that reduction of MCL1 protein levels in these cells would similarly result in cell death.
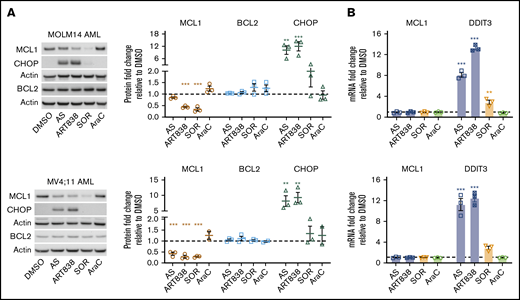
Artemisinins and SOR reduced MCL1 protein, and artemisinins elevated DDIT3/CHOP. MOLM14 and MV4;11 AML cells were incubated for 18 hours with DMSO, AS (10 μM), ART838 (200 nM), SOR (5 μM), or AraC (150 nM). (A) Western blotting was performed for MCL1 (brown circle), BCL2 (blue square), CHOP (green triangle), and housekeeping gene β-actin. Bar graphs summarize the relative fold-change of each protein level by densitometry in drug- vs DMSO-treated (represented by dotted line) cells; means of 3 independent experiments plus or minus SEM. (B) SYBR Green quantitative reverse transcription PCR was performed for MCL1 and DDIT3 mRNA. Cycle threshold values were normalized to housekeeping gene glyceraldehyde-3-phosphate dehydrogenase and fold-change relative to DMSO (represented by dotted line) was graphed; means of 3 independent experiments with triplicate samples plus or minus SEM. Statistical comparisons were performed for drug- vs vehicle (DMSO)-treated cells. *P < .05; **P < .01; ***P < .001; no asterisk if P > .05.
Artemisinins and SOR reduced MCL1 protein, and artemisinins elevated DDIT3/CHOP. MOLM14 and MV4;11 AML cells were incubated for 18 hours with DMSO, AS (10 μM), ART838 (200 nM), SOR (5 μM), or AraC (150 nM). (A) Western blotting was performed for MCL1 (brown circle), BCL2 (blue square), CHOP (green triangle), and housekeeping gene β-actin. Bar graphs summarize the relative fold-change of each protein level by densitometry in drug- vs DMSO-treated (represented by dotted line) cells; means of 3 independent experiments plus or minus SEM. (B) SYBR Green quantitative reverse transcription PCR was performed for MCL1 and DDIT3 mRNA. Cycle threshold values were normalized to housekeeping gene glyceraldehyde-3-phosphate dehydrogenase and fold-change relative to DMSO (represented by dotted line) was graphed; means of 3 independent experiments with triplicate samples plus or minus SEM. Statistical comparisons were performed for drug- vs vehicle (DMSO)-treated cells. *P < .05; **P < .01; ***P < .001; no asterisk if P > .05.
Culture of MOLM14 and MV4;11 AML cells with ART838 or AS, but not AraC, induced more than fivefold to 10-fold elevations in levels of the integrated stress-response protein CHOP (Figure 3A; supplemental Figure 8) and DDIT3 mRNA (GADD153 [encodes CHOP protein] Figure 3B). SOR caused only 1.3-fold to 3.6-fold increases in DDIT3/CHOP levels. In time-course experiments, DDIT3 mRNA levels were elevated in MV4;11 AML cells cultured for ≥4 hours with ART838 (supplemental Figure 11A). These in vitro observations translated to in vivo, with a twofold to fourfold increase in DDIT3 mRNA in cells harvested 6 to 8 hours after ART838 administration from heavily leukemia-infiltrated bone marrow and spleens of luc/YFP-labeled MV4;11-bearing mice (supplemental Figure 11B). In contrast, deoxyART838, which lacks endoperoxide pharmacophores,59,60 neither reduced MCL1 levels nor elevated CHOP levels (supplemental Figure 12). Additionally, levels of several other known MCL1-regulatory proteins, including translation initiation factor eIF4B,61 ubiquitin-associated protein FBXW7,62 and deubiquitinase USP13,63 were not altered by culture with any of these drugs (supplemental Figure 13A). GSK3β, another known regulator of MCL1,64 was not altered by ART838 or AS, whereas SOR treatment reduced the phosphorylated (inactive) form of GSK3β in MOLM14 AML cells (supplemental Figure 13B), consistent with previous reports.65 These results suggest that ART838 and SOR downregulate MCL1 protein levels mainly by distinct mechanisms.
ART838 was stable in plasma and microsomes
For in vivo preclinical and potential clinical use, we measured the stability of ART838 in human and mouse plasma and liver microsomes. Under all tested conditions, ART838 was degraded by ≤20% (supplemental Table 3).
ART838 MTD and pharmacokinetics in NRG mice
In pilot experiments in NRG mice, we determined the single-dose maximum tolerable dose (MTD) for ART838 as 250 mg/kg by mouth and the repeated dose MTD for ART838 as 50 mg/kg daily ×5 by mouth (supplemental Methods). Plasma concentrations of ART838 were >30 nM (the in vitro IC50 for ART838 against MOLM14) for ∼8 hours, suggesting that daily dosing is reasonable. Based on these results, we developed a tolerable 5-day on/9-day off cyclic SAV treatment dose schedule (Figure 4A).
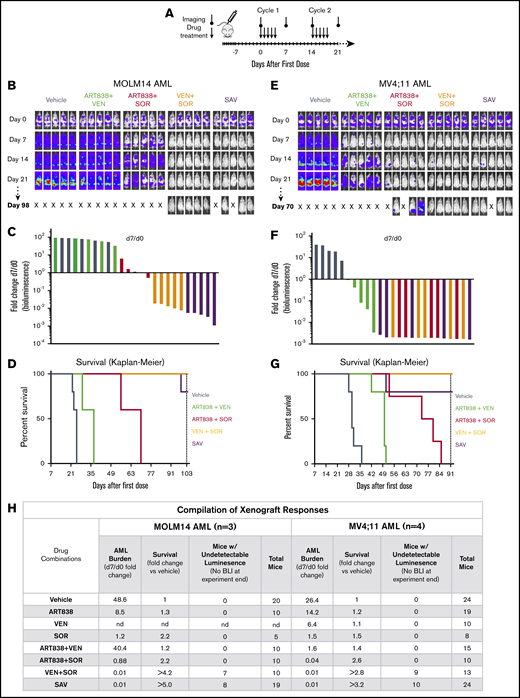
The VEN plus SOR and SAV combinations induced deep, long remissions in MOLM14 and MV4;11 AML xenografts. (A) Schedule for drug treatment and BLI. Drugs (50 mg/kg/d ART838, 150 mg/kg/d VEN, and/or 30 mg/kg/d SOR) were administered by mouth (via gavage) on this 5-day on/9-day off schedule for ≥5 identical 5-day treatment cycles. (B-D) NRG mice were transplanted IV with luc/YFP-labeled MOLM14 AML cells or (E-G) luc/YFP-labeled MV4;11 AML cells 10 days prior to initial BLI. Based on Xenogen quantification of baseline luminescence on day 0, mice were placed into experimental groups balanced for luminescence (5 mice per group), and drug treatment initiated. (B,E) BLI of each mouse for the initial 21 days and last imaging day (day 98 in panel B, day 70 in panel E of these 2 experiments involving AML xenograft-bearing mice treated with either vehicle, 2-drug, or SAV combinations). Luminescence intensity color coding was scaled to the same minimum and maximum across all individual experiments. (C,F) Waterfall plots representing fold-change in luminescence on day 7 vs day 0 for each mouse. (D,G) Kaplan-Meier survival curves. Experiments were terminated on day 103 for MOLM14 AML and day 91 for MV4;11 AML (vertical dotted line). One SAV mouse (D) and 1 ART838 plus SOR mouse (G) died unexpectedly with low AML burden and were censored. (D) Comparisons of vehicle vs ART838 plus VEN, vehicle vs ART838 plus SOR, vehicle vs VEN plus SOR, vehicle vs SAV, SAV vs ART838 plus VEN, SAV vs ART838 plus plus SOR all have P < .005. (G) Comparisons of vehicle vs ART838 plus VEN, vehicle vs ART838 plus SOR, vehicle vs VEN plus SOR, vehicle vs SAV, SAV vs ART838 plus VEN have P ≤ .005; SAV vs ART838 plus SOR all have P < .05. P values were calculated by log-rank (Mantel-Cox) test. (H) 3 similar MOLM14 AML and 4 similar MV4;11 AML xenograft treatment experiments were performed, and results summarized. Treatment response outcomes were: Leukemia response quantitation via fold change in AML burden (luminescence) on day 7 vs day 0 for each mouse (geometric means for each treatment group were averaged across all experiments); survival (fold change in median survival vs vehicle; fold changes were averaged for each treatment group across all experiments). In the survival columns, > indicates that groups contained mice with no detectable luminescence (above background, 5.7 × 10⁵ photons per mouse based on intensity values from nonleukemia-bearing mice) on the last BLI done in the experiment. In the aggregated results of all experiments using the MOLM14 AML model, 7 mice (70%) had no detectable luminescence (above background) after treatment with VEN plus SOR and 8 mice (42%) with SAV (at 42-101 days after treatment completion). In the aggregated results of all experiments using the MV4;11 AML model, 9 mice (69%) had no detectable luminescence (above background) after treatment with VEN plus SOR and 10 mice (42%) with SAV (at 9-45 days after treatment completion). Inverse association between the fold-change (day 7/d 0) in AML burden and the fold-change in median survival relative to vehicle for MOLM14 or MV4;11 AML were calculated using the Spearman rank correlation coefficient. nd, not done; “X”, mouse death.
The VEN plus SOR and SAV combinations induced deep, long remissions in MOLM14 and MV4;11 AML xenografts. (A) Schedule for drug treatment and BLI. Drugs (50 mg/kg/d ART838, 150 mg/kg/d VEN, and/or 30 mg/kg/d SOR) were administered by mouth (via gavage) on this 5-day on/9-day off schedule for ≥5 identical 5-day treatment cycles. (B-D) NRG mice were transplanted IV with luc/YFP-labeled MOLM14 AML cells or (E-G) luc/YFP-labeled MV4;11 AML cells 10 days prior to initial BLI. Based on Xenogen quantification of baseline luminescence on day 0, mice were placed into experimental groups balanced for luminescence (5 mice per group), and drug treatment initiated. (B,E) BLI of each mouse for the initial 21 days and last imaging day (day 98 in panel B, day 70 in panel E of these 2 experiments involving AML xenograft-bearing mice treated with either vehicle, 2-drug, or SAV combinations). Luminescence intensity color coding was scaled to the same minimum and maximum across all individual experiments. (C,F) Waterfall plots representing fold-change in luminescence on day 7 vs day 0 for each mouse. (D,G) Kaplan-Meier survival curves. Experiments were terminated on day 103 for MOLM14 AML and day 91 for MV4;11 AML (vertical dotted line). One SAV mouse (D) and 1 ART838 plus SOR mouse (G) died unexpectedly with low AML burden and were censored. (D) Comparisons of vehicle vs ART838 plus VEN, vehicle vs ART838 plus SOR, vehicle vs VEN plus SOR, vehicle vs SAV, SAV vs ART838 plus VEN, SAV vs ART838 plus plus SOR all have P < .005. (G) Comparisons of vehicle vs ART838 plus VEN, vehicle vs ART838 plus SOR, vehicle vs VEN plus SOR, vehicle vs SAV, SAV vs ART838 plus VEN have P ≤ .005; SAV vs ART838 plus SOR all have P < .05. P values were calculated by log-rank (Mantel-Cox) test. (H) 3 similar MOLM14 AML and 4 similar MV4;11 AML xenograft treatment experiments were performed, and results summarized. Treatment response outcomes were: Leukemia response quantitation via fold change in AML burden (luminescence) on day 7 vs day 0 for each mouse (geometric means for each treatment group were averaged across all experiments); survival (fold change in median survival vs vehicle; fold changes were averaged for each treatment group across all experiments). In the survival columns, > indicates that groups contained mice with no detectable luminescence (above background, 5.7 × 10⁵ photons per mouse based on intensity values from nonleukemia-bearing mice) on the last BLI done in the experiment. In the aggregated results of all experiments using the MOLM14 AML model, 7 mice (70%) had no detectable luminescence (above background) after treatment with VEN plus SOR and 8 mice (42%) with SAV (at 42-101 days after treatment completion). In the aggregated results of all experiments using the MV4;11 AML model, 9 mice (69%) had no detectable luminescence (above background) after treatment with VEN plus SOR and 10 mice (42%) with SAV (at 9-45 days after treatment completion). Inverse association between the fold-change (day 7/d 0) in AML burden and the fold-change in median survival relative to vehicle for MOLM14 or MV4;11 AML were calculated using the Spearman rank correlation coefficient. nd, not done; “X”, mouse death.
In vivo SAV, or SOR plus VEN, treatment of MOLM14 and MV4;11 AML xenograft models resulted in deep responses and extended survivals
Novel drugs and combinations initially developed via in vitro experiments require in vivo evaluation to better model patient treatment. In several experiments, we treated NRG mice bearing luc/YFP-labeled MOLM14 or MV4;11 AML xenografts with ≥5 cycles of ART838, VEN, and/or SOR. As compared with treatment with vehicle, monotherapy with either SOR, ART838, or VEN slowed the increase in AML burden at day 7 (taken as time point of near-maximal response to the first treatment cycle). However, none of the monotherapies reduced day 7 MOLM14 or MV4;11 AML burden to levels substantially below day 0 luminescence. These results were confirmed at day 14, the earliest time when NRG mice can tolerate a second treatment cycle (supplemental Figures 15A-C and 16B-D, visualized best in the waterfall plots and line graphs). Consistent with these observations, Kaplan-Meier survival curves of MOLM14 or MV4;11 AML xenograft-bearing mice administered the 3 monotherapies were not markedly longer than for vehicle-treated mice in these experiments involving mice with substantial initial AML burdens (supplemental Figures 15 and 16).
Supplemental Figures 15A and 16A provide direct comparisons of results of the SAV regimen vs each of the 2-drug combinations against MOLM14 and MV4;11 AML xenografts, respectively; for convenience, the most relevant data are also shown in Figure 4, panels B-D and E-G. SAV treatment of MOLM14 xenografts resulted in the greatest fold reduction of day 7 AML burden, followed by VEN plus SOR, ART838 plus SOR, and ART838 plus VEN; day 7 AML burden was 83- and 250-fold reduced from day 0 by VEN plus SOR and SAV, respectively (Figure 4B-C). Assessments at subsequent time points confirmed the day 7–based rank order of AML burden reductions following SAV or the 2-drug combinations (supplemental Figure 15A). Survival was fourfold increased for both SAV and VEN plus SOR compared with vehicle (Figure 4D). All 5 mice from the VEN plus SOR group and 3 of 5 (1 mouse censored due to death with low AML burden) from the SAV group had undetectable AML burdens on day 103 (treatment ended on day 60; supplemental Figure 15A).
Similar results were observed in the MV4;11 AML xenograft model (Figure 4E-G; supplemental Figure 16A). Treatment with SAV or each of the 2-drug combinations substantially reduced day 7 AML burdens (Figure 4E-F). VEN plus SOR and SAV extended survival by threefold over vehicle (Figure 4G). All 5 mice from the VEN plus SOR group and 4 of 5 from the SAV group had undetectable AML burdens at experiment termination on day 91 (treatment completed on day 60; supplemental Figure 16A). These interpretations, summarized in Figure 4H, were confirmed by statistical analysis of all experiments in supplemental Figures 15 and 16, (not dependent on censoring of mice that died with low AML burdens). There was a highly significant inverse association between day 7/day 0 fold-change in AML burden and fold-change in survival relative to vehicle for MOLM14 (Spearman rank correlation coefficient, Rs = −0.98; P < .0001) and MV4;11 AML xenografts (Rs = −0.97; P < .0001). Because VEN plus SOR was highly effective against both these xenograft models, these models could not definitively ascertain the contribution of ART838 in SAV.
Treatment regimens were tolerated by NRG mice
AML-bearing mice tolerated all treatment regimens without adverse clinical signs or treatment-limiting weight loss (<20%), and there were few unexpected deaths of mice with AML burdens undetectable or lower than on day 0 (censored in Figure 4). Blood cell counts were not significantly reduced in non–AML-bearing mice treated in parallel (supplemental Figure 17).
SAV treatment slowed growth of 2 AML primagraft models
Each of the single drugs and combinations slowed the increase in AML burden over time vs vehicle using the luc/YFP-labeled human AML45 primagraft model,66 but day 7 AML burden was reduced to below day 0 in only the SAV group and 1 of the ART838 plus VEN mice (Figure 5A-B; supplemental Figure 18A). All mice had AML burdens exceeding day 0 at all subsequent time points (supplemental Figure 18A). The SAV group had the longest survival (Figure 5C; twofold over vehicle). Figure 5G summarizes this and an additional experiment (supplemental Figure 18B) evaluating AML45 primagrafts. SAV was the most active regimen against AML45 primagrafts, and ART838 plus VEN was next best combination.
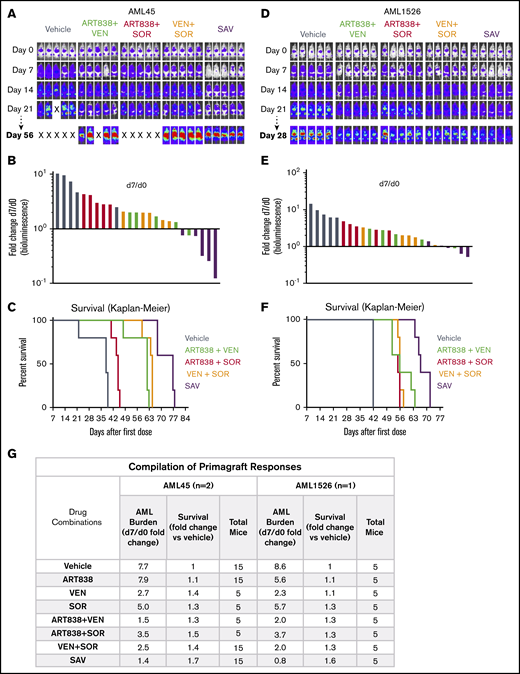
SAV inhibited growth of 2 AML primagrafts. NRG mice bearing luc/YFP-labeled AML45 (A-C) and AML1526 (D-F) primagrafts were performed and data analyzed as in Figure 3. (A,D) BLI of each mouse at each time point in 1 experiment each with AML45 primagraft or AML1526 primagraft model, respectively. (B,E) Waterfall plots depict fold-change in luminescence on day 7 vs day 0 for each mouse, for primagraft experiments using AML45 and AML1526, respectively. (C,F) Kaplan-Meier survival plots for primagraft experiments using AML45 and AML1526, respectively. (C) Comparisons of vehicle vs ART838 plus VEN, vehicle vs ART838 plus SOR, vehicle vs VEN plus SOR, vehicle vs SAV, SAV vs ART838 plus VEN, SAV vs ART838 plus SOR, SAV vs VEN plus SOR all have P < .005. (F) Comparisons of vehicle vs ART838 plus VEN, vehicle vs ART838 plus SOR, vehicle vs VEN plus SOR, vehicle vs SAV, SAV vs ART838 plus VEN, SAV vs ART838 plus SOR, SAV vs VEN plus SOR all have P < .005, by log-rank (Mantel-Cox) test. (G) Aggregated results of 2 AML45 primagraft experiments and 1 AML1526 experiment are summarized. Inverse association between the fold-change (day 7/d 0) in AML burden and fold-change in median survival relative to vehicle for both AML45 and AML1526 were calculated using the Spearman rank correlation coefficient. nd, not done; “X”, mouse death.
SAV inhibited growth of 2 AML primagrafts. NRG mice bearing luc/YFP-labeled AML45 (A-C) and AML1526 (D-F) primagrafts were performed and data analyzed as in Figure 3. (A,D) BLI of each mouse at each time point in 1 experiment each with AML45 primagraft or AML1526 primagraft model, respectively. (B,E) Waterfall plots depict fold-change in luminescence on day 7 vs day 0 for each mouse, for primagraft experiments using AML45 and AML1526, respectively. (C,F) Kaplan-Meier survival plots for primagraft experiments using AML45 and AML1526, respectively. (C) Comparisons of vehicle vs ART838 plus VEN, vehicle vs ART838 plus SOR, vehicle vs VEN plus SOR, vehicle vs SAV, SAV vs ART838 plus VEN, SAV vs ART838 plus SOR, SAV vs VEN plus SOR all have P < .005. (F) Comparisons of vehicle vs ART838 plus VEN, vehicle vs ART838 plus SOR, vehicle vs VEN plus SOR, vehicle vs SAV, SAV vs ART838 plus VEN, SAV vs ART838 plus SOR, SAV vs VEN plus SOR all have P < .005, by log-rank (Mantel-Cox) test. (G) Aggregated results of 2 AML45 primagraft experiments and 1 AML1526 experiment are summarized. Inverse association between the fold-change (day 7/d 0) in AML burden and fold-change in median survival relative to vehicle for both AML45 and AML1526 were calculated using the Spearman rank correlation coefficient. nd, not done; “X”, mouse death.
Similar results were obtained in our luc/YFP-AML1526 primagraft model, with SAV the most effective regimen (survival extended 1.6-fold over vehicle; supplemental Figure 19; Figure 5D-G). VEN plus SOR and ART838 plus VEN had modest effects on AML1526 burden and survival, and ART838 plus SOR was the least active combination.
As with the xenograft models, there was a significant inverse association between the day 7/day 0 fold-change in AML burden and survival for AML45 (Spearman rank correlation coefficient, Rs = −0.71; P = .048) and AML1526 primagrafts (Rs = −0.71; P = .050).
Discussion
Artemisinins are cytotoxic to many acute leukemia cell lines,18-20,23,25 suggesting that the potent ART838 analog, which we found to have favorable stability and pharmacokinetics, might serve as a component of leukemia treatment regimens. From our previous report that 3 tested kinase inhibitors (midostaurin, lestaurtinib, and SOR) each synergized with artemisinins,18 we chose to combine ART838 with SOR because SOR is a potent inhibitor of the FLT3-ITD mutation common in AML and also inhibits several other kinases (eg, KIT, PDGFR, VEGFR) that may be mutated or overexpressed to drive acute leukemias.67,68 Moreover, SOR is approved by the US Food and Drug Administration (FDA), has modest toxicity,69 and is an effective addition to standard clinical AML treatment regimens.70,71 In this project, our goals were to identify an additional antileukemic drug that might be combined synergistically with SOR and ART838, and then to begin to evaluate this empirically derived 3-drug regimen for efficacy, mechanism, and tolerability, focusing on poor-prognosis AMLs harboring FLT3-ITD and/or MLLr mutations.72,73
Our screen of a library of targeted antineoplastics37-43 revealed that both BCL2 inhibitors in the drug library, ABT737 and VEN, synergized strongly with ART838 (and AS). In vitro culture with ART838 plus VEN robustly reduced growth and enhanced apoptotic cell death of several human acute leukemia cell lines (5 AMLs, 2 ALLs) and primary acute leukemia samples (5 AMLs, 1 ALL), validating the results of the screen. Previous studies indicated that artemisinins induced high cellular levels of reactive oxygen species (ROS), triggered proapoptotic signaling,18,30,74,76 and altered expression of BCL2 family members in several cancer types.77-79 Notably, a recent study aimed at identifying drugs that synergize with the dual BCL2/BCLxL inhibitor, NAV, against poor-prognosis B-precursor ALLs harboring the BCR-ABL translocation, found that DHA synergized strongly.20 Thus, both this and our own validated screen identified that artemisinins and inhibitors of BCL2 family members synergize against at least some acute leukemias, and our results extended this synergy beyond BCR-ABL+ ALLs. Because NAV induced thrombocytopenia in clinical trials,51,80 we focused on the selective BCL2 inhibitor, VEN. Clinical trials of VEN as a single agent document an encouraging response frequency in AML, but responses were typically only partial and transient.11 VEN combined with azacytidine or decitabine showed efficacy and low toxicity, which led to FDA approval of VEN-based combination regimens for frail senior patients, poor candidates for standard intensive AraC/anthracycline induction chemotherapy.81 Finally, SOR and VEN synergize against AML cell lines and patient samples in vitro.82
Further understanding of ART838’s mechanism(s) of action might explain its empiric synergies with SOR and VEN and suggest additional drugs that might cooperate. All artemisinins contain an endoperoxide pharmacophore(s), which upon activation by iron, induces high levels of intracellular ROS, necessary for artemisinins’ antimalarial and antileukemic activities.30,74-76,83 High-level ROS evokes integrated stress response,20,84,85 cell-cycle arrest,18,86 and lysosomal disruption.87 We assessed several proteins previously shown to regulate MCL1 protein; none were altered by ART838 exposure. Additionally, we inhibited mRNA translation, which did not significantly alter MCL1 protein abundance in the presence of ART838. This experiment takes into account only protein half-life; it does not rule out the possible modulation of MCL1 protein translation via reduced phosphorylated eIF4B.88 We confirmed and extended the observation that artemisinins induce the integrated stress response, which increases DDIT3/CHOP mRNA/protein and reduces MCL1 protein levels in multiple subtypes of acute leukemia cells in vitro and in vivo,20 suggesting that MCL1 protein and DDIT3/CHOP levels may serve as useful biomarkers of the antileukemic action of ART838 and SAV. Indirect reduction of MCL1 by artemisinins might explain their broad antineoplastic activity and their synergy with inhibitors of BCL2 and BCLxL. Furthermore, SOR has been reported to indirectly reduce MCL1 protein stability by increasing its ubiquitination via GSK3β activation,89 consistent with our finding that SOR reduced the phosphorylated (inactive) form of GSK3β. Because SOR caused only minor elevations of DDIT3/CHOP in acute leukemia cells, ART838 and SOR appear to reduce MCL1 protein predominantly by distinct mechanisms; their combined targeting of MCL1 by discrete pathways may explain their antileukemic synergy.
The SAV combination reduced growth and enhanced apoptotic cell death of all tested leukemia cell lines (3 AMLs, 1 ALL) and primary patient samples (5 AMLs, 1 ALL) in vitro, although the extent of drug synergy may have been obscured in these assays by the high efficacy of 1 to 2 of the 3 drugs or by the high spontaneous ex vivo death rates of some of the primary patient AML cases. For these and other reasons, in vivo evaluations may better model clinical trials. For example, despite their in vitro activity as single drugs in this and previous studies, none of these monotherapies substantially reduced AML burdens in our experiments using 4 AML xenograft/primagraft models. Perhaps we would have detected greater in vivo responses had we used an AML progression model in which the xenograft/primagraft-bearing mice were treated before they had large AML burdens; thereby, we and others have documented the single-agent activity of artemisinin analogs.18,25 In this project, we chose instead to use more challenging in vivo models in an attempt to reveal the potential clinical impact of the drug combinations. In contrast to single drugs, SAV was significantly active against all 4 AML xenograft/primagraft models, causing deep responses in the MOLM14 and MV4;11 AML xenograft models at day 7, which persisted for months during and after treatment completion, without substantial reductions in mouse complete blood counts or body weights. Several mice had undetectable leukemia-based luminescence at the final imaging done in these experiments. Against MOLM14 and MV4;11 AML xenografts, VEN plus SOR was approximately as active as SAV, and much more active than the other 2-drug combinations. The potency of VEN plus SOR may have obscured recognition of the contribution of ART838 in SAV using these 2 xenograft models.
Despite their in vitro sensitivity, the 2 AML primagraft models, both derived from older adults with relapsed, refractory AMLs, were much less sensitive to all tested drug combinations than the MOLM14 and MV4;11 AML xenografts (both derived from young patients harboring FLT3-ITD and MLLr). Notably, SAV was the most active combination against the AML45 primagraft, reducing day 7 AML burdens below day 0 levels, and the ART838 plus VEN combination was the next most effective combination. SAV was also the most active combination against the AML1526 primagraft model, although it only slowed leukemia growth. Thus, these in vivo results in the 2 AML primagraft models confirmed the observed in vitro synergism among the SAV drugs and the contribution of ART838 to the SAV combination.
In the future, newer kinase inhibitors (eg, gilteritinib) might be investigated for combination with ART838 and VEN, especially for cases harboring FLT3 kinase domain mutations (not inhibited by SOR).90,91 Combination of ART838 and VEN with hypomethylating agents might also be investigated because combinations of VEN with azacytidine or decitabine are clinically active and tolerable. Although cardiotoxicity has been observed in clinical trials of MCL1-competitive inhibitors (eg, NCT03465540),92 CDK9 inhibitors (eg, voruciclib, alvocidib, or AZD4573) might synergize with SAV to further reduce MCL1 because CDK9 inhibition reduces MCL1 transcription, whereas ART838 and SOR each reduce MCL1 via posttranscriptional mechanisms.93-95 Finally, AMLs might resist SAV based on high levels of BCLxL,96 and therefore selective BCLxL inhibitors or dual BCL2/BCLxL inhibitors (eg, NAV) might be evaluated for use in combination with SAV, although their clinical use would require close attention to platelet counts.97,98
In summary, our findings, especially the impressive outcomes of SAV in the MLLr+FLT3+ MOLM14 and MV4;11 AML xenograft models and the cooperativity of the SAV drugs in the AML primagraft models, demonstrate that ART838 and the SAV combination warrant consideration for clinical development for acute leukemias. In parallel, we suggest preclinical evaluation of additional acute leukemia cell line xenografts and primagrafts, especially those containing FLT3-ITD and/or MLLr driver mutations, as well as exploration of the herein-described modifications of the SAV regimen.
Any raw data not provided may be requested via the corresponding author, Curt I. Civin, at ccivin@som.umaryland.edu.
Acknowledgments
The authors thank the following students who participated in this research during their medical education at the University of Maryland School of Medicine: Kalyani Kumar, Taylor Rosenbaum, Allison Durham, Sang Tran, and Adam Ketchum. The luc/YFP-expressing MV4,11 AML cell line72 was the kind gift of Sharyn Baker and the St. Jude Children’s Research Hospital Viral Vector Core (Memphis, TN). Unlabeled primary AML45 and AML1526 cells were kindly provided by Martin Carroll and Alexander Perl (University of Pennsylvania, Philadelphia, PA).
This work was supported in part by awards from the Emmert Hobbs Foundation Endowment (B.S.M.); the National Foundation for Cancer Research (C.I.C.); the Maryland Industrial Partnership (#MIPS-6502 and #MIPS-1801) (C.I.C.); the Maryland Innovation Initiative (#2018-MII-4916) (C.I.C.), the Leukemia & Lymphoma Society (TRP-10335016) (C.I.C.); the National Institutes of Health: T32CA154274 (B.S.M.), P30CA134274 (C.I.C., A.E., S.M.B., R.G.L., T.J.K., and M.K.), and P30CA006973 (M.A.R.) from the National Cancer Institute, UL1TR001079 (M.A.R.) from the National Center For Advancing Translational Sciences, S10RR026824 (M.A.R.) from the National Center for Research Resources, and R01CA183947 (J.W.T.), U01CA217862 (J.W.T.), and U54CA224019 (J.W.T.) from the National Cancer Institute; the V Foundation for Cancer Research (J.W.T.); Gabrielle’s Angel Foundation for Cancer Research (J.W.T.); the Silver Family Foundation (J.W.T.); and the Mark Foundation for Cancer Research (J.W.T.).
The contents are solely the responsibility of the authors and do not necessarily represent the official view of the funding sources.
Authorship
Contribution: C.I.C. supervised all areas of the study; C.I.C., B.S.M., and M.A.R. designed experiments and developed methodology; C.I.C., B.S.M., T.J.K., and M.A.R. analyzed and interpreted data; B.S.M., S.M., and J.M.F. performed in vitro studies with cell lines and primary cells; B.S.M. carried out in vivo experiments under an approved institutional animal care and use committee protocol; M.A.R. supervised and analyzed stability and pharmacokinetics experiments; B.S.M., C.I.C., M.K., and T.J.K. wrote, reviewed, and revised the first and subsequent drafts of the manuscript; A.E. and R.G.L. provided the luciferase-labeled primary leukemia cells; J.W.T. provided the library of targeted antineoplastics; B.T.M. guided ART838 synthesis; S.M.B. and B.S.M. performed statistical analyses; and all authors reviewed and critically edited the manuscript.
Conflict-of-interest disclosure: J.W.T. has received research support from Agios, Aptose, Array, AstraZeneca, Constellation, Genentech, Gilead, Incyte, Janssen, Petra, Seattle Genetics, Syros, and Takeda. J.M.F. is a current employee of AstraZeneca and owns stock in the company. A.E. has received research grants from Jazz Pharmaceuticals, NewLink Genetics and Servier; is a global oncology advisory board member for Amgen; has served as an advisory board member for Genentech and Servier; and is a Co-Founder and Scientific Advisor for KinaRx, Inc. M.A.R. has received research grants to her institution from Celgene Corporation, Cullinan Apollo, and RenovoRx and institutional support for clinical trials conduct from Taiho; M.A.R.’s spouse is employed by GlaxoSmithKline. C.I.C. is chairman of the scientific advisory board for GPB Scientific, Inc. and owns stock in the company. The remaining authors declare no competing financial interests.
The current affiliation for B.S.M. is Jacobio (US) Pharmaceuticals Inc., Lexington, MA.
The current affiliation for S.M. is Arcellx Inc., Gaithersburg, MD.
The current affiliation for J.M.F. is AstraZeneca, Gaithersburg, MD.
Correspondence: Curt I. Civin, University of Maryland School of Medicine, BRB 14-021, 655 W Baltimore St, Baltimore, MD 21201; e-mail: ccivin@som.umaryland.edu.

