Key Points
Loss of Tgfb1 expression in MKs increases MK production in BM and TPO expression in the liver.
Inhibition of TGF-β1 might increase MK generation in vivo and in vitro.
Abstract
Transforming growth factor β1 (TGF-β1) regulates a wide variety of events in adult bone marrow (BM), including quiescence of hematopoietic stem cells, via undefined mechanisms. Because megakaryocytes (MKs)/platelets are a rich source of TGF-β1, we assessed whether TGF-β1 might inhibit its own production by comparing mice with conditional inactivation of Tgfb1 in MKs (PF4Cre;Tgfb1flox/flox) and control mice. PF4Cre;Tgfb1flox/flox mice had ∼30% more MKs in BM and ∼15% more circulating platelets than control mice (P < .001). Thrombopoietin (TPO) levels in plasma and TPO expression in liver were approximately twofold higher in PF4Cre;Tgfb1flox/flox than in control mice (P < .01), whereas TPO expression in BM cells was similar between these mice. In BM cell culture, TPO treatment increased the number of MKs from wild-type mice by approximately threefold, which increased approximately twofold further in the presence of a TGF-β1–neutralizing antibody and increased the number of MKs from PF4Cre;Tgfb1flox/flox mice approximately fourfold. Our data reveal a new role for TGF-β1 produced by MKs/platelets in regulating its own production in BM via increased TPO production in the liver. Additional studies are required to determine the mechanism.
Introduction
Platelets support primary hemostasis1 and are produced by megakaryocytes (MKs) via a complex process.2,3 Although found in other organs, MKs are primarily generated in bone marrow (BM) of adults from hematopoietic stem cells (HSCs) by a process called megakaryopoiesis, which is primarily regulated by the cytokine thrombopoietin (TPO).4,5 TPO messenger RNA (mRNA) is detected in many cells, but TPO is mainly secreted by hepatocytes. TPO binds the cell-surface receptor c-Mpl, which is required for HSCs commitment to the MK lineage.6
Transforming growth factor β1 (TGF-β1) is a multifunctional growth factor/cytokine that has a profound regulatory effect on developmental and physiological processes.7 TGF-β1 regulates a remarkable diversity of cellular functions, including cell growth, proliferation, differentiation, apoptosis, and fibrosis.8 TGF-β1 is a master regulator of hematopoiesis by controlling self-renewal and quiescence of HSCs.9 In vitro, TGF-β1 has been used to differentiate HSCs into different lineages, including MKs, in accordance with other growth factors.10 Like the propagation of other hematopoietic lineage–derived cells, TGF-β1 inhibits the proliferation of MKs isolated from BM and megakaryocytic cell lines.11 We recently showed that MK/platelet-derived TGF-β1 plays an important role in HSC quiescence by demonstrating that mice lacking TGF-β1 in MKs (PF4Cre;Tgfb1flox/flox) have higher hematopoiesis, resulting in greater numbers of white blood cells.12 TGF-β1 has also been shown to induce TPO expression in BM stromal cells,10 and it is thought that stromal cell–derived TPO might regulate megakaryopoiesis in BM. However, the source of TPO and the factors that regulate its production are unclear.
Because platelets are a rich source of TGF-β1 that contribute ∼50% of plasma TGF-β1,13 in this study we investigated the hypothesis that MK/platelet-derived TGF-β1 inhibits megakaryopoiesis in BM by regulating TPO production in the liver in mice.
Methods
For detailed methods, please see the data supplement.
Mice
Wild-type (WT) C57BL/6J mice were obtained from The Jackson Laboratory or bred in house and served as controls. Mice with MK-specific inactivation of the Tgfb1 gene (PF4Cre;Tgfb1flox/flox) were generated, as described previously13,14 ; these mice have 95% less TGF-β1 in platelets and 50% less TGF-β1 in plasma compared with normal levels but no other apparent abnormalities, and they are born with normal Mendelian ratios and live normal lives. Mouse studies were approved by the Oklahoma Medical Research Foundation Institutional Animal Care and Use Committee.
MK quantification in BM section and smear
Femur and tibia bone samples harvested from C57BL/6, Tgfb1flox/flox, and PF4Cre;Tgfb1flox/flox mice age 10 to 20 weeks (both male and female) were fixed for 48 hours in 4% paraformaldehyde. Bones were then decalcified in a solution of 10% EDTA in phosphate-buffered saline at a pH of 7.2 for 2 weeks at 4°C. Bones were then embedded in paraffin, and 4- to 8-μm sections were stained with standard hematoxylin and eosin (H&E) for histology. H&E-stained slides were scanned using an Aperio CS2 ScanScope slide scanner, and MK numbers were counted manually using ImageScope version VI (Aperio Technologies). Detailed methods are described in the data supplement and in supplemental Figure 1A.
BM was flushed from the femur and tibia bones by cutting the tips of the bones and placing each bone in a 0.5-mL microfuge tube with a hole in the bottom using a 25-gauge needle. The bone was positioned with the trimmed bone tip directed to the hole in the tube, which was then placed in a 1.5-mL tube and subsequently centrifuged at 500g for 15 to 30 seconds in 4°C, translocating the BM from the bones to accumulate in the 1.5-mL tube. BM was then used to create a smear on a slide, fixed for 5 minutes in methanol, air dried, and stained with H&E. MK numbers were counted as described in detail in the data supplement and as shown in supplemental Figure 1B.
Flow cytometric analysis of BM and in vitro culture cells
BM cells collected from mouse femur and tibia or after 5 days of in vitro culture and were fixed with fixation buffer (catalog #00-8222-49; eBioscience) and labeled with fluorescent-tagged antibodies against mouse CD41 (catalog #133917; BioLegend) or CD42d (catalog #12-0421-82; Invitrogen); Hoechst 33342 (10 μg/mL) was added for nucleus staining. The fluorescent signals from the stained cells were recorded using the LSR-II or Celesta Flow Cytometer (BD Biosciences), and data were analyzed using BD FACSDiva software.
Fluorescence microscopy
The sources of all antibodies, including secondary antibodies and their fluorescent conjugations, are listed in supplemental Table 1. Paraffin-embedded bones were cut into 4- to 8-μm thick sections in the middle. For immunofluorescence staining, sections were deparaffinized and rehydrated, followed by heating at 97°C for epitope retrieval, and then incubated with blocking buffer for 1 hour and again overnight with primary antibodies at final concentrations of 0.5 μg/mL at 4°C. After washing and incubation with a fluorescent secondary antibody at room temperature for 2 hours and mounting with a fluorescence mounting medium containing 4′,6-diamidino-2-phenylindole to stain nuclei, images were photographed using either a Zeiss 710 Confocal or Nikon Eclipse 80i fluorescence microscope. Images were quantified by Imaris software.
TGF-β1 and TPO assays in plasma and BM cell exudates
Blood was drawn from mice into tubes containing 0.1 volume of 3.8% citrate, and plasma was prepared following our published method to minimize in vitro release of TGF-β1 from platelets.13,15 BM exudates were prepared by flushing BM and dispersing in phosphate-buffered saline for 30 minutes at 4°C followed by centrifugation at 13 000g for 5 minutes. The immunological enzyme-linked immunosorbent assay (ELISA; R&D Systems) was applied as follows: total TGF-β1 (active plus latent) was measured after pretreating the samples with 0.2 volume of 1 N hydrochloric acid for 20 minutes at room temperature to convert the latent TGF-β1 to active TGF-β1. TPO levels in plasma were measured by ELISA (R&D Systems).
Quantitative reverse transcription PCR
Total RNA was extracted from liver tissue or BM cells using a commercial RNA extraction kit (catalog #74104; RNeasy Mini Kit; Qiagen). Approximately 1 μg of RNA was reverse transcribed into complementary DNA using the High-Capacity RNA-to-cDNA Reagent Mix (catalog #4387406; Applied Biosystems; Thermo Fisher Scientific). Quantitative polymerase chain reaction (PCR) was performed using the AzuraQuant Green Fast qPCR LoROX Master Mix reagent containing primer sets for mouse TPO or β-actin with a Bio-Rad real-time PCR system (CFX96).
Preparation of in vitro MK culture
BM from C57Bl/6 or PF4Cre;Tgfb1flox/flox mice was flushed, and red blood cells were lysed under sterile conditions and grown in Dulbecco’s modified Eagle medium containing 10% fetal bovine serum with antibiotics for 4 to 5 days with and without 200 ng/mL TPO (PeproTech). In some cases, an anti–TGF-β1–neutralizing antibody was used along with TPO. After 2 days of culture, the medium was replaced with fresh medium supplementing TPO. Pictures of the culture were taken with an inverted light microscope and stained with immunofluorescence for flow cytometric analysis. Ploidy of MKs was evaluated after gating CD41+ cells and quantifying the percentage of Hoechst 33342 positivity.
Statistical analyses
Statistical analyses were performed using GraphPad Prism 8.3.0 software. Data are expressed as means ± standard deviation, with the significance of differences calculated by Student t test.
Results
PF4Cre;Tgfb1flox/flox mice lacking TGF-β1 in MKs/platelets have more MKs and circulating platelets than WT or littermate control mice
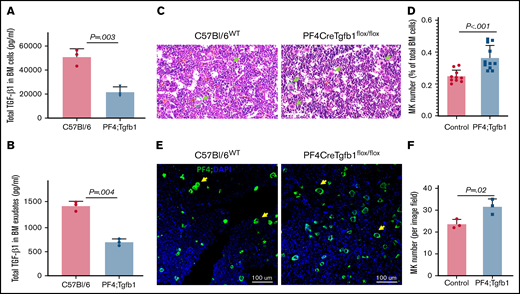
Because TGF-β1 maintains the quiescence of HSCs in BM,12 we assessed whether MK/platelet-derived TGF-β1 regulates megakaryopoiesis in BM by first examining the contribution of MKs/platelets at the TGF-β1 level in BM. We found that, compared with WT control mice, PF4Cre;Tgfb1flox/flox mice had only ∼40% of total TGF-β1 levels in BM cells (22 ± 4.2 vs 51 ± 6.9 ng/mL; P = .003) and ∼50% of soluble TGF-β1 in BM exudates (0.68 ± 0.068 vs 1.4 ± 0.097; P = .004; n = 3; Figure 1A-B). Active TGF-β1 was undetectable by ELISA in the BM from either mouse strain.
Conditional inactivation of Tgfb1 in MKs in mice decreases TGF-β1 levels to ∼50% and increases MK number by ∼30% in BM. (A) BM from the femur and tibia was flushed, cells were lysed with lysis buffer, and TGF-β1 was measured by ELISA. (B) BM exudates were prepared by suspending BM cells in cold phosphate-buffered saline for 30 minutes on ice; levels of soluble TGF-β1 dissipated in the buffer were measured by ELISA (n = 3 from each group). (C) Representative images of H&E-stained bone section from PF4Cre;Tgfb1flox/flox (PF4;Tgfb1) and WT (C57Bl/6) mice showing bone cells, including MKs indicated with green arrows. (D) The number of MKs in whole BM sections was counted manually (data supplement; supplemental Figure 1A). The MK number in PF4;Tgfb1 mice (n = 11) was ∼30% higher than that in controls (n = 10; P < .001), combining WT C57/Bl6 (n = 7) and littermate Tgfb1flox/flox (n = 3) mice. (E) Representative images of bone section immunofluorescence stained with anti–platelet factor 4 (anti-PF4; green) and nuclei stained with 4′,6-diamidino-2-phenylindole (DAPI; blue) showing MKs (yellow arrows) in BM of PF4;Tgfb1 and WT (C57Bl/6) mice. (F) The number of PF4+ MKs per microscope field at 20× magnification (P = .02; n = 3).
Conditional inactivation of Tgfb1 in MKs in mice decreases TGF-β1 levels to ∼50% and increases MK number by ∼30% in BM. (A) BM from the femur and tibia was flushed, cells were lysed with lysis buffer, and TGF-β1 was measured by ELISA. (B) BM exudates were prepared by suspending BM cells in cold phosphate-buffered saline for 30 minutes on ice; levels of soluble TGF-β1 dissipated in the buffer were measured by ELISA (n = 3 from each group). (C) Representative images of H&E-stained bone section from PF4Cre;Tgfb1flox/flox (PF4;Tgfb1) and WT (C57Bl/6) mice showing bone cells, including MKs indicated with green arrows. (D) The number of MKs in whole BM sections was counted manually (data supplement; supplemental Figure 1A). The MK number in PF4;Tgfb1 mice (n = 11) was ∼30% higher than that in controls (n = 10; P < .001), combining WT C57/Bl6 (n = 7) and littermate Tgfb1flox/flox (n = 3) mice. (E) Representative images of bone section immunofluorescence stained with anti–platelet factor 4 (anti-PF4; green) and nuclei stained with 4′,6-diamidino-2-phenylindole (DAPI; blue) showing MKs (yellow arrows) in BM of PF4;Tgfb1 and WT (C57Bl/6) mice. (F) The number of PF4+ MKs per microscope field at 20× magnification (P = .02; n = 3).
We then assessed the number of MKs in bone sections by manually counting H&E-stained whole BM sections and found that PF4Cre;Tgfb1flox/flox mice (0.36 ± 0.08; n = 11) had ∼30% more MKs than had both C57/Bl6-WT (n = 7) and littermate Tgfb1flox/flox controls (n = 3; 0.25 ± 0.04; n = 10; Figure 1C-D; supplemental Figure 1A). Manual counting of H&E-stained BM smears (supplemental Figure 1B) confirmed that MK numbers were higher in PF4Cre;Tgfb1flox/flox than in WT control mice (0.12 ± 0.06 in PF4Cre;Tgfb1flox/flox; n = 6 vs 0.08 ± 0.006 in WT; n = 4; P = .02).
Although MKs are the largest cells in the BM and thus easy to visualize in high-magnification slide scanner images, thicker slide sections or smears can conceal some MKs within cell clusters. We therefore also validated MK numbers by isolating MKs using a bovine serum albumin gradient followed by fixation and found that MKs were enriched in the bottom layer of the gradient (supplemental Figure 1C). Counting MKs using a hemocytometer also showed higher MK percentages in PF4Cre;Tgfb1flox/flox mice than in controls (0.1% vs 0.08%). We counted MKs isolated from BM by flow cytometry as well. BM cells gated for CD41+ cells with nuclei stained with Hoechst showed higher MK numbers in PF4Cre;Tgfb1flox/flox than in WT mouse BM (P = .046; supplemental Figure 2A-B); MK percentages in WT (n = 7) and PF4Cre;Tgfb1flox/flox (n = 5) BM were 0.43 ± 0.19 and 0.72 ± 0.21, respectively. We found fragmented MKs in flow-sorted CD41+ cells (supplemental Figure 2C), confirming the variability of the flow data. We also checked MK progenitors (MKPs; CD150+ and CD41+) and found higher numbers of MKPs in PF4Cre;Tgfb1flox/flox mice than in controls (supplemental Figure 2A-B; P < .04), indicating TGF-β1 affects MKPs.
The results from manual counting of H&E-stained MKs (Figure 1D) were confirmed by counting immunofluorescence-stained (using PF4 and CD41 antibodies) images of BM sections, which showed higher numbers of PF4+ and CD41+ MKs in the BM of PF4Cre;Tgfb1flox/flox mice than in that of WT mice (Figure 1E-F; supplemental Figure 3). These results confirmed that these cells were all mature MKs expressing the cell-surface marker CD41 and the α granule marker PF4.
PF4Cre;Tgfb1flox/flox mice have more circulating platelets than WT mice, and platelet count correlates with number, but not size or ploidy, of MKs
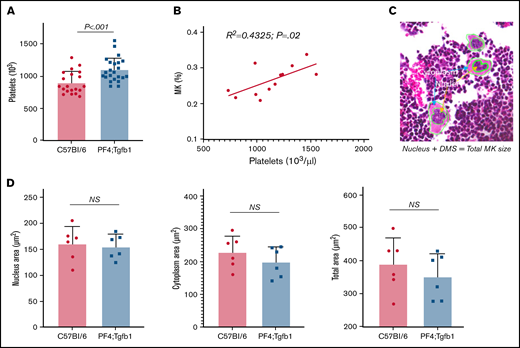
We then determined whether higher numbers of MKs in the BM of PF4Cre;Tgfb1flox/flox mice resulted in higher numbers of circulating platelets in peripheral blood and found >15% more platelets in PF4Cre;Tgfb1flox/flox mice (n = 23) than in littermate control TGFb1flox (n = 10) and WT C57Bl/6 (n = 10) mice combined (1100 ± 180 vs 900 ± 170; P < .001; Figure 2A). Platelet number in peripheral blood and MK number in BM were correlated (R2 = 0.4325; P = .02; Figure 2B).
The number, but not the size, of MKs in BM correlates with the number of platelets. (A) Platelet numbers were counted in the EDTA-anticoagulated peripheral blood of PF4Cre;Tgfb1flox/flox (PF4;Tgfb1) and WT C57Bl/6 or Tgfb1flox/flox mice using an automated hemovet cell counter (n = 20-23). (B) The correlation between platelet count and MK number in PF4;Tgfb1 and WT C57Bl/6 (n = 12) mice. (C) Representative H&E-stained image showing cytoplasm areas and nuclei of MKs. (D) The cytoplasm area, nucleus area, and total (cytoplasm plus nucleus) area were calculated by demarcation using hand drawing in high-magnification images from an Aperio scanner, and the areas were measured using an ImageScope program (data supplement; supplemental Figures 1 and 4; n = 6).
The number, but not the size, of MKs in BM correlates with the number of platelets. (A) Platelet numbers were counted in the EDTA-anticoagulated peripheral blood of PF4Cre;Tgfb1flox/flox (PF4;Tgfb1) and WT C57Bl/6 or Tgfb1flox/flox mice using an automated hemovet cell counter (n = 20-23). (B) The correlation between platelet count and MK number in PF4;Tgfb1 and WT C57Bl/6 (n = 12) mice. (C) Representative H&E-stained image showing cytoplasm areas and nuclei of MKs. (D) The cytoplasm area, nucleus area, and total (cytoplasm plus nucleus) area were calculated by demarcation using hand drawing in high-magnification images from an Aperio scanner, and the areas were measured using an ImageScope program (data supplement; supplemental Figures 1 and 4; n = 6).
MKs undergo a complex maturation process that is required for platelet production.16 This process results in significant enlargement of MKs to an approximate diameter of 100 μm via multiple rounds of endomitosis, with the increase in nuclear DNA content by polyploidy reaching an average of 16 N and up to 128 N.2,16 In addition to the expansion of DNA, MKs experience significant maturation as internal membrane systems and granules and organelles are assembled in the cytoplasm area during their development.16 In particular, an expansive and interconnected membranous network of cisternae and tubules is formed, called the demarcation membrane system.17 To assess whether there were any differences in MK size resulting from the lack of TGF-β1 in MKs in PF4Cre;Tgfb1flox/flox mice affecting the expansion of the nucleus or cytoplasm, we measured the total areas of the nucleus and cytoplasm. We found no significant difference in cytoplasm or nucleus area; both expanded similarly. The total area of MKs was also similar between both genotypes as measured from the BM in bone section and smear images (Figure 2C-D; supplemental Figure 4). This suggests that TGF-β1 regulates megakaryopoiesis, which is important for platelet production, but not the expansion of MKs.
PF4Cre;Tgfb1flox/flox mice have higher levels of TPO in plasma and liver, but not in BM, cells than WT mice
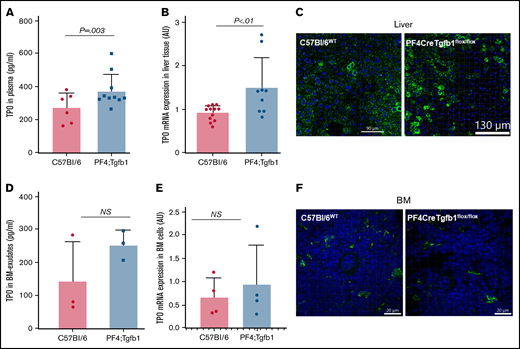
Because TPO is the main regulator of MK generation in BM, we measured TPO levels in plasma and found that PF4Cre;Tgfb1flox/flox mice (n = 10) had ∼40% higher TPO levels than WT C57Bl/6 mice (376 ± 100 vs 274 ± 90 pg/mL; P = .003; Figure 3A). The mechanism by which TPO regulates MK production in BM is not clear; therefore, we assessed both mRNA and protein levels of TPO in the liver and BM by quantitative reverse transcription PCR and immunofluorescence staining, respectively. We found significantly higher expression of TPO mRNA in PF4Cre;Tgfb1flox/flox mouse liver cells than in WT control mouse liver cells (Figure 3B). Immunostaining with a TPO antibody confirmed that more liver cells were positive for TPO in PF4Cre;Tgfb1flox/flox than in WT mice (Figure 3C). We also measured TPO levels in BM exudates and found no significant difference between genotypes (Figure 3D). We found variable TPO mRNA expression in BM cells between genotypes, but the data were not statistically significantly different (Figure 3E). Immunostaining with a TPO antibody showed some cells in BM, including MKs, also expressed TPO, but much less than liver cells, and the difference was also not statistically significant (P = .29; n = 3; Figure 3F).
Higher levels of TPO in liver and plasma, but not in BM, in PF4Cre;Tgfb1flox/flox vs WT mice. (A) TPO levels in plasma were measured by ELISA (R&D Systems; P = .003; n = 6-10). (B,E) Quantitative reverse transcription PCR of TPO mRNA from liver tissue (B) and BM cells (E) from PF4Cre;Tgfb1flox/flox (PF4;Tgfb1) and WT (C57Bl/6) mice. Thrombospondin expression was calculated by the ΔCT method with a reference gene β-actin, and data are expressed as fold change over WT C57Bl/6. (C) Liver sections from PF4;Tgfb1 and WT (C57Bl/6) mice were stained with anti-TPO antibody. (D) TPO levels in BM exudates were measured by ELISA. (F) BM sections were stained with anti-TPO antibody. Nuclei were stained with 4′,6-diamidino-2-phenylindole (blue color). AU, arbitrary unit; ns, not significant.
Higher levels of TPO in liver and plasma, but not in BM, in PF4Cre;Tgfb1flox/flox vs WT mice. (A) TPO levels in plasma were measured by ELISA (R&D Systems; P = .003; n = 6-10). (B,E) Quantitative reverse transcription PCR of TPO mRNA from liver tissue (B) and BM cells (E) from PF4Cre;Tgfb1flox/flox (PF4;Tgfb1) and WT (C57Bl/6) mice. Thrombospondin expression was calculated by the ΔCT method with a reference gene β-actin, and data are expressed as fold change over WT C57Bl/6. (C) Liver sections from PF4;Tgfb1 and WT (C57Bl/6) mice were stained with anti-TPO antibody. (D) TPO levels in BM exudates were measured by ELISA. (F) BM sections were stained with anti-TPO antibody. Nuclei were stained with 4′,6-diamidino-2-phenylindole (blue color). AU, arbitrary unit; ns, not significant.
BM cells from PF4Cre;Tgfb1flox/flox mice cultured with TPO generate higher numbers of MKs than similarly treated BM cells from WT mice
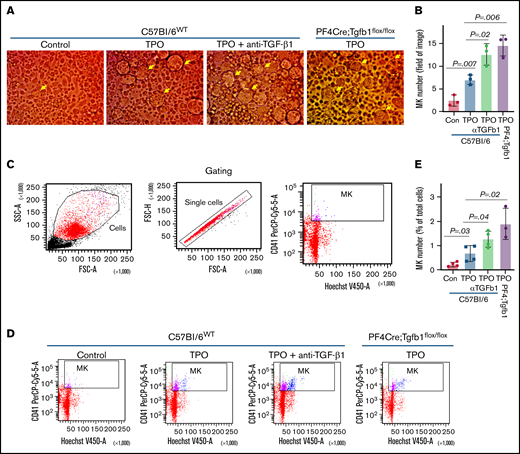
To confirm our in vivo finding that mice with loss of TGF-β1 expression in MKs had more MKs in BM, we cultured BM cells isolated from WT and PF4Cre;Tgfb1flox/flox mice with or without TPO for up to 5 days and determined MK numbers by manually counting MKs and by flow cytometry using CD41 and Hoechst staining. TPO itself increased the WT MK number by approximately threefold (P = .007), which was further increased (approximately twofold) by adding a TGF-β1–neutralizing antibody (P = .02), whereas TPO increased the PF4Cre/Tgfb1flox/flox MK numbers approximately fourfold (P = .006; Figure 4A-B). In all instances, TPO increased MK numbers compared with controls without TPO, confirming that TPO promotes megakaryopoiesis in an in vitro culture system. Flow cytometric assessment of in vitro BM culture stained with CD41 antibody and gating with nucleus containing with Hoechst staining showed similar results after 4 to 5 days of culture (Figure 4C-E). We also checked the ploidy of MKs in freshly isolated BM from WT C57Bl/6 and PF4Cre;Tgfb1flox/flox mice and after 5 days of BM cell culture with TPO and found no difference in ploidy levels between genotypes (supplemental Figure 5).
TPO treatment and inhibition of TGF-β1 activity increase MK numbers in BM culture in vitro. BM from PF4Cre;Tgfb1flox/flox or WT mice were cultured with and without TPO for up to 5 days. BM cells from WT mice were cultured with TPO in the presence or absence of anti–TGF-β1–neutralizing antibody (α-TGF-β1; 2 μg/mL; AF101; R&D Systems). (A-B) MK numbers (large cells indicated by yellow arrows) were counted manually under a light microscope. (C-D) MK numbers were counted by flow cytometry after staining with CD41 antibody, and nuclei were labeled with Hoechst. (D) Representative flow cytometric dot plot analysis of gating of MKs with double-positive CD41+Hoechst+. (E) Plot shows MK numbers counted for indicated conditions. FSC, forward scatter; SSC, side scatter.
TPO treatment and inhibition of TGF-β1 activity increase MK numbers in BM culture in vitro. BM from PF4Cre;Tgfb1flox/flox or WT mice were cultured with and without TPO for up to 5 days. BM cells from WT mice were cultured with TPO in the presence or absence of anti–TGF-β1–neutralizing antibody (α-TGF-β1; 2 μg/mL; AF101; R&D Systems). (A-B) MK numbers (large cells indicated by yellow arrows) were counted manually under a light microscope. (C-D) MK numbers were counted by flow cytometry after staining with CD41 antibody, and nuclei were labeled with Hoechst. (D) Representative flow cytometric dot plot analysis of gating of MKs with double-positive CD41+Hoechst+. (E) Plot shows MK numbers counted for indicated conditions. FSC, forward scatter; SSC, side scatter.
Discussion
We show that mice deficient in TGF-β1 in MKs/platelets (PF4Cre;Tgfb1flox/flox) exhibit increased MK numbers (∼30%) compared with both Tgfb1flox/flox littermate and WT controls (Figure 1), demonstrating that TGF-β1 produced by MKs/platelets negatively regulates MK production in BM. Because platelets are produced by MKs, and platelets are being constantly consumed in normal conditions, having higher MK numbers under basal conditions in PF4Cre;Tgfb1flox/flox mice implies that they will produce more platelets. Future studies should be conducted to create stress models to study the effects of TGF-β1 in megakaryopoiesis and platelet production under stress conditions. Our data show that there is no difference in total size of MKs in the absence of MK-derived TGF-β1, indicating that TGF-β1 could be primarily responsible for megakaryopoiesis but have a minor effect or no effect on platelet production. This conclusion remains tentative and requires further study. We cannot completely rule out contributions of other factors, because platelet production in vivo or in vitro remains to be determined.
TPO is the major driver of MK generation in BM, and both liver and BM stromal cells have been shown to be sources of TPO. Our immunofluorescence staining data show that both BM and liver express TPO. However, twofold higher TPO expression (both mRNA and protein) in the liver of PF4Cre;Tgfb1flox/flox mice correlates with a twofold increase in plasma levels, suggesting that the systemic TGF-β1 level might regulate TPO production in the liver. Our data and conclusions are supported by reported findings that the loss of hepatic TPO leads to low MK/platelet counts in mice.18,19 Recent data show that although TPO mRNA is detected in BM cells, including stromal cells and MKs, TPO protein is produced by hepatocytes, which is required for HSC maintenance.20 These data are consistent with our finding of increased liver TPO expression with increased systemic TPO levels in PF4Cre;Tgfb1flox/flox mice vs WT mice, suggesting that hepatic generation of TPO contributes to megakaryopoiesis in BM. It is also possible that stromal cells and HSCs might produce TPO and regulate its own differentiation toward MKs by controlling TGF-β1 production in MKs.21 Our finding that higher numbers of MKs from PF4Cre;Tgfb1flox/flox mice vs from WT mice when cultured with exogeneous TPO suggests that TGF-β1 signaling inhibits the effect of TPO on HSC differentiation into MKs, consistent with the role of TGF-β1 in maintaining HSC quiescence in BM.11,12 Our in vitro BM culture studies with a TGF-β1–neutralizing antibody showed enhanced TPO-induced MK numbers, suggesting that TGF-β1 signaling is directly involved in megakaryopoiesis, consistent with in vivo data in mice indicating loss of Tgfb1 results in higher MKs in BM. Physiological regulation of TPO production in the liver in the context of platelet production vs clearance has been shown.22 There is currently a significant effort underway to generate MKs from stem cells, including finding the best markers for MKPs as well as critical regulation of megakaryopoiesis.23,24 Our study indicates that inhibitors of TGF-β1 signaling might be an option to enhance megakaryopoiesis. Whether in vitro–generated MKs can produce platelets remains to be determined. It should be noted that excessive exogenous TPO was used in the in vitro culture where TGF-β1 might affect HSC quiescence. Additional studies are required to determine the role of local vs systemic TPO, crosstalk between TPO and TGF-β1, and the mechanism of megakaryopoiesis.
Because platelets are continuously being produced to maintain normal hemostasis in the body, MK renewal under normal physiological conditions is critical to maintaining platelet homeostasis. This highlights the importance of our finding that platelet TGF-β1 contributes 50% of basal plasma TGF-β1 levels13,14,25 in the steady state, without stress conditions such as thrombocytopenia and or thrombocytosis. Future studies are required to investigate the role of TGF-β1 from platelets or other cells in MK and platelet production under stress conditions.
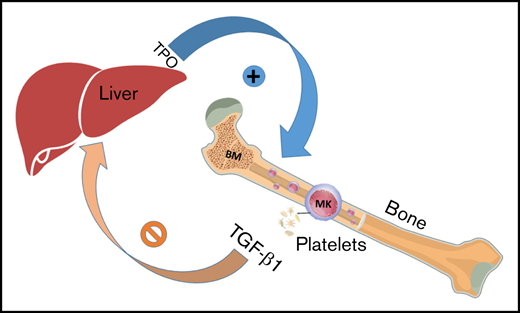
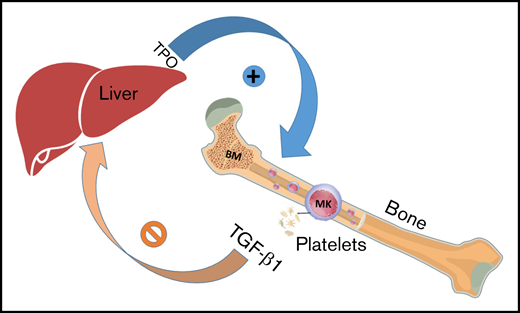
In summary, we demonstrate that loss of TGF-β1 in MKs/platelets in mice is associated with increased MK generation in BM and TPO expression in the liver. These results indicate that TGF-β1 produced by MKs/platelets negatively regulates megakaryopoiesis by stimulating TPO production in the liver (Figure 5). Thus, inhibition of MK/platelet-derived TGF-β1 with antiplatelet agents might be an approach to manage conditions in which loss of platelets is observed.
Model depicts MK/platelet-derived TGF-β1 regulating its own production in BM by regulating TPO production in the liver. ⊘ indicates inhibition; + indicates stimulation.
Model depicts MK/platelet-derived TGF-β1 regulating its own production in BM by regulating TPO production in the liver. ⊘ indicates inhibition; + indicates stimulation.
Acknowledgments
The authors thank K.-M. Fung for assistance with Aperio Scanner Imaging, B. Flower and J. Flower for image analysis and quantification, and Ashley Mathew for assisting in MK count and histology staining and acknowledge editorial assistance by M.K. Occhipinti and Life Sciences Editors.
This work was supported by grants HL123605 and HL148123 from the National Heart, Lung, and Blood Institute, National Institutes of Health (J.A.), and grant CA225520 from Oklahoma Center for Adult Stem Cell Research and the Presbyterian Health Foundation, which supported laboratory and various core facilities (J.A.). S.G. is currently enrolled in the graduate program at the University of Oklahoma Heath Science Center.
Authorship
Contribution: S.G., T.V., K.S., B.C., and A.R. performed a majority of the experiments, including histology and immunostaining, reverse transcription PCR, flow cytometry, ELISA, and analyzed, quantified, and plotted the data; P.D. and S.S. performed select experiments; and J.A. conceived the idea and conducted data analysis, supervised the project, and wrote the manuscript.
Conflict-of-interest disclosure: The authors declare no competing financial interests.
Correspondence: Jasimuddin Ahamed, Cardiovascular Biology Research Program, Oklahoma Medical Research Foundation, 825 NE 13th St, Oklahoma City, OK 73104; e-mail: ahamedj@omrf.org.
References
Author notes
Requests for data sharing may be submitted to Jasimuddin Ahamed (ahamedj@omrf.org.)
The full-text version of this article contains a data supplement.

