Key Points
The gut microbiota of patients with AML undergoes long-lasting changes during induction chemotherapy.
Abstract
Previous studies have shown that the gut microbiota of patients with acute myeloid leukemia (AML) is disrupted during induction chemotherapy; however, the durability of microbiota changes is unknown. This is an important knowledge gap, because reduced microbiota diversity at the time of stem cell transplantation weeks to months after the initial chemotherapy has been associated with higher mortality after transplantation. By sequencing the gut microbiota in 410 longitudinal stool samples from 52 patients with AML, we found that, during inpatient chemotherapy, the gut microbiota is stressed beyond its ability to recover its original state. Despite major reductions in antibiotic pressure and other disturbances to the microbiota after hospital discharge, the trajectory of microbiota recovery yields new communities that are highly dissimilar to baseline. This lasting shift in the gut microbiota is relevant for subsequent phases of curative therapy and is a potential target for novel microbiota protective/restorative interventions. This trial was registered at www.clinicaltrials.gov as #NCT03316456.
Introduction
Perturbed ecosystems can reach a “point of no return,” when diminution or cessation of the perturbation is no longer sufficient for recovery of the original state.1-3 Patients with acute myeloid leukemia (AML) receive multiple antibiotics during induction chemotherapy, causing major disruptions to the gut microbiota.4-7 Upon discharge from the hospital, antibiotic exposure declines significantly; however, it is not known whether this is sufficient for the microbiota to revert to its original state. This is an important and clinically relevant knowledge gap, because many patients with AML undergo allogeneic stem cell transplantation weeks to months after finishing induction chemotherapy, and reduced gut microbiota diversity at the time of transplantation predicts a higher risk for death after transplantation.8 The composition of the gut microbiota at the time of transplantation differs from that of healthy adults,8 even when microbial diversity has recovered,9 suggesting unresolved injury from prior insults.
To address this question directly, we profiled the microbiota in 410 stool samples obtained longitudinally over 6 months from 52 patients with AML. We found that the microbiota became increasingly dissimilar to baseline during the initial hospitalization. Unexpectedly, however, the microbiota did not recover after hospital discharge; rather, it evolved into new communities that were highly dissimilar to baseline.
Methods
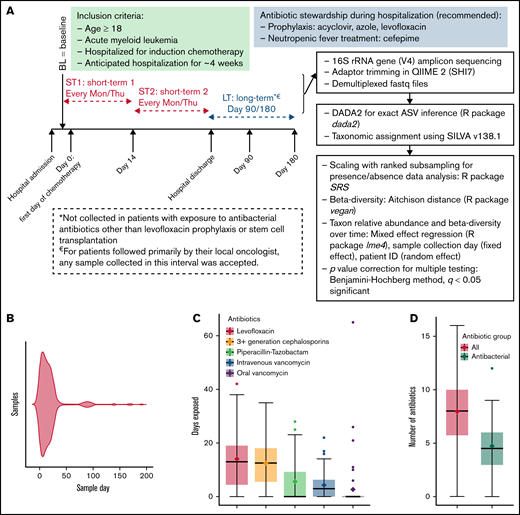
We collected stool samples twice weekly during the initial hospitalization for chemotherapy (short term) and at 3 and 6 months postchemotherapy (long term) from 52 hospitalized adults with AML (#NCT03316456, www.ClinicalTrials.gov; approved by the University of Minnesota Institutional Review Board) (Figure 1A). The study was performed in accordance with the Declaration of Helsinki. The only other inclusion criterion was an expected hospitalization of ∼4 weeks. The first sample (baseline) was collected as soon as possible after admission, with a permitted window extending through day 7 of chemotherapy. Antibiotic use followed our institutional recommendations (Figure 1A) and pre-/probiotics were not used. Long-term samples were not included if they were collected after stem cell transplantation or exposure to antibacterial antibiotics other than prophylactic levofloxacin. The V4 hypervariable region of the 16S ribosomal RNA gene was amplified on an Illumina MiSeq platform.10 Sequence data were deposited in the National Center for Biotechnology Information Sequence Read Archive (BioProject ID SRP141394). Exact amplicon sequence variants (ASVs) were inferred using DADA211 (dada2 package v1.18.0 in R). Taxonomic assignment was done by the naive Bayesian classifier implemented in DADA2 and the SILVA nonredundant v138.1 training set.12 More details on sample handling and sequencing are provided in supplemental Methods.
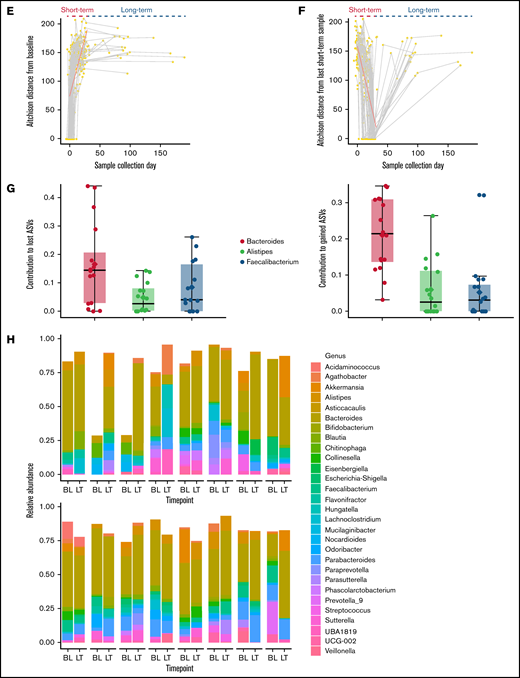
Short- and long-term microbiota dynamics. (A) Study schema. Induction chemotherapy typically starts within a few days after admission and is completed by day 7. Bone marrow aplasia occurs around day 14, which we used to define early (ST1) vs late (ST2) short-term samples. (B) Violin plot shows sample distribution over time. The duration (C) and number (D) of all antibiotics and antibacterial antibiotics during the initial hospitalization. (E) Aitchison distance between each sample and the baseline sample from the same patient. Connected points represent samples from the same patient. (F) Aitchison distance between each sample and the last short-term sample from the same patient. Regression lines for short-term samples are derived from a linear mixed-effect regression, where patient ID was a random effect and sample collection day, measured from the first day of chemotherapy (E) or the last short-term sample (F), was a fixed effect. (G) The top 3 genera containing lost (left panel) and gained (right panel) ASVs between the baseline sample and the last long-term sample for each patient. The y-axis shows the proportion of such ASVs belonging to each genus. Each point represents data from 1 patient. (H) Genus-level relative abundances in baseline (BL) and last long-term (LT) samples from each of the 16 patients with long-term samples. The 5 most abundant genera in each sample were selected, and the combined set of genera generated from all samples was used to plot the stacked bars. Box plots in (C), (D), and (G) show the median (horizontal line), mean (diamond), and interquartile range.
Short- and long-term microbiota dynamics. (A) Study schema. Induction chemotherapy typically starts within a few days after admission and is completed by day 7. Bone marrow aplasia occurs around day 14, which we used to define early (ST1) vs late (ST2) short-term samples. (B) Violin plot shows sample distribution over time. The duration (C) and number (D) of all antibiotics and antibacterial antibiotics during the initial hospitalization. (E) Aitchison distance between each sample and the baseline sample from the same patient. Connected points represent samples from the same patient. (F) Aitchison distance between each sample and the last short-term sample from the same patient. Regression lines for short-term samples are derived from a linear mixed-effect regression, where patient ID was a random effect and sample collection day, measured from the first day of chemotherapy (E) or the last short-term sample (F), was a fixed effect. (G) The top 3 genera containing lost (left panel) and gained (right panel) ASVs between the baseline sample and the last long-term sample for each patient. The y-axis shows the proportion of such ASVs belonging to each genus. Each point represents data from 1 patient. (H) Genus-level relative abundances in baseline (BL) and last long-term (LT) samples from each of the 16 patients with long-term samples. The 5 most abundant genera in each sample were selected, and the combined set of genera generated from all samples was used to plot the stacked bars. Box plots in (C), (D), and (G) show the median (horizontal line), mean (diamond), and interquartile range.
The objective of this first stool biospecimen collection protocol was to permit analysis for future questions. Therefore, there was no predefined primary hypothesis and, thus, no power calculation. All analyses were done in R 3.4 (R Foundation for Statistical Computing, Vienna, Austria). We filtered samples with <5000 reads and those with <1000 copies of 16S ribosomal RNA gene per milliliter. To adjust for sample depth in the presence/absence data analysis, we used scaling with ranked subsampling (SRS package).13 β-diversity was calculated using Aitchison distance (vegan package).14 Changes in taxa abundances and β-diversity over time were evaluated by mixed-effect regression (lme4 package). We used Analysis of Compositions of Microbiomes with Bias Correction (ancombc package) in exploratory analyses to identify clinical factors associated with taxonomic changes during the initial hospitalization.15 The P values were adjusted for multiple testing using the Benjamini-Hochberg method.16
Results and discussion
Four hundred and ten samples were collected (supplemental Table 1); day 1 was the median collection day for baseline sampling. These samples yielded 9 033 498 high-quality sequences and 25 110 ASVs. After filtering, we analyzed 25 110 ASVs in 339 samples, including 318 short-term samples (51 patients) and 21 long-term samples (16/51 patients; 17 samples at 3 months and 4 samples at 6 months). The distribution of these samples over time is shown in Figure 1B. The median number of reads per sample was 16 522 (range, 5 193-114 449). The median age was 60 years (range, 27-80), and 30 (59%) patients were male. Forty-three (84%) patients had newly diagnosed AML, and 8 (16%) had relapsed disease. The chemotherapy regimen was 7 + 3 (conventional or liposomal; with or without an additional agent) in 35 (69%) patients, clofarabine based in 9 (18%) patients, and less intensive in 7 (13%) patients.
Antibiotic exposure during the initial hospitalization was prolonged and heavy (Figure 1C-D). The composition of the microbiota became progressively dissimilar to baseline during the initial hospitalization (Figure 1E). Surprisingly, long-term samples remained as dissimilar to baseline as were the samples collected at the end of the hospitalization (Figure 1E). Thus, discharge from the hospital did not promote microbiota recovery toward baseline, suggesting that the communities established at the end of hospitalization were stable and persisted into long-term samples or were unstable but did not follow a trajectory toward baseline after discharge. When the latest short-term sample for each patient was used as reference, moving backward and forward in time increased the compositional dissimilarity (Figure 1F), supporting the second scenario.
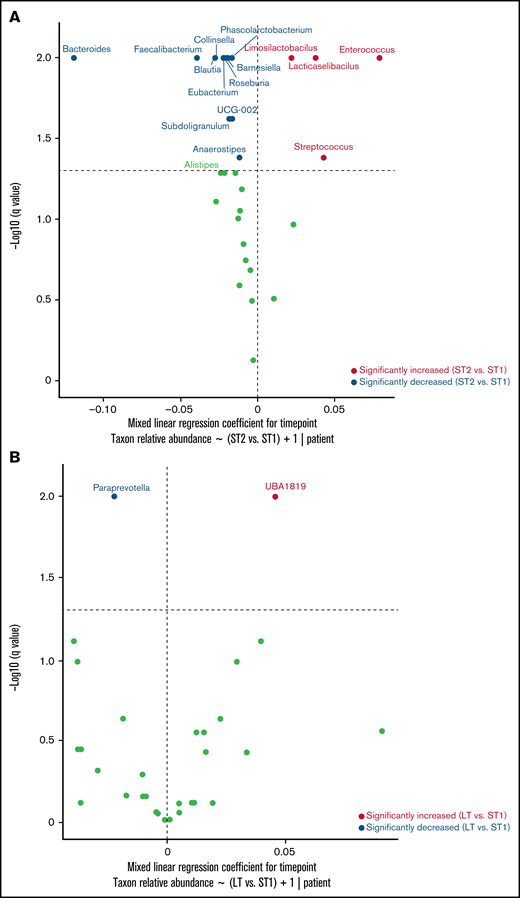
Next, we compared the last long-term sample from each patient with their baseline sample to identify lost or newly gained ASVs. This analysis included 21 long-term samples from 16 patients. A large proportion (median, 70.6%; range, 37.1-99.8) of baseline ASVs was absent in long-term samples, and a similar proportion (median, 68.8%; range, 33.3-99.8%) of long-term ASVs was absent at baseline, indicating a major turnover at the species/strain level. The proportional similarity of the lost and gained ASVs suggested that they may belong to the same genera. Indeed, the 3 genera that made the largest contributions to the lost and gained ASVs were identical (Figure 1G): Bacteroides (median, 14.5% of lost ASVs and 21.5% of gained ASVs), Faecalibacterium (median, 4.1% of lost ASVs and 3.1% of gained ASVs), and Alistipes (median, 2.7% of lost ASVs and 2.6% of gained ASVs). Thus, a major driver of the compositional difference between baseline and long-term samples was species/strain-level replacement within these genera. Indeed, genus-level comparisons of baseline and long-term samples showed broadly similar compositions (Figure 1H). This could reflect 1 of the 2 scenarios: either the genus of interest remained stable during and after the initial hospitalization or it changed during the initial hospitalization and again after hospital discharge, but in opposite directions. To distinguish between these possibilities, we compared genus abundances for the 3 intervals shown in Figure 1A. The relative abundances of Bacteroides (q < 0.01), Faecalibacterium (q < 0.01), and Alistipes (q = 0.05) decreased during the initial hospitalization (after vs before day 14; Figure 2A), but increased after discharge to levels that were not different from the pre–day-14 period (Figure 2B; supplemental Figure 1).
Genus-level dynamics over time. A mixed-effects model was built for each genus in the form of relative abundance ∼ interval + 1|patient ID, with the interval defined according to Figure 1A. Horizontal lines represent q = 0.05. The significance of the regression coefficient for interval was estimated from 200 bootstraps, corrected for multiple testing by the Benjamini-Hochberg method, plotted along the y-axis, and used to determine whether the relative abundance of a genus changed between the intervals. The regression coefficient for interval was plotted along the x-axis. Points to the right (left) of the vertical line represent increased (decreased) genera at short-term 2 (ST2; panel A) or long-term (LT; panel B) relative to short-term 1 (ST1).
Genus-level dynamics over time. A mixed-effects model was built for each genus in the form of relative abundance ∼ interval + 1|patient ID, with the interval defined according to Figure 1A. Horizontal lines represent q = 0.05. The significance of the regression coefficient for interval was estimated from 200 bootstraps, corrected for multiple testing by the Benjamini-Hochberg method, plotted along the y-axis, and used to determine whether the relative abundance of a genus changed between the intervals. The regression coefficient for interval was plotted along the x-axis. Points to the right (left) of the vertical line represent increased (decreased) genera at short-term 2 (ST2; panel A) or long-term (LT; panel B) relative to short-term 1 (ST1).
In exploratory analyses, 3 of the 4 long-term samples collected at 6 months had a preceding nonfiltered 3-month sample. The genus-level composition of these 3 paired samples is shown in supplemental Figure 2. In Analysis of Compositions of Microbiomes with Bias Correction to find potential clinical determinants of changes in taxa abundances during the initial hospitalization, Bacteroides abundance in the last short-term sample was negatively associated with prior oral vancomycin exposure (supplemental Table 2), consistent with a previous study.17 Our study is limited by patient heterogeneity with regard to disease phase, diet, and chemotherapeutic regimens.
In conclusion, a large proportion of species/strains within specific genera are lost during hospitalization, resulting in an overall shrinkage of those genera by the end of hospitalization. After discharge, the lost species/strains are replaced by new species/strains predominantly within the same genera. Although this process restores baseline abundances of the genera and genus-level microbiota composition, it creates new communities at the species/strain level that may have unanticipated effects on the host.18,19 Our findings indicate a lasting shift after the initial perturbation. A previous study with 13 healthy volunteers taking a short course of 3 antibiotics showed taxa loss/gain to be the main driver of compositional differences between baseline and long-term microbiota20 ; this result is consistent with our findings. Failure of Bacteroides to return to its baseline species/strain-level composition, despite recovery of its original abundance, was seen in previous studies of the long-term microbiota after a short antibiotic course.21,22 Bacteroides, Alistipes, and Faecalibacterium are abundant commensal genera in the human gut. These genera included 11 of the 21 species that predicted postantibiotic gut microbiota recovery in a multicohort analysis.23 Our findings suggest that, in patients with AML, restoration of the antibiotic-naive microbiota requires an earlier reduction in antibiotic pressure or fecal microbiota transplantation. This may have implications for subsequent phases of curative therapy, such as stem cell transplantation.
Acknowledgments
Sequencing data were analyzed using the resources of the Minnesota Supercomputing Institute.
This work was supported by grants from the National Institutes of Health National Center for Advancing Translational Sciences (KL2TR002492 and UL1TR002494).
The content is solely the responsibility of the authors and does not necessarily represent the official views of the National Institutes of Health National Center for Advancing Translational Sciences.
Authorship
Contribution: A.R. and C.S. conceived the study and performed microbiota analysis; A.R., M.E., T.U.R., and H.E. collected metadata; T.K., H.F.H., and C.S. extracted and sequenced DNA; A.R. wrote the manuscript; and M.E., D.J.W., S.G.H, A.K., and C.S. provided critical feedback on the manuscript.
Conflict-of-interest disclosure: The authors declare no competing financial interests.
Correspondence: Armin Rashidi, Division of Hematology, Oncology, and Transplantation, Department of Medicine, University of Minnesota, 14-100 PWB, MMC 480, 420 Delaware St SE, Minneapolis, MN 55455; e-mail: arashidi@umn.edu.
References
Author notes
The sequencing data reported in this article have been deposited in the National Center for Biotechnology Information Sequence Read Archive (BioProject ID SRP141394).
Requests for data sharing may be submitted to Armin Rashidi (arashidi@umn.edu).
The full-text version of this article contains a data supplement.


