Key Points
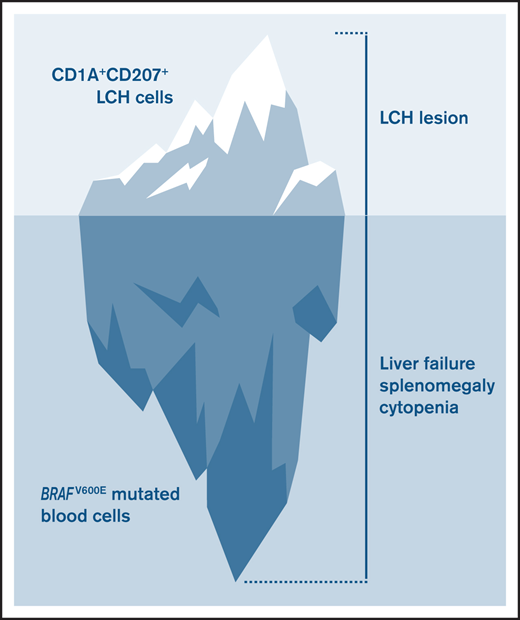
BRAF-mutated blood cells contribute to the disease phenotype in LCH.
Vemurafenib inhibits systemic inflammation and rapidly improves the clinical picture, but does not eradicate the mutated clone.
Abstract
Langerhans cell histiocytosis (LCH) is a neoplasm marked by the accumulation of CD1A+CD207+ cells. It is most commonly driven by a somatic, activating mutation in the BRAF serine-threonine kinase (BRAFV600E). Multisystem disease with risk-organ involvement requires myelotoxic chemotherapy, making BRAF-inhibitors an attractive treatment option. Here, we present a comprehensive analysis of the course of an LCH patient treated with the combination of vemurafenib and salvage chemotherapy who achieved sustained clinical and molecular remission. We show that there is no relationship between peripheral blood BRAFV600E levels and clinical presentation during treatment with vemurafenib, but that vemurafenib leads to a fast, efficient, but reversible inhibition of clinical manifestations of systemic inflammation. In line, serum levels of inflammatory cytokines exactly mirror vemurafenib administration. Genotyping analysis identified the BRAFV600E mutation in multiple hematopoietic cell types, including NK cells and granulocytes. Single-cell transcriptome analyses of peripheral blood and bone marrow cells at time of diagnosis and during treatment indicate that RAF-inhibition abrogates the expression of inflammatory cytokines previously implicated in LCH such as IL1B and CXCL8. Together, our data suggest that while the CD1A+CD207+ histiocytes are the hallmark of LCH, other BRAF-mutated cell populations may contribute significantly to morbidity in patients with multisystem LCH.
Introduction
Langerhans cell histiocytosis (LCH) is a histiocytic disorder driven by activating mutations in the MAPK pathway, most commonly, in about 55% of cases, BRAFV600E.1,2 It is defined by the accumulation of CD1A+CD207+ cells in different organs.3 Patients with involvement of liver, spleen, or the hematopoietic systems have a higher risk of disease-related mortality.4 Importantly, involvement of these so-called risk organs is a functional definition inferred by organ dysfunction.5 In most cases, no or few infiltrating CD1A+CD207+ LCH cells are found in these organs,6-9 suggesting that these pathogenic phenotypes might be caused by other cells or indirectly.
Multisystem LCH is treated with risk-adapted chemotherapy. Moreover, RAF inhibitors are increasingly being used, but usually, patients relapse on discontinuation of therapy.10,11 Here we report a patient with risk organ–positive LCH who was successfully treated with a combination of vemurafenib and 2-chlorodeoxyadenosine and cytarabine (2-CdA/ARA-C). Furthermore, we suggest that, although the CD1A+CD207+ histiocytes are the hallmark of LCH, other BRAF-mutated cells contribute significantly to morbidity in patients with multisystem LCH by causing systemic inflammation (and hence risk organ involvement). We corroborate our hypothesis with detailed analysis of the clinical course, cytokine patterns, and BRAFV600E levels in different blood cell types, together with the transcriptome analysis of single cells from bone marrow and peripheral blood of the patient.
Methods
Samples were obtained as part of routine diagnostic procedures. The study was approved by the ethics committee of the Medical University of Vienna, and parents gave their written and informed consent.
Flow cytometry and cell sorting
Peripheral blood and bone marrow cells were isolated by density gradient centrifugation and subsets were purified by fluorescence-activating cell sorting using a FACScan flow cytometer (BD FACSAria).
Allele-specific droplet digital polymerase chain reaction
Droplet-digital polymerase chain reaction (PCR) for BRAFV600E was performed as previously described10 using the Mutation Assay BRAF p.V600E c.1799T-A, Human (Bio-Rad Laboratories) and the QX200 Droplet Digital PCR System (Bio-Rad Laboratories).
Cytokine assay
Cytokines were analyzed with the Inflammation 20-Plex Human ProcartaPlex Panel (ThermoFisher) according to the manufacturers instructions. Samples were measured on a MAGPIX Instrument (Luminex Corporation).
Single-cell RNA-seq
Single-cell RNA-seq was performed using the 10x Genomics Chromium Single Cell Controller with the Chromium Single Cell 3' Kit as previously described12 and detailed in the supplemental Methods. The downstream analysis was performed using the Seurat package13 (v3.1.4) for R (v3.6.2). Cell types were annotated by mapping the cells on a reference dataset of preannotated cells using the Azimuth14 pipeline. Differential expressed genes were calculated with the model-based analysis of single-cell transcriptomics (MAST).15 Gene set enrichment analysis (GSEA)16 was calculated for Gene Ontology's Biological Process dataset.
Results and discussion
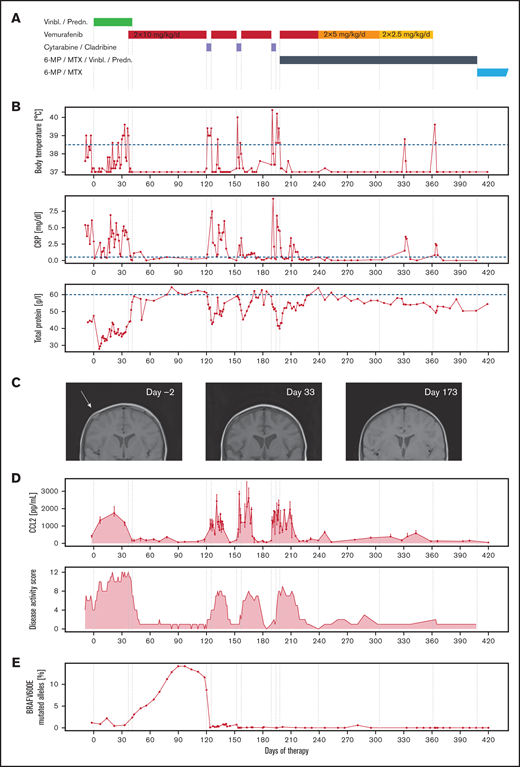
A 2-year-old child with multisystem LCH (involvement of bone, skin, hematopoietic system, and liver) who deteriorated on treatment with prednisone and vinblastine was switched to therapy with vemurafenib. Clinically, the patient improved within days. He became more active, fever and hypoproteinemia subsided, and blood counts recovered. Because long-term effects of vemurafenib are unclear and because evidence thus far suggests that patients relapse after stopping the inhibitor,10,11,17 we decided to start treatment with 2-chlorodeoxyadenosine (2-CdA, cladribine) and cytarabine (ARA-C).3 Vemurafenib was paused on chemotherapy days but otherwise continued (Figure 1A). The vemurafenib discontinuance immediately led to fever, decreased total protein (TP) levels, and increased C-reactive protein (CRP). However, on resumption after the chemotherapy cycle, the fever subsided within hours, TP started to increase again, and CRP levels decreased. We observed the same pattern in the second and third chemotherapy cycles (Figure 1B). Vemurafenib dose was reduced after the third cycle of 2-CdA/ARA-C and subsequently discontinued during continuation therapy. The patient has now been without vemurafenib for 19 months, continuation therapy was stopped 7 months ago according to protocol, and the patient is still in remission (supplemental Figure 2).
Clinical improvement is linked directly to the administration of vemurafenib. (A) Drug therapy of the first 420 days (60 weeks, start: day 0); vemurafenib was started on day 37 because of the worsening clinical condition during stratum I (vinblastine/prednisone), paused during initial salvage therapy of stratum III (2-CdA/Ara-C), and reduced in dose in 2 stages and discontinued during continuation therapy part 2 (6-MP/MTX/vinblastine/prednisone). Subsequently, continuation therapy part 3 (6-MP/MTX) was carried out until day 730 (supplemental Figure 1). (B) Vemurafenib resulted in immediate improvement in fever, CRP, and TP. Each cessation of vemurafenib during the chemotherapy cycles caused intermittent fever, rise in CRP, and falling levels of TP, which reversed on continuation. (C) MRT of cranial lesions, which decreased in size visibly already during therapy with vinblastine/prednisone (T1-weighted MRI). (D) CC-chemokine ligand 2 (CCL2) concentration was closely correlated with clinical signs of disease activity. Points represent the median, and error bars the top and bottom of triplicate measurements per time point. The LCH disease activity score (DAS), which stayed high during initial chemotherapy, immediately improved on start with vemurafenib. It is important to note that the DAS after 2-CdA/Ara-C is confounded by chemotherapy-induced cytopenia. (E) During vemurafenib therapy, the percentage of BRAFV600E mutant alleles increased. Following stratum III therapy, no more mutant alleles were measurable.
Clinical improvement is linked directly to the administration of vemurafenib. (A) Drug therapy of the first 420 days (60 weeks, start: day 0); vemurafenib was started on day 37 because of the worsening clinical condition during stratum I (vinblastine/prednisone), paused during initial salvage therapy of stratum III (2-CdA/Ara-C), and reduced in dose in 2 stages and discontinued during continuation therapy part 2 (6-MP/MTX/vinblastine/prednisone). Subsequently, continuation therapy part 3 (6-MP/MTX) was carried out until day 730 (supplemental Figure 1). (B) Vemurafenib resulted in immediate improvement in fever, CRP, and TP. Each cessation of vemurafenib during the chemotherapy cycles caused intermittent fever, rise in CRP, and falling levels of TP, which reversed on continuation. (C) MRT of cranial lesions, which decreased in size visibly already during therapy with vinblastine/prednisone (T1-weighted MRI). (D) CC-chemokine ligand 2 (CCL2) concentration was closely correlated with clinical signs of disease activity. Points represent the median, and error bars the top and bottom of triplicate measurements per time point. The LCH disease activity score (DAS), which stayed high during initial chemotherapy, immediately improved on start with vemurafenib. It is important to note that the DAS after 2-CdA/Ara-C is confounded by chemotherapy-induced cytopenia. (E) During vemurafenib therapy, the percentage of BRAFV600E mutant alleles increased. Following stratum III therapy, no more mutant alleles were measurable.
RAF inhibition was strongly correlated to the disease activity score18 (Figure 1D). The most striking observation was the rapid and reversible response to the inhibitor, which suggests a functional switch in cell state rather than a cytotoxic effect. Vemurafenib was particularly efficient in inhibiting parameters of risk organ involvement (eg, cytopenia, hypoproteinemia), whereas the bone lesions responded to initial chemotherapy (Figure 1C). In line, levels of CCL2, an inflammation-induced chemokine19 previously described as upregulated in patients with multisystem LCH,20 strictly correlate with administration of vemurafenib (Figure 1D).
Risk organ involvement is mainly a functional definition5 and does not correlate with organ infiltration of CD1A+CD207+ LCH cells. This suggests that risk organ dysfunction is not caused by infiltration of the LCH cells themselves but rather a result of systemic inflammation (similar to hemophagocytic lymphohistiocytosis21 ). In support of this concept is the transcriptomic similarity of the CD1A+CD207+ LCH cells in single-system and multisystem LCH: the CD1A+CD207+ cells do not cluster according to disease severity.12,22,23 In contrast, several groups have reported that the amount of BRAFV600E in peripheral blood correlates with disease extent.10,24
The MAPK pathway is a central signaling pathway in many cell types, and consequently, constitutive activation of ERK signaling could influence cell behavior. We therefore hypothesized that, rather than just serving as precursor cells of the LCH cells, peripheral blood and bone marrow cells themselves may directly contribute to disease manifestations:
First, we correlated treatment to clinical manifestations (disease activity; Figure 1D). Analysis of the number of circulating BRAFV600E-mutated cells showed that chemotherapy with vinblastine and prednisone failed to eradicate BRAFV600E-mutated cells (Figure 1E). Furthermore, we even observed an increase in the percentage of BRAF-mutated cells during therapy with vemurafenib, although the patient showed no signs of disease activity. Thus, vemurafenib does not eradicate BRAFV600E-positive clones, despite inducing clinical remission.10,11,17
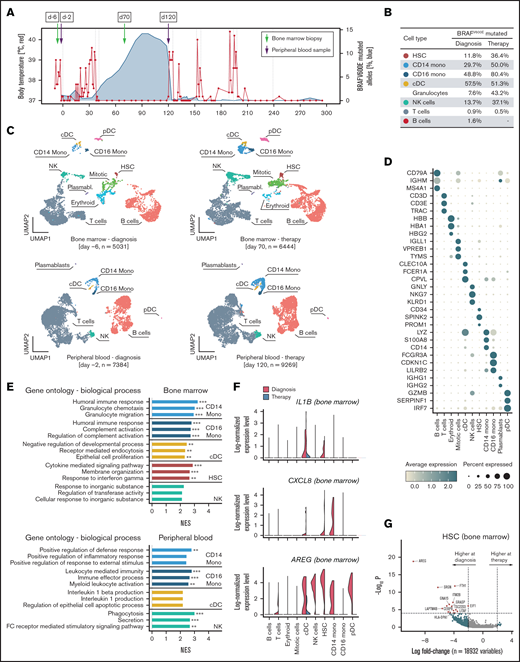
Next, we determined the frequency of BRAFV600E in different immune cell types in both bone marrow and peripheral blood at diagnosis and a timepoint during vemurafenib-induced clinical remission (but before salvage chemotherapy; Figure 2A). The mutation was present in all cellular subsets tested, although at much higher frequency in myeloid lineage cells (Figure 2B). Although BRAFV600E has also been described in CD19+ B lymphocytes24 and CD3+ lymphocytes,25 this is the first description of BRAFV600E in natural killer (NK) cells and granulocytes. Although this might be a rare finding, we found mutated granulocytes and NK cells in 2 other patients with LCH. (supplemental Figure 3). Finally, we performed single-cell RNA sequencing analysis of mononuclear cells of the bone marrow and peripheral blood at time of diagnosis and during treatment with vemurafenib. All major cell types were identified (Figure 2D), with some changes in cell number and gene expression profiles on clinical remission during treatment with vemurafenib (Figure 2C). To understand which biological mechanisms coincide with these changes, we identified genes downregulated during therapy and performed pathway enrichment analysis (Figure 2E), which showed pathways associated with inflammation, but not cell cycle or cell division–related pathways. Among the top regulated genes in the bone marrow, we observed downregulation of amphiregulin (AREG), which is expressed in inflammatory conditions,26 and CXCL8 and IL1B, which both are upregulated in LCH,20,27 illustrating broad anti-inflammatory effects of vemurafenib on immune cells in LCH beyond CD1A+CD207+ cells in this patient (Figure 2F-G).
Single-cell transcriptome analysis corroborate reduced inflammatory activity under vemurafenib. (A) Single-cell RNA sequencing (scRNA-seq) was performed on one peripheral blood sample and one bone marrow aspirate before and during therapy, respectively. (B) Percentage of mutated BRAF in fluorescence-activated cell sorted bone marrow cells at diagnosis and during therapy. (C) Uniform Manifold Approximation and Projection for Dimension Reduction (UMAP) visualization showing all the cells detected in the scRNA-seq dataset. Following quality control, the transcriptome of bone marrow aspirates at diagnosis (day −6; 5,031 cells) and during therapy (day 70; 6,444 cells), as well as peripheral blood samples at diagnosis (day −2; 7,384 cells) and during therapy (day 120; 9,269 cells), were analyzed. Cell types were annotated by mapping the cells on a reference dataset using the Azimuth pipeline and indicated in different colors. (D) Dot plot showing the expression of the top 3 expressed genes by cell types. Normalized mean expression across samples is indicated by color and the percentage of cells expressing the gene (>0) per cluster is indicated by dot size. (E) GSEA of genes downregulated during vemurafenib therapy compared with diagnosis. The top 3 Gene Ontology pathways ordered by normalized enrichment score (NES) are shown. *P < .1; **P < .05; ***P < .001. (F) Expression levels of AREG, IL1B, and CXCL8 in 11 475 bone marrow cells at time of diagnosis (red) and during vemurafenib-induced clinical remission (green). (G) Fold change (natural log) and P values (MAST test) of genes expressed in hematopoietic stem cells (HSCs) from bone marrow samples at diagnosis and during vemurafenib-induced clinical remission.
Single-cell transcriptome analysis corroborate reduced inflammatory activity under vemurafenib. (A) Single-cell RNA sequencing (scRNA-seq) was performed on one peripheral blood sample and one bone marrow aspirate before and during therapy, respectively. (B) Percentage of mutated BRAF in fluorescence-activated cell sorted bone marrow cells at diagnosis and during therapy. (C) Uniform Manifold Approximation and Projection for Dimension Reduction (UMAP) visualization showing all the cells detected in the scRNA-seq dataset. Following quality control, the transcriptome of bone marrow aspirates at diagnosis (day −6; 5,031 cells) and during therapy (day 70; 6,444 cells), as well as peripheral blood samples at diagnosis (day −2; 7,384 cells) and during therapy (day 120; 9,269 cells), were analyzed. Cell types were annotated by mapping the cells on a reference dataset using the Azimuth pipeline and indicated in different colors. (D) Dot plot showing the expression of the top 3 expressed genes by cell types. Normalized mean expression across samples is indicated by color and the percentage of cells expressing the gene (>0) per cluster is indicated by dot size. (E) GSEA of genes downregulated during vemurafenib therapy compared with diagnosis. The top 3 Gene Ontology pathways ordered by normalized enrichment score (NES) are shown. *P < .1; **P < .05; ***P < .001. (F) Expression levels of AREG, IL1B, and CXCL8 in 11 475 bone marrow cells at time of diagnosis (red) and during vemurafenib-induced clinical remission (green). (G) Fold change (natural log) and P values (MAST test) of genes expressed in hematopoietic stem cells (HSCs) from bone marrow samples at diagnosis and during vemurafenib-induced clinical remission.
Research on LCH has focused on CD1A+CD207+ cells, aiming to inhibit these “LCH cells” as a cure for patients with the disease. We provide a novel view on LCH by placing the spotlight on non-CD1A+CD207+ cells: BRAF-mutated cells present in peripheral blood and bone marrow. Extrapolating from the key observations in this prototypic analysis of one patient, we speculate that the CD1A+CD207+ cells are a differentiated end point that is the pathognomonic finding in LCH, but that BRAF-mutated blood cells need to be regarded as an important part of the disease. The clinically most detrimental effects of LCH are not the tissue lesions but the organ failure, caused by the BRAFV600E-harboring cells (or possibly by cells with other MAPK pathway mutations causing LCH). It will be necessary to validate this hypothesis in a large cohort, but the careful analysis of this patient provides a blueprint for further analyses within an international framework.
Acknowledgments
The authors thank the family of the patient who gave the permission to collect data and analyze biological samples, the Biomedical Sequencing Facility at the Research Center for Molecular Medicine of the Austrian Academy of Sciences (CeMM) for assistance with next-generation sequencing, Dieter Prinz and Julia Stemberger for flow cytometry support, Fikret Rifatbegovic for drawing the visual abstract, and Eva Krivec for technical support.
This work was funded by the St. Anna Kinderkrebsforschung.
Authorship
Contribution: S.K.E. performed bioinformatics and statistical analysis; R.S., G.A., P.B.S., F.H., S.K.E., and C.H. generated and analyzed data; A.A., M.M., C.H., and S.K.E. collected clinical data; and C.H. and S.K.E. wrote the manuscript.
Conflict-of-interest disclosure: The authors declare no competing financial interests.
Correspondence: Caroline Hutter, St. Anna Children’s Cancer Research Institute, Zimmermannplatz 10, 1090 Vienna, Austria; e-mail: caroline.hutter@stanna.at.
References
Author notes
S.K.E. and R.S. contributed equally to this study.
Processed single-cell RNA sequencing data are available via Gene Expression Omnibus (GEO), accession no. GSE175480.
The full-text version of this article contains a data supplement.


