Key Points
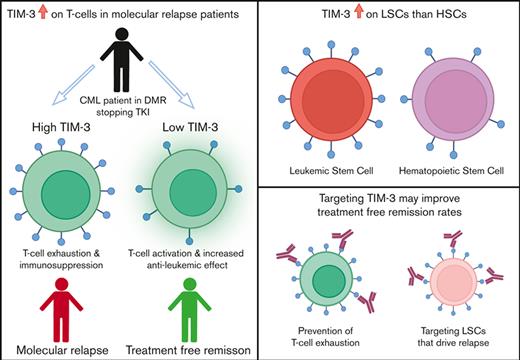
TIM-3 is the only immune-checkpoint receptor consistently overexpressed in patients with CML who relapse after TKI cessation.
Overexpression of TIM-3 provides a rationale to test TIM-3 inhibitors to modify treatment-free remission outcomes.
Abstract
Dysregulation of immune-checkpoint receptors has been reported at diagnosis of chronic myeloid leukemia (CML), however, their role in the maintenance of remission after tyrosine kinase inhibitor (TKI) cessation is unclear. We assessed programmed cell death-1 (PD-1), T-cell immunoglobulin, and mucin-domain containing protein-3 (TIM-3), cytotoxic T-lymphocyte–associated protein-4 (CTLA-4), lymphocyte-activation gene-3 (LAG-3), and T-cell immunoreceptor with immunoglobulin and immunoreceptor tyrosine-based inhibitory motif (ITIM) domains (TIGIT) expression on T-cell subsets, regulatory T cells (T-regs), and natural killer (NK) cells at the time of TKI cessation in 44 patients (22 patients sustained treatment-free remission [TFR] and 22 experienced molecular relapse [MolR]). We confirmed our previous finding that absolute numbers of T-regs are increased in patients who experienced MolR compared with those who sustained TFR. The immune-checkpoint receptors PD-1, CTLA-4, LAG-3, and TIGIT on T or NK cells were not differentially expressed between the MolR and TFR groups. However, TIM-3 was consistently upregulated on bulk T cells (CD3+) and T-cell subsets including, CD4+ T cells, CD8+ T cells, and T-regs, in patients who relapsed in comparison with those who maintained TFR after discontinuation. Furthermore, gene expression analysis from publicly available data sets showed increased TIM-3 expression on CML stem cells compared with normal hematopoietic stem cells. These findings suggest that among the targetable immune-checkpoint molecules, TIM-3 blockade may potentially improve effector immune response in patients with CML stopping TKI, while concomitantly targeting leukemic stem cells and could be a promising therapeutic strategy for preventing relapse after cessation of TKI in patients with CML.
Introduction
Treatment-free remission (TFR) is increasingly the goal of patients with chronic myeloid leukemia (CML) who achieve a sustained deep molecular response (DMR) on tyrosine kinase inhibitor (TKI) therapy.1 The immunological milieu at the time of TKI cessation plays a critical role in the success of TFR in CML. Several studies have found that natural killer (NK) cells are increased in TFR whereas immune suppressors, including regulatory T cells (T-regs), are reduced.2-5 Our group has previously demonstrated increased count of NK cells and concomitant decreased count of T-regs and monocytic myeloid-derived suppressor cells (MDSCs) at the time of TKI cessation in patients who achieved TFR compared with patients who relapsed. We developed an immune effector-suppressor score calculated using absolute counts of NK cells, T-regs, and MDSCs, which predicted TFR outcomes with 85% accuracy.6
Immune-checkpoint receptors have been shown to be dysregulated at CML diagnosis. Programmed cell death-1 (PD-1), cytotoxic T-lymphocyte–associated protein-4 (CTLA-4), T-cell immunoglobulin, and mucin-domain containing protein-3 (TIM-3), are overexpressed on T cells of patients with CML at diagnosis.7-9 Interestingly, lymphocyte-activation gene-3 (LAG-3) was expressed on fewer T cells in patients with CML compared with healthy individuals.7 Furthermore, LAG-3 was downregulated when patients achieved DMR on TKIs.10 NK-cell expression of T-cell immunoreceptor with immunoglobulin and immunoreceptor tyrosine-based inhibitory motif (ITIM) domains (TIGIT) is upregulated at CML diagnosis, with levels returning to those of healthy individuals with molecular response.11 Although patients with CML have demonstrable dysregulation of immune-checkpoint receptors on immune effector cells with recovery upon treatment, the influence of immune-checkpoint receptors on measurable residual disease at TKI cessation and their contribution to maintenance of TFR is poorly understood. We conducted a comprehensive assessment of immune-checkpoint receptors, including TIM-3, PD-1, CTLA-4, LAG-3, and TIGIT, in 44 patients with CML at the time of TKI cessation, and described their association with TFR outcomes.
Materials and methods
Patient samples
Cryopreserved peripheral blood mononuclear cells within 6 weeks before discontinuation of TKI from a cohort of nontrial patients at the Royal Adelaide Hospital and Flinders Medical Centre, from the Australasian Leukaemia and Lymphoma Group CML8 (TWISTER, ACTRN12606000118505) and CML10 (RESIST, ACTRN12610000055000) clinical studies, who were not assessed in previous studies,6 and within the TFR substudy of the CML11 (PINNACLE, NCT02001818) trial were used for immunophenotyping. The number of patients included in the trial was determined by sample availability. Deidentified healthy donor peripheral blood, with demographic information masked and unavailable complete blood counts, was obtained from the Australian Red Cross Blood Service. The study was approved by the institutional Human Research Ethics Committee and conducted in accordance with the Declaration of Helsinki. All participants gave written informed consent. Molecular relapse (MolR) was defined as loss of major molecular response (BCR::ABL1 > 0.1% IS).
Immune phenotyping
Antibodies were purchased from BD Biosciences, San Jose, California (supplemental Table 1). Cells were acquired on the BD FACSymphony-A5 and data were analyzed with FlowJo_v10.8. We performed immunophenotyping of TIM-3, PD-1, CTLA-4, LAG-3, and TIGIT on T cells, T-regs and NK cells (representative gating supplemental Figures 1 and 2).
Gene expression analysis
Processed and normalized TIM-3/HAVCR2 gene expression was extracted from 4 publicly available NCBI-GEO datasets12-15 (supplemental Table 2). For the single-cell GSE76312 data set expression was shown as single cells, or the single-cell data from each patient were averaged.
Statistical analysis
Differential protein expression was assessed using Mann-Whitney U test when 2 groups were compared or Kruskal-Wallis test when >2 groups were compared. Two-sided unpaired t test with Welch correction was used to compare gene expression in leukemia stem cells (LSCs) to hematopoietic stem cells (HSCs). Alpha was set at P < .05.
Results
Patient demographics
This study included a total of 44 patients in whom TKI therapy was ceased, the majority in whom imatinib (n = 22), followed by dasatinib (n = 12), and nilotinib (n = 10) were ceased. There was a bias toward more females (n = 26) in this study compared with males (n = 18), however the ratio of females to males was identical in the MolR and TFR groups (Table 1). The minimum follow-up duration for a patient to be categorized as TFR was 12 months, and the median follow-up duration was 26.6 months (Table 1). There were no significant differences in age at TKI discontinuation, duration of TKI therapy before cessation, or duration of MR4.0 (BCR::ABL1 IS ≤ 0.01% IS) before cessation between the patients in the MolR and TFR groups (Table 1). Among patients who relapsed, 11 of 22 (50%) relapsed within 6 months, 6 of 22 (27.2%) between 6 and 12 months, and 5 of 22 (22.7%) >1 year after stopping TKI.
Patient demographics at the time of TKI cessation
| Characteristics . | MolR (n = 22) . | TFR (n = 22) . |
|---|---|---|
| Drug at time of cessation, n (%) | ||
| Imatinib | 11 (50) | 11 (50) |
| Nilotinib | 3 (13.6) | 7 (31.8) |
| Dasatinib | 8 (36.4) | 4 (18.2) |
| Age at TKI discontinuation, median (range), y | 61 (35-81) | 60 (34-78) |
| Gender, female/male | 13/9 | 13/9 |
| Median duration (range) of TKI therapy before cessation, y | 5.4 (3.2-16.7) | 5.0 (3.0-16.6) |
| Median duration (range) of MR 4.0, y | 3.4 (2.0-13.2) | 4.2 (2.6-12.8) |
| Time to relapse, median (range), mo | 5.3 (2.3-33.6) | - |
| Duration of follow-up (in TFR), median (range), mo | - | 26.6 (12.0-188.0) |
There was no significant difference in age, duration of TKI therapy, or median duration of MR 4.0 (BCR::ABL1 IS ≤ 0.01%) between the MolR and TFR groups.
TIM-3 was elevated at TKI cessation in patients who experienced MolR compared with patients who achieved TFR
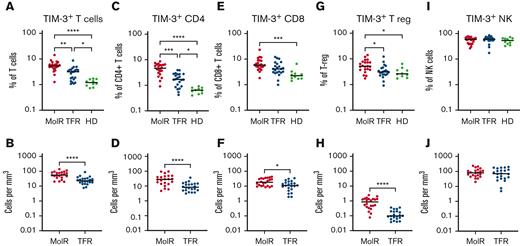
TIM-3 was overexpressed on T cells (CD3+) in the patients in the MolR group (n = 22) compared with those in the TFR group (n = 22, P = .002) as well as in healthy donors (n = 10, P < .0001, Figure 1A). Patients in the TFR group had higher expression of TIM-3 compared with healthy donors (P = .04, Figure 1A). The absolute counts of TIM3+ T cells were also significantly higher in the patients in the MolR group than those in the TFR group (P < .0001, Figure 1B). We observed higher TIM-3 expression on CD4+ T cells in the patients in the MolR group than those in the TFR group (P = .0006) and in healthy donors (P < .0001, Figure 1C), and the patients in the TFR group had higher expression than healthy donors (P = .036, Figure 1C). Absolute counts of TIM-3+CD4+ T cells were significantly higher in the patients in the MolR group than patients in the TFR group (P < .0001, Figure 1D). Within the CD8+T-cell compartment TIM-3 was higher in the patients in MolR group than in healthy donors (P = .0002, Figure 1E) and absolute counts of TIM-3+CD8+ T cells were higher in the patients in MolR group than those in the TFR group (P = .013, Figure 1F). T-regs from patients who experienced MolR expressed significantly more TIM-3 than those from the patients in the TFR group (P = .016) and from healthy donors (P = .014, Figure 1G). The absolute count of TIM-3+ T-regs was higher in the patients in MolR group (P < .0001, Figure 1H). We did not observe any difference in TIM-3 expression on NK cells (Figures 1I-J).
TIM-3 expression on T cells, T-regs, and NK cells in patients with CML and in healthy donors. (A) TIM-3 expression as a proportion of T cells was significantly higher in patients who experienced MolR compared with those who experienced TFR. Healthy donors (HD) had significantly lower TIM-3 expression compared with both patients in MolR and TFR groups. (B) Absolute number of TIM-3+ T cells was higher in the patients in MolR group than those in the TFR group (C) TIM-3 expression as a proportion of CD4+T cells was higher in MolR group than in TFR group and the expression was higher in both groups compared with HD. (D) Absolute number of TIM-3+CD4+ T cells was higher in the patients in MolR group than that in patients in the TFR group. (E) TIM-3 as a proportion of CD8+T cells was higher in the patients in MolR group than in HD. (F) The Absolute counts of CD8+T cells was higher in the MolR group. (G) T-regs of patients in the MolR group had higher TIM-3 expression than T-regs of patients in TFR group and HD T-regs. There was no difference between the patients in TFR group and HD. (H) Absolute number of T-regs were higher in patients in the MolR group. There was no difference in TIM-3 expression on NK cells either (I) as a proportion of NK cells or (J) absolute number of TIM-3+ NK cells. The Mann-Whitney test was used to compare the 2 groups, whereas multiple comparisons were made using the Kruskal-Wallis test; alpha was set at 0.05 (adjusted for multiple comparisons), ∗∗∗∗P < .0001, ∗∗∗P < .001, ∗∗P < .01. ∗P < .05.
TIM-3 expression on T cells, T-regs, and NK cells in patients with CML and in healthy donors. (A) TIM-3 expression as a proportion of T cells was significantly higher in patients who experienced MolR compared with those who experienced TFR. Healthy donors (HD) had significantly lower TIM-3 expression compared with both patients in MolR and TFR groups. (B) Absolute number of TIM-3+ T cells was higher in the patients in MolR group than those in the TFR group (C) TIM-3 expression as a proportion of CD4+T cells was higher in MolR group than in TFR group and the expression was higher in both groups compared with HD. (D) Absolute number of TIM-3+CD4+ T cells was higher in the patients in MolR group than that in patients in the TFR group. (E) TIM-3 as a proportion of CD8+T cells was higher in the patients in MolR group than in HD. (F) The Absolute counts of CD8+T cells was higher in the MolR group. (G) T-regs of patients in the MolR group had higher TIM-3 expression than T-regs of patients in TFR group and HD T-regs. There was no difference between the patients in TFR group and HD. (H) Absolute number of T-regs were higher in patients in the MolR group. There was no difference in TIM-3 expression on NK cells either (I) as a proportion of NK cells or (J) absolute number of TIM-3+ NK cells. The Mann-Whitney test was used to compare the 2 groups, whereas multiple comparisons were made using the Kruskal-Wallis test; alpha was set at 0.05 (adjusted for multiple comparisons), ∗∗∗∗P < .0001, ∗∗∗P < .001, ∗∗P < .01. ∗P < .05.
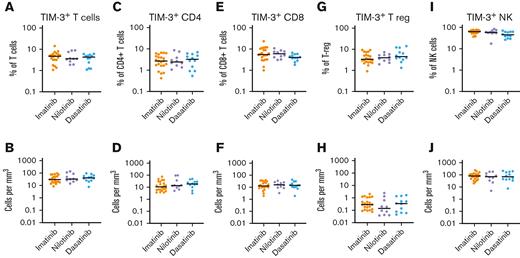
We examined whether TIM-3 expression was influenced by the TKI at the time of cessation. TIM-3 expression on bulk T cells (CD3+), CD4+ T cells, CD8+ T cells, T-regs, or NK cells, either as percentage or absolute counts, were not different among patients treated with imatinib, nilotinib, and dasatinib (Figure 2).
TIM-3 expression in patients treated with imatinib, nilotinib, or dasatinib. There was no significant difference in the expression of TIM-3 among patients treated with imatinib, nilotinib, or dasatinib in T cells, CD4+T-cells, CD8+ T cells, T-regs or NK cells either as a proportion of T cells (A,C,E,G,I respectively) or absolute counts (B,D,F,H,J respectively). The Kruskal-Wallis test was used to compare groups; alpha was set at 0.05 (adjusted for multiple comparisons).
TIM-3 expression in patients treated with imatinib, nilotinib, or dasatinib. There was no significant difference in the expression of TIM-3 among patients treated with imatinib, nilotinib, or dasatinib in T cells, CD4+T-cells, CD8+ T cells, T-regs or NK cells either as a proportion of T cells (A,C,E,G,I respectively) or absolute counts (B,D,F,H,J respectively). The Kruskal-Wallis test was used to compare groups; alpha was set at 0.05 (adjusted for multiple comparisons).
PD-1 expression at the time of TKI cessation was not different between patients who experienced MolR and those who sustained TFR
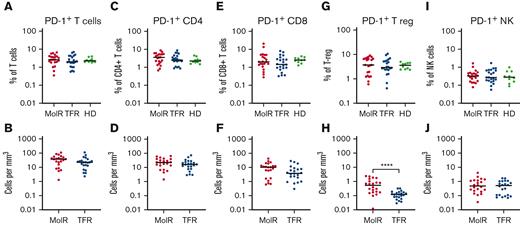
We did not observe a difference in PD-1 expression between patients who experienced MolR and those who sustained TFR on bulk CD3+, CD4+, or CD8+ T cells either as a percentage or as absolute counts of PD-1+ cells (Figures 3A-F). PD-1 was not differentially expressed on T-regs, but absolute numbers of PD-1+ T-regs were significantly higher in the patients in the MolR group than those in the TFR group (P < .0001, Figures 3G-H). NK cells did not have any differences in PD-1 expression (Figures 3I-J). PD-1 expression in healthy donors was not different from that measured in patients who experienced MolR and those who sustained TFR in any of the populations studied.
PD-1 expression on T-cells, T-regs and NK cells in patients with CML and in HD. PD-1 expression on T cells was not different between the MolR, TFR, or healthy donor (HD) groups either (A) as a percentage of T cells or (B) absolute counts. Similarly, there were no differences observed in (C) percentage of CD4+T cells, (D) absolute counts of PD-1+CD4+T cells, (E) percentage of CD8+T cells or (F) absolute counts of PD-1+CD8+T cells. (G) PD-1 expression as a percentage of T-regs was not different between the groups. (H) However, the absolute count of PD-1+T-regs was significantly higher in the patients in MolR group than in those in the TFR group. There was no difference in PD-1 expression on NK cells either (I) as a percentage of NK cells or (J) absolute counts. The Mann-Whitney test was used to compare 2 groups, whereas multiple comparisons were made using the Kruskal-Wallis test; alpha was set at 0.05 (adjusted for multiple comparisons).
PD-1 expression on T-cells, T-regs and NK cells in patients with CML and in HD. PD-1 expression on T cells was not different between the MolR, TFR, or healthy donor (HD) groups either (A) as a percentage of T cells or (B) absolute counts. Similarly, there were no differences observed in (C) percentage of CD4+T cells, (D) absolute counts of PD-1+CD4+T cells, (E) percentage of CD8+T cells or (F) absolute counts of PD-1+CD8+T cells. (G) PD-1 expression as a percentage of T-regs was not different between the groups. (H) However, the absolute count of PD-1+T-regs was significantly higher in the patients in MolR group than in those in the TFR group. There was no difference in PD-1 expression on NK cells either (I) as a percentage of NK cells or (J) absolute counts. The Mann-Whitney test was used to compare 2 groups, whereas multiple comparisons were made using the Kruskal-Wallis test; alpha was set at 0.05 (adjusted for multiple comparisons).
Coexpression of PD-1 and TIM-3 on T-cell subsets at the time of TKI cessation
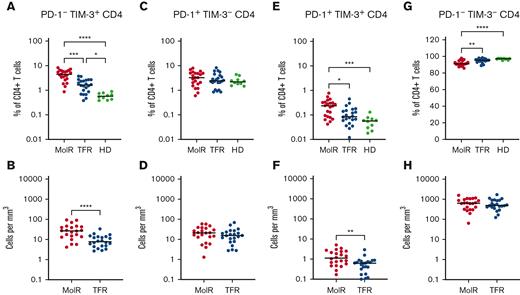
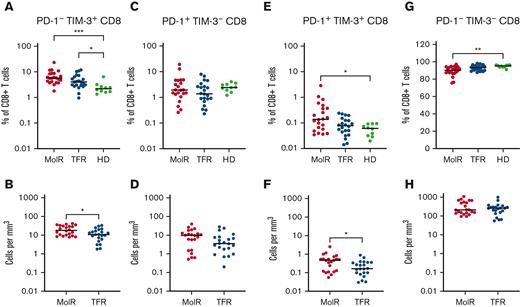
CD4+ and CD8+ T cells were divided into subsets based on the expression patterns of PD-1 and TIM-3. PD-1−TIM-3+ expression was higher in the patients in the MolR and TFR groups than in the healthy donor group in CD4+ (P = .0002 and P < .0001, respectively, Figure 4A) as well as CD8+T cells (P = .041 and P = .046, respectively Figure 5A). Patients who experienced MolR had a higher percentage of PD-1−TIM-3+CD4+ T cells (P = .0005, Figure 4A) than in patients who sustained TFR. The absolute counts of PD-1−TIM-3+CD4+ T cells (P < .0001, Figure 4B) and PD-1−TIM-3+CD8+ T cells (P = .024, Figure 5B) were significantly higher in patients who experienced MolR than in patients who sustained TFR. There were no differences in PD-1+TIM-3−CD4+ or CD8+ T cells (Figures 4C-D and 5C-D) between patients who experienced MolR and those who sustained TFR, or healthy donors. PD-1 and TIM-3 double positive cells were significantly higher in patients in the MolR group than in healthy donors within the CD4+ (P = .0003, Figure 4E) and CD8+ (P = .021, Figure 5E) subsets. Double positive CD4+ cells were also higher in patients in the MolR group than in patients in the TFR group (P = .04, Figure 4E). The absolute count of double positive CD4+ (P = .004, Figure 4F) and CD8+ (P = .02, Figure 5F) T cells was higher in patients in the MolR group than in those in the TFR group. We observed a reciprocal decrease in double negative cells in patients in the MolR group compared with that in healthy donors in both CD4+ (P < .0001, Figure 4G) and CD8+ (P = .002, Figure 5G) subsets. CD4+PD-1−TIM-3− cells were also lower in the patients in MolR group than in those in the TFR group (P = .008, Figure 4G). However, there was no difference in the absolute counts of double negative CD4+ or CD8+ cells between patients who experienced MolR and those who sustained TFR (Figures 4H and 5H).
Coexpression of TIM-3 and PD-1 on CD4+T-cells in patients with CML and in HD. (A) PD-1−TIM-3+CD4+ T cells as a percentage of CD4+ T cells were significantly higher in both the patients in MolR group and those in TFR group than in healthy donors (HD). Furthermore, the HD had lower expression of TIM-3 than patients in the TFR group. (B) The absolute counts of PD-1−TIM-3+CD4+ T cells was higher in patients in the MolR group than those in the TFR group. (C) PD-1+TIM-3−CD4+ T cells as percentage of CD4+ T cells or (D) absolute counts of PD-1+TIM-3−CD4+ T cells were not different between the groups. (E) PD-1+TIM-3+CD4+ T cells as a percentage of CD4+ T cells was higher in the patients who experienced MolR than in those with sustained TFR and in HD. (F) Absolute counts of PD-1+TIM-3+CD4+ T cells were significantly higher in the MolR group compared with the TFR group. (G) Conversely, PD-1−TIM-3−CD4+ T cells were significantly lower in the MolR group compared with both the TFR and HD group. (H) There was no difference in the absolute counts of PD-1−TIM-3−CD4+ T cells. The Mann-Whitney test was used to compare 2 groups, whereas multiple comparisons were made using the Kruskal-Wallis test; alpha was set at 0.05 (adjusted for multiple comparisons).
Coexpression of TIM-3 and PD-1 on CD4+T-cells in patients with CML and in HD. (A) PD-1−TIM-3+CD4+ T cells as a percentage of CD4+ T cells were significantly higher in both the patients in MolR group and those in TFR group than in healthy donors (HD). Furthermore, the HD had lower expression of TIM-3 than patients in the TFR group. (B) The absolute counts of PD-1−TIM-3+CD4+ T cells was higher in patients in the MolR group than those in the TFR group. (C) PD-1+TIM-3−CD4+ T cells as percentage of CD4+ T cells or (D) absolute counts of PD-1+TIM-3−CD4+ T cells were not different between the groups. (E) PD-1+TIM-3+CD4+ T cells as a percentage of CD4+ T cells was higher in the patients who experienced MolR than in those with sustained TFR and in HD. (F) Absolute counts of PD-1+TIM-3+CD4+ T cells were significantly higher in the MolR group compared with the TFR group. (G) Conversely, PD-1−TIM-3−CD4+ T cells were significantly lower in the MolR group compared with both the TFR and HD group. (H) There was no difference in the absolute counts of PD-1−TIM-3−CD4+ T cells. The Mann-Whitney test was used to compare 2 groups, whereas multiple comparisons were made using the Kruskal-Wallis test; alpha was set at 0.05 (adjusted for multiple comparisons).
Coexpression of TIM-3 and PD-1 on CD8+T cells in patient with CML and in HD. (A) PD-1−TIM-3+CD8+ T cells as a percentage of CD8+ T cells were significantly higher in both the patients in the MolR group and those in the TFR group compared with healthy donors (HD). (B) The absolute counts of PD-1−TIM-3+CD8+ T cells was higher in patients in the MolR group compared with those in the TFR group. (C) PD-1+TIM-3−CD8+ T cells as percentage of CD8+ T cells or (D) absolute counts of PD-1+TIM-3−CD8+ T cells were not different between the groups. (E) PD-1+TIM-3+CD8+ T cells as a percentage of CD8+ T cells was higher in patients in the MolR group compared with HD. (F) Absolute counts of PD-1+TIM-3+CD8+ T cells were higher in patients in the MolR group. (G) Conversely, PD-1−TIM-3−CD8+ T cells were significantly lower in patients in the MolR group than in the HD group. (H) There was no difference in the absolute counts of PD-1−TIM-3−CD8+ T cells. The Mann-Whitney test was used to compare 2 groups, whereas multiple comparisons were made using the Kruskal-Wallis test; alpha was set at 0.05 (adjusted for multiple comparisons).
Coexpression of TIM-3 and PD-1 on CD8+T cells in patient with CML and in HD. (A) PD-1−TIM-3+CD8+ T cells as a percentage of CD8+ T cells were significantly higher in both the patients in the MolR group and those in the TFR group compared with healthy donors (HD). (B) The absolute counts of PD-1−TIM-3+CD8+ T cells was higher in patients in the MolR group compared with those in the TFR group. (C) PD-1+TIM-3−CD8+ T cells as percentage of CD8+ T cells or (D) absolute counts of PD-1+TIM-3−CD8+ T cells were not different between the groups. (E) PD-1+TIM-3+CD8+ T cells as a percentage of CD8+ T cells was higher in patients in the MolR group compared with HD. (F) Absolute counts of PD-1+TIM-3+CD8+ T cells were higher in patients in the MolR group. (G) Conversely, PD-1−TIM-3−CD8+ T cells were significantly lower in patients in the MolR group than in the HD group. (H) There was no difference in the absolute counts of PD-1−TIM-3−CD8+ T cells. The Mann-Whitney test was used to compare 2 groups, whereas multiple comparisons were made using the Kruskal-Wallis test; alpha was set at 0.05 (adjusted for multiple comparisons).
CTLA-4, LAG-3, and TIGIT expression was not different between patients who experienced MolR and those who sustained TFR
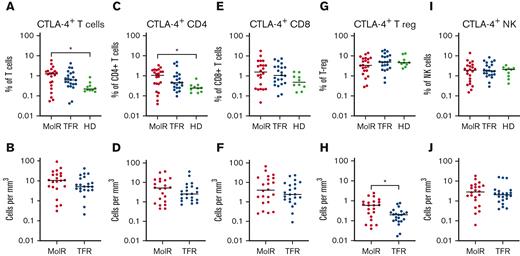
CTLA-4 as a percentage of bulk T cells (P = .012) and CD4+ T cells (P = .025) was significantly higher in patients in the MolR group than in the healthy donor group (Figure 6A,C), whereas the percentage of CD8+ T cells was not different in patients in the MolR group compared with that in healthy donors (Figure 6E). There was no difference in the absolute counts of CTLA-4+CD3+, CD4+, or CD8+ T cells (Figure 6B,D,F) between patients who experienced MolR and those who sustained TFR. The percentage of CTLA-4+ T-regs was not different (Figure 6G), but the absolute count of CTLA-4+ T-regs was higher in the patients in MolR group (Figure 6H) compared with those in the TFR group. We did not observe a difference between CTLA-4 expression on NK cells in patients who experienced MolR and those who sustained TFR (Figure 6I-J).
CTLA-4 expression on T cells, T-regs and NK cells in patients with CML and in healthy donors. (A) PD-1 expression on T cells was significantly higher in patients in the MolR group compared with healthy donors (HD). Expression in the TFR group was not different to patients in the MolR group or HD. (B) Absolute counts of CTLA-4+ T cells were not different between MolR and TFR patients. (C) CTLA-4 as a percentage of CD4+ T cells was higher in patients in the MolR group compared with the HD group. (D) There was no difference in the absolute counts of CTLA-4+CD4+ T cells between MolR and TFR patients. CTLA-4 expression on CD8+ T cells was not different either (E) as a percentage of CD8+ T cells or (F) absolute counts of CTLA-4+CD8+ T cells. (G) CTLA-4 expression as a percentage of T-regs was not different between the groups. (H) However, the absolute count of CTLA-4+ T-regs was significantly higher in patients in the MolR group compared with patients in the TFR group. There was no difference in CTLA-4 expression on NK cells either (I) as a percentage of NK cells or (J) absolute counts. The Mann-Whitney test was used to compare 2 groups, whereas multiple comparisons were made using the Kruskal-Wallis test; alpha was set at 0.05 (adjusted for multiple comparisons).
CTLA-4 expression on T cells, T-regs and NK cells in patients with CML and in healthy donors. (A) PD-1 expression on T cells was significantly higher in patients in the MolR group compared with healthy donors (HD). Expression in the TFR group was not different to patients in the MolR group or HD. (B) Absolute counts of CTLA-4+ T cells were not different between MolR and TFR patients. (C) CTLA-4 as a percentage of CD4+ T cells was higher in patients in the MolR group compared with the HD group. (D) There was no difference in the absolute counts of CTLA-4+CD4+ T cells between MolR and TFR patients. CTLA-4 expression on CD8+ T cells was not different either (E) as a percentage of CD8+ T cells or (F) absolute counts of CTLA-4+CD8+ T cells. (G) CTLA-4 expression as a percentage of T-regs was not different between the groups. (H) However, the absolute count of CTLA-4+ T-regs was significantly higher in patients in the MolR group compared with patients in the TFR group. There was no difference in CTLA-4 expression on NK cells either (I) as a percentage of NK cells or (J) absolute counts. The Mann-Whitney test was used to compare 2 groups, whereas multiple comparisons were made using the Kruskal-Wallis test; alpha was set at 0.05 (adjusted for multiple comparisons).
LAG-3 expression was not different on bulk, CD4+, or CD8+ T cells either as a percentage or as absolute counts (supplemental Figure 3A-F) between patients who experienced MolR and those who sustained TFR. Healthy donors expressed significantly more LAG-3 on T-regs and NK cells than the patients who experienced MolR (P = .0013 and P = .0094 respectively, supplemental Figure 3G,I). The absolute count of LAG-3+ T-regs was significantly higher in patients in the MolR group than the TFR group (P = .0038, supplemental Figure 3H).
TIGIT expression as a percentage of T cells, NK cells, or T-regs was not different between patients who experienced MolR and those who sustained TFR, and healthy donors (supplemental Figure 4). The absolute counts of TIGIT+ T cells, CD4+ T cells, CD8+ T cells, or NK cells were not different between patients who experienced MolR and those who sustained TFR. TIGIT+ T-regs were increased in the patients in MolR group compared with the patients in the TFR group (P = .0003, supplemental Figure 4H).
Gene expression analysis revealed overexpression of TIM-3 on CML-LSCs compared with healthy donor HSCs
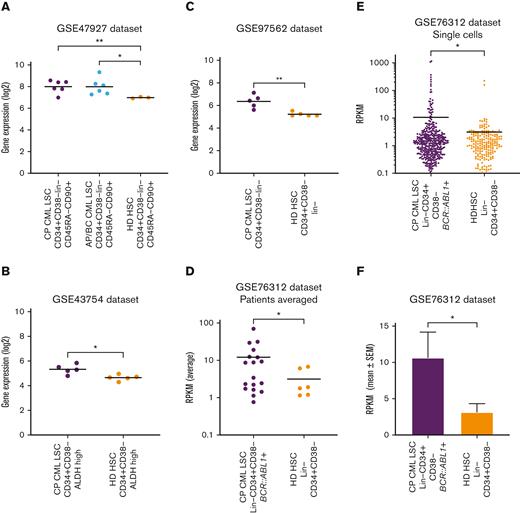
Gene expression of HAVCR2 (TIM-3) in CML-LSCs and healthy donor HSCs was assessed using publicly available datasets. HAVCR2 was significantly higher in chronic phase CML (CP-CML, P = .008) and accelerated phase or blast crisis LSCs (P = .023) than in healthy donor HSCs in the GSE47927 dataset (Figure 7A). Similarly, LSCs from patients with CP-CML had significantly higher HAVCR2 expression than healthy donor HSCs in the GSE43754 (P = .013), GSE97562 (P = .009), and the GSE76312 (P = .045) datasets (Figures 7B-D). Furthermore, within the GSE76312 dataset, single-cell gene expression analysis revealed significantly higher HAVCR2 expression in CP-CML-LSCs than in healthy donor HSCs (P = .046, Figures 7E-F).
TIM-3 gene expression in leukemic stem cells vs normal HSCs. (A) Comparison of HAVCR2 (TIM-3) gene expression in CP-CML-LSC (n = 6), Accelerated phase/Blast crisis (AP/BC) LSC (n = 6) and healthy donor (HD) HSCs (n = 3) using the GSE47927 dataset. CML-LSC samples were derived from CP, AP, and BC at diagnosis and sorted based on CD34+CD38−Lin−CD45RA−CD90+. The HD-HSC was based on the same markers as LSC. (B) Comparison of HAVCR2 gene expression in CP-CML-LSC (n = 5) and HD-HSC (n = 5) using the GSE43754 dataset. CML-LSC samples were derived from CP at diagnosis and sorted based on CD34+CD38−ALDH high. The HD-HSC was based on the same markers as LSC. (C) Comparison of HAVCR2 gene expression in CP-CML-LSC (n = 5) and HD-HSC (n = 5) using the GSE97562 data set. CML-LSC samples were derived from CP at diagnosis and sorted based on CD34+CD38−lin−. The HD-HSC was based on the same markers as LSC. (D) Comparison of HAVCR2 gene expression in CP-CML-LSC (n = 18) and HD-HSC (n = 6) using the GSE76312 data set. CML-LSC samples were derived from CP at diagnosis and sorted based on Lin−CD34+CD38−. The HD-HSC was based on the same markers as LSC. Each dot represents average reads per kilobase of exon per million reads mapped (RPKM) from the single cells profiled for each patient. (E) The comparison of HAVCR2 gene expression of each single cells derived from 18 CP-CML-LSC single cells and 6 HD-HSC using GSE76312 data set. Total of 477 single cells in CML-LSC and 232 single cells in HD-HSC. TIM-3 expression was summarized in average RPKM for CML-LSC and HD-HSC as bar plot shown in panel F. All of the statistical analyses were performed using 2-sided unpaired t test with Welch correction.
TIM-3 gene expression in leukemic stem cells vs normal HSCs. (A) Comparison of HAVCR2 (TIM-3) gene expression in CP-CML-LSC (n = 6), Accelerated phase/Blast crisis (AP/BC) LSC (n = 6) and healthy donor (HD) HSCs (n = 3) using the GSE47927 dataset. CML-LSC samples were derived from CP, AP, and BC at diagnosis and sorted based on CD34+CD38−Lin−CD45RA−CD90+. The HD-HSC was based on the same markers as LSC. (B) Comparison of HAVCR2 gene expression in CP-CML-LSC (n = 5) and HD-HSC (n = 5) using the GSE43754 dataset. CML-LSC samples were derived from CP at diagnosis and sorted based on CD34+CD38−ALDH high. The HD-HSC was based on the same markers as LSC. (C) Comparison of HAVCR2 gene expression in CP-CML-LSC (n = 5) and HD-HSC (n = 5) using the GSE97562 data set. CML-LSC samples were derived from CP at diagnosis and sorted based on CD34+CD38−lin−. The HD-HSC was based on the same markers as LSC. (D) Comparison of HAVCR2 gene expression in CP-CML-LSC (n = 18) and HD-HSC (n = 6) using the GSE76312 data set. CML-LSC samples were derived from CP at diagnosis and sorted based on Lin−CD34+CD38−. The HD-HSC was based on the same markers as LSC. Each dot represents average reads per kilobase of exon per million reads mapped (RPKM) from the single cells profiled for each patient. (E) The comparison of HAVCR2 gene expression of each single cells derived from 18 CP-CML-LSC single cells and 6 HD-HSC using GSE76312 data set. Total of 477 single cells in CML-LSC and 232 single cells in HD-HSC. TIM-3 expression was summarized in average RPKM for CML-LSC and HD-HSC as bar plot shown in panel F. All of the statistical analyses were performed using 2-sided unpaired t test with Welch correction.
Discussion
Immune-checkpoint receptors have been implicated in immune dysfunction at CML diagnosis as well as during immune recovery and DMR achievement.8,16 To the best of our knowledge, we present the first report of comprehensive immune-checkpoint receptor analysis at the time of TKI cessation and its association with TFR outcome.
We observed overexpression of TIM-3, at TKI cessation, on T cells and T-cell subsets including helper-CD4+, cytotoxic-CD8+, and T-regs in patients who experienced MolR compared with patients who sustained TFR. TIM-3 is an immune-checkpoint receptor which functions to temper immune responses and has been associated with dysfunctional T cells in cancer.17 Loss of function of the HAVCR2 (TIM-3) gene can lead to a proinflammatory milieu leading to proliferation of T cells and is associated with development of subcutaneous panniculitis–like T-cell lymphoma.18,19 However, prolonged TIM-3 signaling leads to suppression of T-cell function and immune dysfunction.20 TIM-3 expression on T cells of patients with CML, irrespective of subsequent MolR or TFR status, was significantly higher than that of healthy donors. This finding is consistent with reports of increased TIM-3 expression on T cells in other neoplasms, including in colon cancer21 and breast cancer22 compared with that of healthy donors. Increased TIM-3 expression has been found in tumor tissues in several malignancies, including diffuse large B-cell lymphoma23 and head and neck cancer.24 Moreover, several studies have shown that TIM-3 expression is associated with T-cell dysfunction in the context of chronic viral infection and cancer.25,26 Expression of TIM-3, along with PD-1 and LAG-3, on CD4+ T cells is associated with an exhausted phenotype in acute myeloid leukemia (AML).27 Furthermore, increased TIM-3 expression correlates with poor outcomes for patients with colorectal cancers and hepatocellular carcinoma.21,28 There was no difference between NK-cell TIM-3 expression in patients with CML and in healthy donors, which is in keeping with data from patients with cervical cancer29 and melanoma26. We speculate that higher TIM-3 expression on T cells may contribute to a dysfunctional immune response, after TKI cessation, resulting in failure of immune surveillance, immune escape of residual leukemic cells, and relapse in these patients.
TIM-3 is coexpressed with PD-1, and TIM-3 PD-1 double positive T cells have been shown to be more dysfunctional than PD-1+TIM-3− and PD-1−TIM-3− T cells.25 In addition, a higher proportion of PD-1+TIM3−CD8+ T cells have been associated with decreased probability of achieving MR4 in patients with CML on TKI therapy.7 We found higher PD-1−TIM-3+ and PD-1+TIM-3+ expression on CD4+T cells in the patients in the relapse group compared with those in the TFR group. The absolute counts of PD-1−TIM-3+ and PD-1+TIM-3+ cells were higher in the CD4+ as well as the CD8+ T-cell compartments of patients who experienced MolR compared to those in the TFR group. Interestingly, we found no difference in PD-1 expression on CD3+, CD8+, or CD4+ T cells between patients who experienced TFR and those who experienced MolR. There was no difference in PD-1+TIM-3− CD4+ or CD8+ T cells between the groups, suggesting that TIM-3 is the major checkpoint inhibitor associated with TFR outcome.
CTLA-4 has a well-documented role in immune evasion in cancer,30 and is upregulated in CML.7 CTLA-4 expression on T cells was not different between patients in the MolR and the TFR groups. In malignancies, LAG-3 overexpression is generally associated with immune exhaustion and impaired immune function.31 Patients achieving DMR on TKI had lower LAG-3 compared with those not achieving DMR.10 We did not observe differences in LAG-3 expression on T cells between patients who experienced MolR and those who sustained TFR. TIGIT expression is correlated with NK-cell function32 and is higher on mature NK cells in patients with CML.11 Our data did not show a difference in TIGIT expression in any of the populations studied between patients who experienced MolR and those who sustained TFR. None of the checkpoint receptors were differentially expressed on NK cells between the patients in the MolR and TFR groups, suggesting that NK-cell function in the context of TFR is not mediated through these receptors.
TIM-3 expression on T-regs was increased in patients in the MolR group than in those in the TFR group. However, there was no difference in the percentage of T-regs expressing PD-1, CTLA-4, LAG-3, or TIGIT between the 2 cohorts. The absolute count of TIM-3+, PD-1+, CTLA-4+, LAG-3+, and TIGIT+ T-regs was significantly higher in patients in the MolR group than those patients in the TFR group. In keeping with our previous study,6 we observed increased absolute counts of T-regs in patients in the MolR group (supplemental Figure 5). This would in part explain the significant difference between the MolR and TFR cohorts in the absolute count of checkpoint receptor–positive T-regs, which are a subset of the total T-reg population. Significantly greater numbers of T-regs with higher expression of immune-checkpoint molecules TIM-3, PD-1, CTLA-4, LAG-3, and TIGIT suggests that T-regs in the patients who experienced MolR have a more suppressive phenotype.
TIM-3 was consistently upregulated in patients in the MolR group on all T-cell populations studied. TIM-3 overexpression has been associated with immune suppression through increase in MDSCs.33 We have previously shown an increase in MDSCs in patients who experienced MolR.6 TIM-3 overexpression on T cells in patient with CML may contribute to an increase in MDSCs, resulting in an immunosuppressive environment. We did not observe differences in the other checkpoint receptors studied, including PD-1 and CTLA-4. Thus, of the targetable immune-checkpoint molecules, TIM-3 is the most promising candidate for blockade to reduce the incidence of relapse after TKI cessation.
The LSCs in patients with AML have high expression of TIM-3 compared with healthy donor HSCs,34-37 which may be an additional target of TIM-3 inhibition.38,39 We investigated HAVCR2 (TIM-3) gene expression on CML-LSCs compared with healthy donor HSCs using publicly available datasets. TIM-3 was consistently overexpressed in a subset of CML-LSCs compared with HSCs, while using a variety of stem cell phenotypes for characterization. The function of TIM-3 in CML-LSCs is poorly understood, but TIM-3 is overexpressed on stem cells in patients with AML34,35 and has been implicated in maintenance of AML-LSCs.40 This raises the possibility that TIM-3 inhibition may have a dual role in promoting TFR in patients with CML, firstly, targeting LSCs that drive relapse, and secondly preventing checkpoint inhibition of T cells. TIM-3 inhibitors have induced remission in patients with AML by reducing TIM-3 expression on effector and tumor cells,41 and may be a viable therapeutic strategy to improve the probability of TFR in patients with CML who are otherwise more likely to relapse.
Acknowledgments
The authors thank the staff at the ACRF Innovative Cancer Imaging and Therapeutics Facility. The visual abstract was created using BioRender.com.
The authors acknowledge grant support from the Australian National Health and Medical Research Council (GPP1138935).
Authorship
Contribution: Y.D.I. performed research, analyzed the data, and wrote the manuscript; C.H.K., J.C., and N.S. performed research and analyzed the data; S.B., D.T.Y., D.M.R., and T.P.H. critically revised the manuscript; and A.S.M.Y. designed the study, analyzed the data, and wrote the manuscript.
Conflict-of-interest disclosure: D.T.Y. has received research funding from Novartis and Bristol Myers Squibb (BMS) and honoraria from Pfizer, Amgen, Novartis, and BMS. D.M.R. has received research funding from Novartis and Celgene and honoraria from Novartis, BMS, and Takeda. T.P.H. acted as a consultant or adviser to and received research funding and honoraria from Novartis, BMS, and Enliven; A.S.M.Y. received research funding from Novartis, BMS, and Celgene, honoraria from Novartis and BMS, and is a member of the advisory board of Novartis. S.B. is a member of the advisory boards of Qiagen, Novartis, and Cepheid, received honoraria from Qiagen, Novartis, BMS, and Cepheid, and research funding from Novartis and Cepheid. The remaining authors declare no competing financial interests.
Correspondence: Agnes S. M. Yong, SAHMRI Level 5 North, Precision Medicine Theme, PO Box 11060, Adelaide, SA 5001, Australia; e-mail: agnes.yong@sahmri.com; and Yazad D. Irani, SAHMRI Level 5 North, Precision Medicine Theme, PO Box 11060, Adelaide, SA 5001, Australia; e-mail: yazad.irani@sahmri.com.
References
Author notes
Data are available on request from the corresponding author, Yazad Irani (yazad.irani@sahmri.com).
The full-text version of this article contains a data supplement.

