Key Points
Exposure of MSCs to B-ALL cell lines triggers CAF formation.
The proximate trigger for CAF formation is ALL-derived mitochondrial dsRNA.
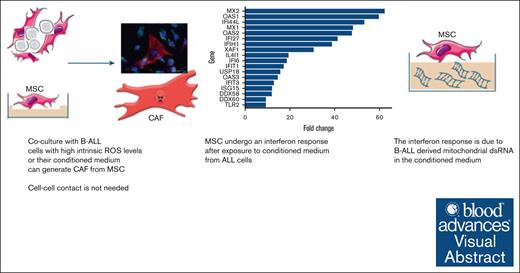
Visual Abstract
Cancer-associated fibroblasts (CAFs) arising from bone marrow–derived mesenchymal stromal cells (MSCs) are prominent in B-cell precursor acute lymphoblastic leukemia (B-ALL). We have previously shown that CAF formation is triggered by exposure to reactive oxygen species–inducing chemotherapy and that CAFs support chemoresistance by donating mitochondria to the cancer cells through tunneling nanotubes. In the present study, we show that exposure of MSCs to ALL cell lines, patient-derived xenografts, and primary cells or their conditioned media can also trigger CAF formation. Using bulk RNA sequencing in cell lines, we show that the MSC to CAF transition is accompanied by a robust interferon pathway response, and we have validated this finding in primary cells. Using confocal microscopy and flow cytometry, we identify the uptake of leukemia cell–derived mitochondrial double-stranded RNA (dsRNA) by MSCs as a proximate trigger for the MSC to CAF transition. We demonstrate that inhibiting dsRNA formation in ALL cells by treatment with low-dose ethidium bromide or the mitochondrial transcription inhibitor IMT1, or degrading dsRNA in conditioned media by 100°C exposure eliminates the ability of the ALL conditioned media to stimulate MSC to CAF transition. Our data reveal, to our knowledge, a novel and previously undescribed mechanism by which cancer cells induce a CAF phenotype in stromal cells, showing how B-ALL cells can directly induce the previously described niche-mediated protection within the bone marrow.
Introduction
The primary genetic driver lesion is strongly prognostic for survival in B-cell precursor acute lymphoblastic leukemia (B-ALL),1 but there is no known mechanism by which genetic driver lesions influence outcome. We have previously demonstrated that an activated mesenchymal stromal cell (MSC) niche develops in response to reactive oxygen species (ROS)–inducing chemotherapy. The activated MSCs that we identified had a cancer-associated fibroblast (CAF) phenotype2 and actively transferred mitochondria along tunneling nanotubes to “rescue” B-ALL cells from chemotherapy, resulting in chemoresistance.3 Dobson et al recently identified a proportion of B-ALL cases in which chemoresistant subclones exist before chemotherapy,4 prompting us to evaluate whether CAFs are also present before chemotherapy treatment. Herein we demonstrate, using a variety of models, that some B-ALL cell lines and primary cells can directly generate CAFs from MSC lines and primary MSCs in the absence of chemotherapy. We identify transfer of mitochondrial double-stranded RNA (dsRNA) from cancer cells to MSCs as a novel mechanism by which MSCs can become CAFs.
Methods
Cells
Primary cells
Primary ALL cells and MSCs from patients were sourced from participants enrolled in the UKALL14 trial (NCT01085617). Normal MSCs were sourced from healthy individuals undergoing bone marrow harvest as donors. All human material was used with informed consent, according to the Declaration of Helsinki.
Isolation and expansion of primary human MSCs
Mononuclear cells were isolated from fresh bone marrow specimens by density gradient centrifugation (Ficoll; Amersham Biosciences, Amersham, United Kingdom). MSCs were isolated and expanded in MesenCult MSC Basal Medium (STEMCELL Technologies) supplemented with MesenCult Stimulatory Supplement (STEMCELL Technologies), 100 U/mL penicillin G (Gibco; Fisher Scientific), 100 mg/mL streptomycin (Gibco), 2-mM L-glutamine (Gibco), and 1-ng/mL basic fibroblast growth factor (R&D Systems). MSCs used in experiments were from passage 4 to 5. MSCs were characterized according to the criteria set by the International Society for Cell & Gene Therapy using the Human Mesenchymal Stem Cell Functional Identification Kit (R&D Systems) and Human Mesenchymal Stem Cell Verification Kit (R&D Systems).
Cell lines
The human MSC line HS27a (ATCC); B-ALL cell lines REH, SD-1, SEM, 697 and TOM-1; the murine MSC line MS-5; and the cervical cancer cell line HeLa (all from DSMZ) were grown in RPMI 1640, αMEM (for MS-5), and DMEM (for HeLa) with 5% to 20% fetal bovine serum and penicillin/streptomycin/glutamine.
Exposure of MSCs to ALL cells or conditioned media
For coculture experiments, MSC lines or healthy donor MSCs were plated on day 0, and ALL cell lines or primary B-ALL cells were added on day 1 at a ratio of 1:4. The cells were flow-sorted after 3 to 5 days and subjected to imaging or nucleic acid extraction. For transwell experiments, the ALL cells were added onto a transwell insert (0.1-0.4 μm; Greiner Bio-One) at day 1. For contact-independent experiments, MSC line HS27a was incubated with the B-ALL cell line conditioned medium.
Mitochondrial nucleic acid depletion from SD-1 cells or from conditioned media
Mitochondrial nucleic acid was depleted from SD-1 cells using 2 methods. Cells were cultured in media containing 0.1 μg/mL ethidium bromide supplemented with 50 μg/mL uridine and 1-mM sodium pyruvate for 3 to 4 weeks, or cultured overnight with 100-μm or 200-μm mitochondrial polymerase inhibitor IMT1 (inhibitor of mitochondrial transcription 1). SD-1 conditioned medium was depleted of nucleic acid after incubation at 100°C for 1 hour, with incubations at 56°C and 70°C serving as negative controls.
Microscopy
Immunocytochemistry
Immunocytochemistry was performed according to a modified R&D Systems protocol. Cells were fixed with 4% paraformaldehyde, washed, and then blocked for 2 hours with a buffer containing 1% bovine serum albumin (BSA), 10% normal donkey serum (Abcam), and 0.3% Triton X-100 (Sigma-Aldrich). After blocking, the nuclear stain DAPI (4′,6-diamidino-2-phenylindole) (Santa Cruz Biotechnology) and F-actin stain Phalloidin-Atto 633 (Sigma-Aldrich) were added for 10 minutes. Imaging was performed with a Zeiss Axio Observer Z1 fluorescence microscope.
Immunofluorescence microscopy for dsRNA detection
Adherent cells were stained directly in 24-well, glass-bottom plates, whereas B-ALL suspension cells were adhered to fibronectin-coated, 24-well glass-bottom plates overnight before staining. Cells were stained with MitoTracker Deep Red FM (Invitrogen; Thermo Fisher Scientific) according to the manufacturer’s instructions. The cells were then washed with phosphate-buffered saline (PBS), fixed with 4% paraformaldehyde, and permeabilized with 0.25% Triton X-100 (Sigma-Aldrich) in PBS. After washing with 0.05% Tween 20 in PBS, 3% BSA (BSA heat shock fraction; Sigma-Aldrich) was added as a blocking agent for 1 hour. After blocking, the anti-dsRNA antibody J2 (SCICONS) was added at 1:200 dilution in 3% BSA followed by the DyLight 488 Anti-Mouse IgG (H+L) secondary antibody (2BScientific) (1:300 dilution) for 1 hour each. Finally, the nuclear stain DAPI (Santa Cruz Biotechnology) was added for 10 minutes. Imaging was performed using the Zeiss LSM 880 confocal microscope.
Immunohistochemistry of femur sections
After fixation in 10% neutral buffered formalin, samples were decalcified in 10% formic acid for 9 to 10 hours, and then processed, embedded, and sectioned. Samples were stained with anti-human CD19 and anti-mouse nestin (Abcam) primary antibodies.
Flow cytometry
Flow cytometric detection of dsRNA
Cells were washed and resuspended in PBS and then incubated with fixable viability Zombie NIR (near infrared) dye (BioLegend) for 15 minutes at 4°C. The cells were then incubated with anti-human CD19 (BD Biosciences) for 30 minutes at 4°C before fixation and permeabilization with 4% paraformaldehyde and 0.1% Triton X-100 (Sigma-Aldrich), respectively. The cells were blocked in 1% BSA (BSA heat shock fraction; Sigma-Aldrich) for an hour at room temperature. After blocking, anti-dsRNA antibody J2 (1 μg/mL; SCICONS) was added at 1:100 dilution in 1% BSA, followed by DyLight 488 Anti-Mouse IgG (H+L) secondary antibody (2BScientific) (1:300 dilution) for 1 hour each. The cells were washed and then run on BD LSRFortessa X-20. Data were analyzed with FlowJo (FlowJo LLC).
Fluorescent activated cell sorting of HS27a MSCs
After coculturing of ALL cell lines or primary B-ALL cells and MSC line HS27a or healthy donor MSCs for 5 days, the MSCs and ALL cells were removed from the plate by trypsinization and sorted on the basis of CD90 expression (anti-CD90 fluorescein isothiocyanate or anti-CD90 allophycocyanin; BD Biosciences) and the absence of CD19 expression (anti-CD19 allophycocyanin or anti-CD19 Brilliant Violet 605; BD Biosciences) using the BD FACSAria III cell sorter.
MitoTracker assay
MSCs were stained with MitoTracker Deep Red FM (M22426; Thermo Fisher Scientific) according to the manufacturer’s instructions at 37°C for 30 minutes. The cells were washed twice, and then left for 3 hours to eliminate unbound probe before a final wash. The stained MSCs were cocultured with different ALL cell lines or primary ALL cells for 24 to 72 hours. The ALL cells were then collected and stained with anti-CD19 Brilliant Violet 605 (BD Biosciences) followed by analysis for the presence of mitochondria in the CD19-positive ALL cell population.
Quantification of ROS
B-ALL cell lines were collected and stained with CellROX Green (C10444; Thermo Fisher Scientific) according to the manufacturer’s instruction, and their ROS levels were measured using flow cytometry.
Quantification of secreted proteins
Cytometric bead array
A cytometric bead array (BD Biosciences) was used according to the manufacturer’s instructions with the interleukin-6 (IL-6) Flex Set (558276; BD Biosciences), Human IL-8 Flex Set (558277; BD Biosciences), or Human MCP-1/CCL2 Flex Set (558287; BD Biosciences). Three hundred events per analyte from the live gate were collected on a BD FACSAria instrument (BD Biosciences). Data were analyzed with FCAP Array Software, version 3.0 (BD Biosciences).
Enzyme-linked immunosorbent assay
The supernatant was collected from the MSCs at the end of the experiment (48-72 hours). VeriKine-HS Human interferon (IFN)-Beta TCM (tissue culture media) enzyme-linked immunosorbent assay Kit 96T (PBL Assay Science) was used to quantify IFN-β in the supernatant.
A dsRNA enzyme-linked immunosorbent assay kit (Exalpha/Nordic MUbio) was used to quantify dsRNA from 1 μg of total RNA, according to the manufacturer’s instructions.
Molecular biology
RNA extraction
RNA was extracted from cells with TRIzol (15596026; Ambion, Thermo Fisher Scientific) and separated from DNA using chloroform (Sigma-Aldrich). Isopropanol (Sigma-Aldrich) was added, and the samples were frozen overnight at –80°C. After it was thawed and washed with 70% ethanol, the pellet of RNA was resuspended in RNase-free water, and the concentration was measured on a nanodrop spectrophotometer. RNA was also extracted using the RNeasy Micro Kit (Qiagen) or RNeasy Mini Kit (Qiagen) according to the manufacturer’s protocol.
RT2 profiler PCR assays
Complementary DNA (cDNA) was synthesized with the RT2 First Strand Kit (330401; Qiagen), according to the manufacturer’s instructions. The cDNA was then used for an RT2 profiler polymerase chain reaction (PCR) Array, according to the manufacturer’s protocol, with a predefined and preprepared selection of primers for appropriate CAF-defining targets or RNA sensing gene targets listed in supplemental Tables 1 and 2. Each sample was run in triplicate for each gene and quantified relative to the glyceraldehyde-3-phosphate dehydrogenase housekeeping control.
Mitochondrial DNA detection
DNA was extracted from cells using the QIAamp DNA Blood Mini Kit (Qiagen). The DNA was amplified for detection of mitochondrial and nuclear DNA from both human and mouse cells using the primers listed in supplemental Table 4 and the supplemental Methods. Annealing was performed at 60°C, and PCR was performed for 15 to 25 cycles. The PCR products were run in 2% agarose gels (Sigma-Aldrich) and visualized under UV light.
Reverse transcription-PCR for mitochondrial dsRNA (mtdsRNA) immunoprecipitated from B-ALL conditioned media
dsRNA was immunoprecipitated using Protein G Dynabeads (Thermo Fisher Scientific). The protocol was modified from the manufacturer’s method. Namely, 5 μg of J2 or K1 monoclonal antibodies was coated onto protein G magnetic Dynabeads, and then the conditioned media were incubated with the J2/K1 monoclonal antibody–coated Dynabeads for 2 hours at 4°C. The beads were centrifuged and washed before RNA was extracted using the TRIzol method. The RNA was then subjected to reverse transcriptase PCR to obtain cDNA, which was used to perform an end-point PCR using the primers listed in supplemental Table 5. Total RNA extracted from SD-1 cells was used as a positive control.
RQ-PCR for mitochondrial gene expression
RNA extracted from SD-1 cells after mitochondrial nucleic acid depletion was subjected to reverse transcriptase PCR to obtain cDNA. Real-time quantitative PCR (RQ-PCR) was performed on the cDNA using 18s ribosomal RNA as a housekeeping gene, and the results were analyzed using the ΔΔCT method.
RNA sequencing (RNAseq)
HS27a cells were plated and incubated with SD-1 or SEM conditioned media or RPMI control in triplicate, and RNA was extracted from the MSCs 48 to 72 hours later. RNA from experimental triplicates was processed and sequenced by the Great Ormond Street Hospital UCL (University College London) Genomics Facility (London, United Kingdom). Libraries were prepared using the KAPA messenger RNA HyperPrep Kit (Roche). Samples were sequenced on the Illumina NextSeq 2000. FastQ files were assessed with FastQC (Babraham Institute Bioinformatics Group). Adapter sequences, primers, and poly-A tails were removed with Cutadapt. Raw data were mapped with the STAR (spliced transcripts alignment to a reference) aligner to the human genome GRCh38 with annotation from Ensembl. Gene expression analysis was conducted in R (version 4.2.2; R Foundation for Statistical Computing). Differentially expressed genes between control and exposed HS27a were determined using DESeq2.5 Significantly upregulated genes were determined using a P adjusted value <.05. Gene set enrichment analysis was performed with fgsea (fast gene set enrichment analysis) using the Reactome pathway sets6 as the reference. The significance of enriched pathways was determined using a P adjusted value of <.05.
Mouse experiments
All animal experiments were performed according to UK Home Office approved protocols and institutional guidelines. Disseminated SEM/SD-1 xenografts were established in 8 to 10-week-old NSG (non-obese diabetic/severe combined immunodeficiency gamma) mice (Charles River, Margate, United Kingdom) by tail vein injection of 2 × 10⁶ SEM or SD-1 cells expressing luciferase and blue fluorescent protein. A mouse without leukemia was used as a baseline for imaging. Engraftment was confirmed after 7 days, and disease was monitored by bioluminescent imaging. Mice were shaved, injected intraperitoneally with 200 μL of D-luciferin (Caliper Life Sciences, Cheshire, United Kingdom), and imaged under isoflurane anesthesia in an IVIS 100 Lumina (Caliper Life Sciences, Cheshire, United Kingdom). The data were analyzed using Living Image 3.2 software (PerkinElmer). Mice were killed at the humane end point, and a femur was fixed in 10% neutral buffered formalin for immunohistochemistry.
Statistical analysis
The data generated were analyzed on GraphPad Prism 6 software (Dotmatics) or other software when indicated. For statistical comparison, χ2 or unpaired Student t tests were used, as indicated.
Results
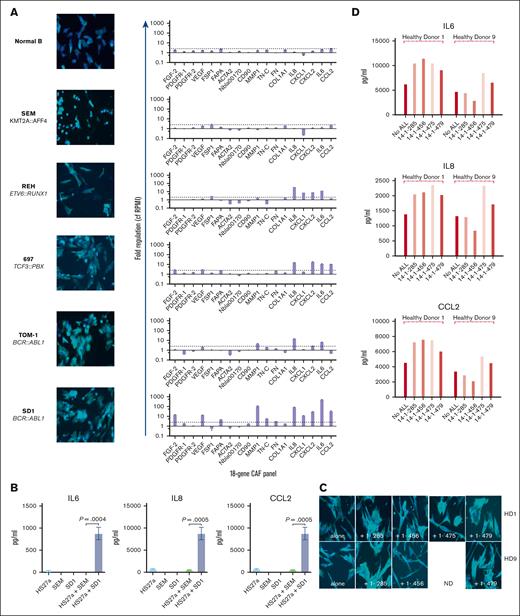
First, we sought to determine if B-ALL cells could directly activate MSCs to become CAFs. We cocultured 5 distinct B-ALL cell lines and control, healthy donor B-cells together with HS27a, a human MSC line. We used our previously published criteria3 to assess CAF formation, namely, cytoskeletal changes (broadened and flattened morphology with prominent actin stress fibers), upregulation of relevant genes in our targeted 18-gene MSC activation/CAF quantitative PCR panel, and IL-6, IL-8, and CCL2 secretion. Three of 5 B-ALL cell lines (697 [TCF3::PBX], TOM-1, and SD-1 [both BCR::ABL1]) induced characteristic CAF changes in the HS27a cells (Figure 1A). REH (ETV6::RUNX1) cells did not induce CAF-like morphological changes in the HS27a cells but did upregulate a selection of CAF-relevant genes. SEM (KMT2A::AFF4) cells and healthy B-cells induced neither morphological changes nor upregulation of CAF-relevant genes in the HS27a cells. A cytokine bead array (Figure 1B) showed a significant increase in IL-6, IL-8, and CCL2 proteins in the media of SD-1 cells cocultured with HS27a compared with monoculture or SEM cells in coculture, in keeping with upregulation of relevant genes in the quantitative PCR data. We confirmed that CAF induction also occurred after coculture of primary patient ALL cells with normal, healthy donor MSCs obtained from 2 healthy bone marrow donors. Three of 4 primary B-ALL samples (14-1-285 [BCR::ABL1], 14-1-475 [BCR::ABL1], and 14-1-479 [BCR::ABL1]) but not 14-1-456 (B-other, no known primary driver lesion) tested did induce activation of 2 different healthy donor MSCs, as characterized by cytoskeletal changes (Figure 1C) and IL-6, IL-8, and CCL2 secretion (Figure 1D). This may be associated with the BCR::ABL1 status, but insufficient primary samples were available for robust statistical confirmation. Given our own and others’ findings that CAFs can be induced by exposure to ROS, we quantified the intrinsic ROS level of the cell lines using CellROX assay. Figure 1E shows the relationship between intrinsic ROS levels of B-ALL cells as measured by CellROX and CAF-generating capacity. We further confirmed that the MSC activation without chemotherapy occurred in a murine xenograft model; we selected SD-1 cells and SEM cells for the model because of their divergent abilities to induce CAFs in vitro. Luciferase-expressing SD-1 and SEM cells were injected via the tail vein (n = 4 mice SD-1 and n = 3 mice SEM). Engraftment was slightly greater in the SEM group than the SD-1 group (supplemental Figure 4). The mice were killed on day +17 and femora were dissected. Femoral sections stained with antibodies against CD19 and nestin showed a significantly higher number of nestin-expressing cells in the SD-1 model than in the SEM model, consistent with ab initio CAF formation; a representative example is shown in Figure 1F.
B-ALL cells directly stimulate MSCs to become CAFs. (A) Photomicrographs (magnification ×20) showing phalloidin/DAPI staining of HS27a MSCs after coculture with a series of ALL cell lines of different genetic subtypes, as indicated, alongside a gene expression panel showing fold upregulation (Y axis) of the 18-gene CAF panel compared with mean baseline of HS27a MSCs. (B) Cytokine bead assays for IL-6, IL-8, and CCL2 (pg/mL, Y axis) following coculture of HS27a MSCs with SEM or SD-1 ALL cells and controls of each cell alone, as indicated on the X axis. Mean and standard error of mean from 3 independent experiments are shown. P values for comparisons between HS27a + SEM and HS27a + SD-1 by unpaired t test are .0004 (IL-6), <.0001 (IL-8), and .0005 (CCL2). (C) Photomicrographs (magnification ×40) showing phalloidin/DAPI staining of 2 normal healthy donor (HD1, HD9) MSCs after coculture with 4 different primary patient ALL samples, 1-285, 1-456, 1-475, and 1-479. (D) IL-6, IL-8, and CCL2 (pg/mL, Y axis) secreted by HD1 and HD9 MSCs after coculture with the 4 individual primary patient ALL samples. (E) Mean fluorescent intensity (Y axis) of ROS after CellROX Green staining of the panel of ALL cell lines used in panel A. Mean and standard error of mean from 3 independent experiments are shown. (F) Representative sections of femur from NSG mice with established leukemia derived from SD-1 or SEM cells stained by CD19 (grayish brown) or nestin (pink).
B-ALL cells directly stimulate MSCs to become CAFs. (A) Photomicrographs (magnification ×20) showing phalloidin/DAPI staining of HS27a MSCs after coculture with a series of ALL cell lines of different genetic subtypes, as indicated, alongside a gene expression panel showing fold upregulation (Y axis) of the 18-gene CAF panel compared with mean baseline of HS27a MSCs. (B) Cytokine bead assays for IL-6, IL-8, and CCL2 (pg/mL, Y axis) following coculture of HS27a MSCs with SEM or SD-1 ALL cells and controls of each cell alone, as indicated on the X axis. Mean and standard error of mean from 3 independent experiments are shown. P values for comparisons between HS27a + SEM and HS27a + SD-1 by unpaired t test are .0004 (IL-6), <.0001 (IL-8), and .0005 (CCL2). (C) Photomicrographs (magnification ×40) showing phalloidin/DAPI staining of 2 normal healthy donor (HD1, HD9) MSCs after coculture with 4 different primary patient ALL samples, 1-285, 1-456, 1-475, and 1-479. (D) IL-6, IL-8, and CCL2 (pg/mL, Y axis) secreted by HD1 and HD9 MSCs after coculture with the 4 individual primary patient ALL samples. (E) Mean fluorescent intensity (Y axis) of ROS after CellROX Green staining of the panel of ALL cell lines used in panel A. Mean and standard error of mean from 3 independent experiments are shown. (F) Representative sections of femur from NSG mice with established leukemia derived from SD-1 or SEM cells stained by CD19 (grayish brown) or nestin (pink).
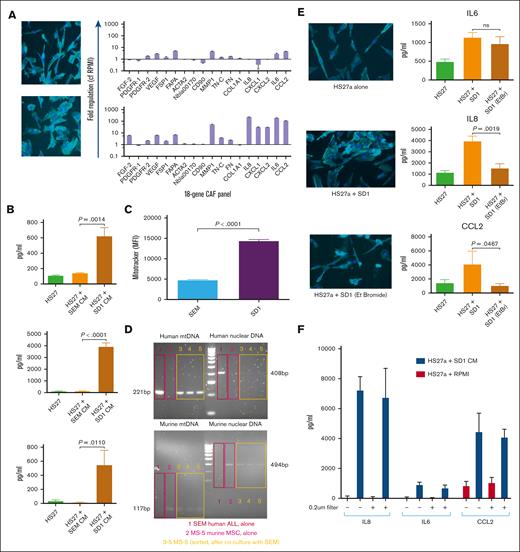
We sought to elucidate the mechanism behind the differential CAF induction by B-ALL cells of the different genetic subtypes. First, we showed that cell–cell contact was not required; SD-1 but not SEM cells still induced CAFs from HS27a when they were cocultured but separated in a transwell (supplemental Figure 1). SD-1 but not SEM conditioned media similarly induced CAFs, as shown by the imaging and RQ-PCR (Figure 2A) as well as cytokine bead assays (Figure 2B). A Proteome Profiler Human XL cytokine array assay for cytokines/chemokines in the conditioned media of SD-1 and SEM cells did not reveal any likely causative cytokine candidates (supplemental Figure 2). In view of the relationship shown in Figure 1 between intracellular ROS levels and CAF induction, we asked the question if mitochondria were transmitted from B-ALL cells to MSCs given that mitochondria are an important source of ROS within the cell. A flow cytometric MitoTracker dye assay (Figure 2C) showed an approximately threefold higher transfer of mitochondria from SD-1 than from SEM cells. To rule out passive dye transfer as responsible for the flow cytometric findings, we cocultured the murine MSC line MS-5 with human SEM leukemia cells, and then examined the presence of human mitochondrial DNA in the flow-sorted murine MS-5 cells. These data are shown in Figure 2D and confirm human mitochondrial (but not nuclear) DNA in the mouse stroma. To confirm that SD-1 mitochondria were associated with CAF induction in HS27a, we repeated the imaging and cytokine release CAF assays after depletion of mitochondrial nucleic acid from the SD-1 cells through extended coculture with low-dose ethidium bromide.7Figure 2E shows that SD-1 cells depleted of mitochondrial nucleic acid were less able to induce CAF-like morphological changes and generated significantly lower levels of IL-8 and CCL2, although not IL-6, secretion by HS27a MSCs. However, on exposing HS27a to SD-1-conditioned medium filtered to remove whole mitochondria (Figure 2F) using a 0.2-μm filter, IL-6, IL-8, and CCL2 production was not inhibited, suggesting that CAF induction might result from the transfer of mitochondrial fragments or mitochondrial nucleic acid.
The B-ALL–mediated MSC to CAF transition is contact-independent and mediated by transfer of mitochondrial elements. (A) Photomicrographs (magnification ×20) showing phalloidin/DAPI staining of HS27a MSCs after coculture with SEM (top) or SD-1 (bottom) conditioned media alongside the 18-gene panel showing fold upregulation (Y axis) compared with mean baseline of HS27a MSCs. (B) Cytokine bead assays for IL-6, IL-8, and CCL2 (pg/mL, Y axis) following exposure of HS27a MSCs to RPMI alone or SEM or SD-1 ALL conditioned media, as indicated on the X axis. Mean and standard error of mean from 3 independent experiments are shown. ∗.01 < P ≤ .05; ∗∗.001 < P ≤ .01; ∗∗∗∗P ≤ .0001. (C) Mitochondrial transfer to HS27a MSCs from SEM or SD-1 cells (X-axis) by MitoTracker assay (mean fluorescence intensity, Y axis). (D) Agarose gel images showing PCR products from human nuclear and mitochondrial DNA and murine nuclear and mitochondrial DNA, as indicated in each quadrant, after coculture of SEM cells with MS-5 murine stromal cells. Red boxes in lane 1 represent SEM alone, pink boxes in lane 2 MS-5 alone, and yellow boxes in lanes 3 to 5 flow-sorted MS-5 cells after coculture. (E) Photomicrographs (magnification ×20) showing phalloidin/DAPI staining of HS27a MSCs alone, and cytokine bead assays for IL-6, IL-8, and CCL2 (pg/mL, Y axis) production by HS27a cells: alone, after coculture with SD-1 cells, and after coculture with SD-1 cells depleted of mitochondrial nucleic acid by low-dose ethidium bromide. For the cytokine production, mean and standard error of mean from 3 independent experiments are shown. (F) Cytokine bead assays for IL-6, IL-8, and CCL2 (pg/mL, Y axis) following exposure of HS27a cells to SD-1-conditioned medium (blue bars) or RPMI-alone control (red bars) with (+) or without (−) 0.2-μm filtration.
The B-ALL–mediated MSC to CAF transition is contact-independent and mediated by transfer of mitochondrial elements. (A) Photomicrographs (magnification ×20) showing phalloidin/DAPI staining of HS27a MSCs after coculture with SEM (top) or SD-1 (bottom) conditioned media alongside the 18-gene panel showing fold upregulation (Y axis) compared with mean baseline of HS27a MSCs. (B) Cytokine bead assays for IL-6, IL-8, and CCL2 (pg/mL, Y axis) following exposure of HS27a MSCs to RPMI alone or SEM or SD-1 ALL conditioned media, as indicated on the X axis. Mean and standard error of mean from 3 independent experiments are shown. ∗.01 < P ≤ .05; ∗∗.001 < P ≤ .01; ∗∗∗∗P ≤ .0001. (C) Mitochondrial transfer to HS27a MSCs from SEM or SD-1 cells (X-axis) by MitoTracker assay (mean fluorescence intensity, Y axis). (D) Agarose gel images showing PCR products from human nuclear and mitochondrial DNA and murine nuclear and mitochondrial DNA, as indicated in each quadrant, after coculture of SEM cells with MS-5 murine stromal cells. Red boxes in lane 1 represent SEM alone, pink boxes in lane 2 MS-5 alone, and yellow boxes in lanes 3 to 5 flow-sorted MS-5 cells after coculture. (E) Photomicrographs (magnification ×20) showing phalloidin/DAPI staining of HS27a MSCs alone, and cytokine bead assays for IL-6, IL-8, and CCL2 (pg/mL, Y axis) production by HS27a cells: alone, after coculture with SD-1 cells, and after coculture with SD-1 cells depleted of mitochondrial nucleic acid by low-dose ethidium bromide. For the cytokine production, mean and standard error of mean from 3 independent experiments are shown. (F) Cytokine bead assays for IL-6, IL-8, and CCL2 (pg/mL, Y axis) following exposure of HS27a cells to SD-1-conditioned medium (blue bars) or RPMI-alone control (red bars) with (+) or without (−) 0.2-μm filtration.
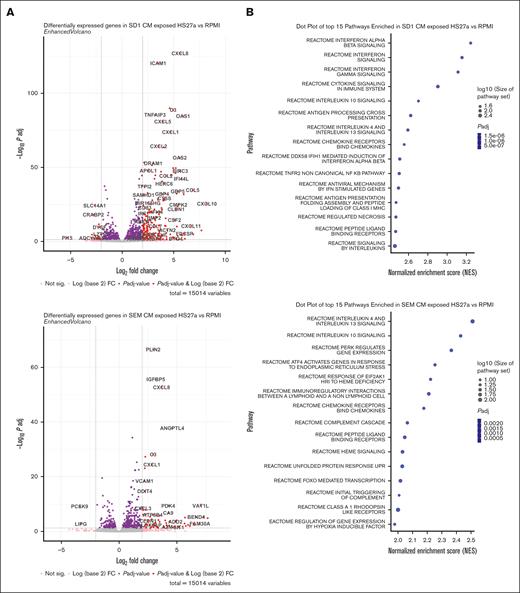
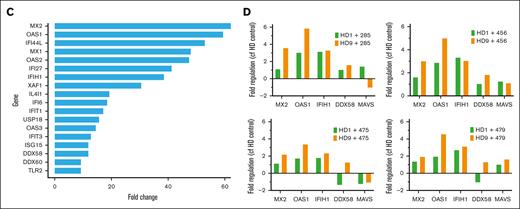
To gain a more comprehensive understanding of the phenomenon, we performed bulk RNA sequencing on HS27a exposed to CAF-inducing and noninducing conditions. We used conditioned media from SD-1 and SEM cells to rule out any contamination by B-ALL cells. RPMI alone served as a baseline. Figure 3A shows the volcano plots of HS27a cells grown in either SD-1 or SEM conditioned media, each compared with the RPMI control. Of specific interest, the most highly upregulated genes in HS27a after exposure to SD-1 but not SEM conditioned media were mostly genes encoding cytokines and chemokines (CCL5, CXCL10, CXCL11, CCL2, CXCL1), RNA sensing genes (OAS1, OAS2, OAS3, MX1) or IFN pathway–related genes (IFI44L, IFIH1, IFIT3). Gene enrichment pathway analysis revealed that the most enriched pathways in the SD-1 conditioned medium were related to IFN signaling, as seen in Figure 3B. Other pathways that were enriched included cytosolic nucleic acid sensing, cytokine/chemokine signaling, and tumor necrosis factor-⍺ signaling. Figure 3C shows the most highly upregulated IFN pathway genes in SD-1 conditioned media compared with RPMI. Strikingly, many of these genes are involved in RNA sensing or inhibition (MX1-2, OAS1-3, IFIH1/MDA-5, DDX58/RIG-I). We measured the levels of IFN-α, -β, and -γ by enzyme-linked immunosorbent assay in the media of HS27a cells exposed to SD-1 or SEM conditioned media or RPMI. We did not detect any secreted IFN-α or -γ in any of the conditions. However, we detected a maximum 68 pg/mL of IFN-β (supplemental Figure 3) in HS27a cells exposed to SD-1-conditioned media at the 72 hour time point, a quantity commensurate with the level found in human serum after severe COVID-19 infection.8 We used reverse transcription-PCR to validate those findings in the 2 different normal healthy donor MSC samples after exposure to the same primary ALL samples (Figure 3D) that were used in Figure 1.
The B-ALL–mediated MSC to CAF transition is accompanied by a robust IFN pathway response. (A) Two volcano plots showing differentially regulated genes from HS27a cells cultured in SD-1 conditioned medium compared with RPMI, and HS27a cells cultured in SEM conditioned medium compared with RPMI, as indicated. (B) Dot plots of the top 15 pathways enriched in HS27a cells cultured in SD-1 conditioned medium compared with RPMI, and HS27a cells cultured in SEM conditioned medium compared with RPMI, as indicated. Dot size is proportional to log10(size of pathway set), and color is proportional to adjusted P value. All P values were highly significant, as indicated. (C) Bar chart showing fold upregulation (X axis) of IFN pathway genes indicated on the Y axis. (D) Validation of RNAseq IFN response finding in 2 primary, HD1 and HD9 MSCs cocultured with 4 different primary ALL cell specimens (X axes). The Y axis indicates fold change in gene expression.
The B-ALL–mediated MSC to CAF transition is accompanied by a robust IFN pathway response. (A) Two volcano plots showing differentially regulated genes from HS27a cells cultured in SD-1 conditioned medium compared with RPMI, and HS27a cells cultured in SEM conditioned medium compared with RPMI, as indicated. (B) Dot plots of the top 15 pathways enriched in HS27a cells cultured in SD-1 conditioned medium compared with RPMI, and HS27a cells cultured in SEM conditioned medium compared with RPMI, as indicated. Dot size is proportional to log10(size of pathway set), and color is proportional to adjusted P value. All P values were highly significant, as indicated. (C) Bar chart showing fold upregulation (X axis) of IFN pathway genes indicated on the Y axis. (D) Validation of RNAseq IFN response finding in 2 primary, HD1 and HD9 MSCs cocultured with 4 different primary ALL cell specimens (X axes). The Y axis indicates fold change in gene expression.
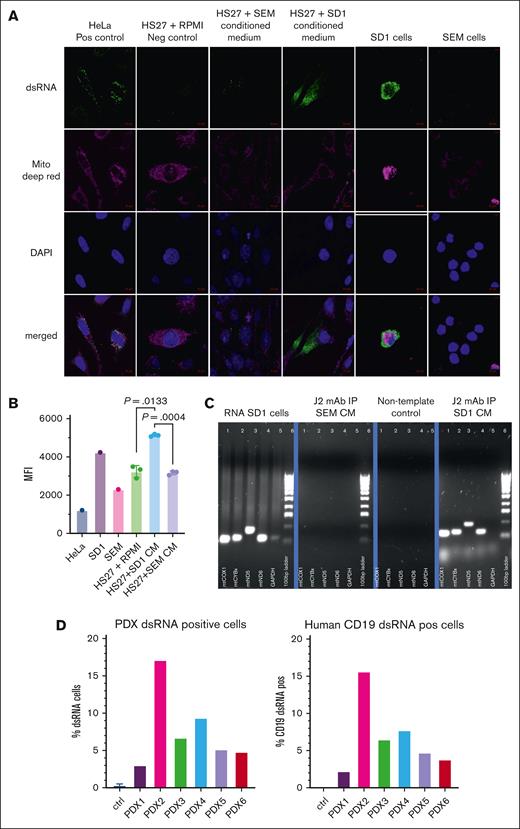
We were prompted by a recent finding that mtdsRNA can generate an antiviral signaling response in humans9 to explore mtdsRNA as the cause for CAF formation. We sought the presence of mtdsRNA in the conditioned medium of ALL cells as an explanation for our findings. We costained SD-1, SEM, and HS27a cells alone as well as HS27a exposed to SD-1 and SEM conditioned medium with the J2 dsRNA-specific antibody, Deep Red MitoTracker, and DAPI, and then conducted confocal microscopy. HeLa cells served as a positive control. Figure 4A shows very prominent dsRNA staining in SD-1 cells and in HS27a cells exposed to SD-1 conditioned media but almost complete absence of dsRNA in SEM cells and HS27a cultured in SEM conditioned media or RPMI. To confirm these findings with a different technique, we measured mean fluorescence intensity using flow cytometry after J2 staining, using the same experimental conditions. As shown in Figure 4B, there was an approximately 1.5-fold increase in the mean fluorescence intensity of dsRNA expression by flow cytometry in HS27a exposed to SD-1 conditioned media relative to SEM conditioned media or RPMI. Next, to confirm that the dsRNA in the SD-1 was indeed of mitochondrial origin, we immunoprecipitated dsRNA from the SD-1 and SEM conditioned media using the J2 antibody. Total cellular RNA from SD-1 served as a positive control. After synthesis of cDNA, we performed PCR analysis of 4 mitochondrial genes (mtCOX1, mtND5, mtND6, and mtCYB) and the nuclear gene GAPDH (glyceraldehide-3-phosphate dehydrogenase). Figure 4C shows amplification of mitochondrial genes after J2-immunoprecipitation of SD-1 but not SEM conditioned medium. We confirmed the presence of dsRNA (% cells stained with J2 antibody by flow cytometry) in whole bone marrow and then CD19-sorted cells taken from 3 BCR::ABL11,4,6 and 3 KMT2A::AFF42,3,5 patient-derived xenograft samples grown in NSG mice (Figure 4D). NSG mouse marrow alone was the negative control. We found dsRNA in a percentage of cells in all the specimens. However, given that the experiment was conducted only once, we cannot make inferences about the comparative levels. Combined with the data from Figure 1C-D, it is difficult to speculate about the precise relationship of dsRNA release with genetic subtype.
CAF-inducing B-ALL cells contain mtdsRNA, which is released and taken up by MSCs. (A) Photomicrographs of confocal images of cells stained with anti-dsRNA monoclonal antibody J2, Deep Red MitoTracker, and DAPI, as well as merged images, as indicated on the left. Cell types and experimental conditions are indicated above the image. (B) MFI (Y axis) after intracellular J2 staining and flow cytometry of the cells indicated on the X axis. HS27a + SD-1 or SEM indicates HS27a cells exposed to the SD-1 or SEM conditioned medium. (C) Agarose gel images showing the products of reverse transcription-PCR for 4 mitochondrial genes, and GAPDH with a 100 base pair ladder (as indicated below the bands) from the experimental conditions indicated at the top of the individual gel images: positive control (SD-1 cells), J2-immunoprecipitated RNA from SD-1 and SEM cells, and negative nontemplate control. (D) Bar chart showing percentage of ALL patient–derived xenograft (PDX) cells (Y axis) positive for dsRNA after intracellular J2 staining and flow cytometry. PDX 1, 4, and 6 are derived from BCR::ABL1+ ALL, and PDX 2, 3, and 5 from KMT2A::AFF4+ ALL. CM, conditioned medium; MFI, mean fluorescence intensity.
CAF-inducing B-ALL cells contain mtdsRNA, which is released and taken up by MSCs. (A) Photomicrographs of confocal images of cells stained with anti-dsRNA monoclonal antibody J2, Deep Red MitoTracker, and DAPI, as well as merged images, as indicated on the left. Cell types and experimental conditions are indicated above the image. (B) MFI (Y axis) after intracellular J2 staining and flow cytometry of the cells indicated on the X axis. HS27a + SD-1 or SEM indicates HS27a cells exposed to the SD-1 or SEM conditioned medium. (C) Agarose gel images showing the products of reverse transcription-PCR for 4 mitochondrial genes, and GAPDH with a 100 base pair ladder (as indicated below the bands) from the experimental conditions indicated at the top of the individual gel images: positive control (SD-1 cells), J2-immunoprecipitated RNA from SD-1 and SEM cells, and negative nontemplate control. (D) Bar chart showing percentage of ALL patient–derived xenograft (PDX) cells (Y axis) positive for dsRNA after intracellular J2 staining and flow cytometry. PDX 1, 4, and 6 are derived from BCR::ABL1+ ALL, and PDX 2, 3, and 5 from KMT2A::AFF4+ ALL. CM, conditioned medium; MFI, mean fluorescence intensity.
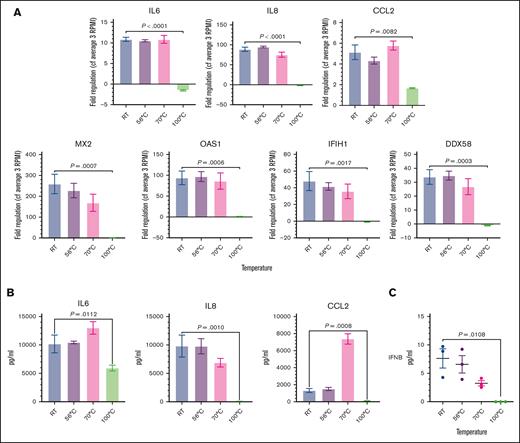
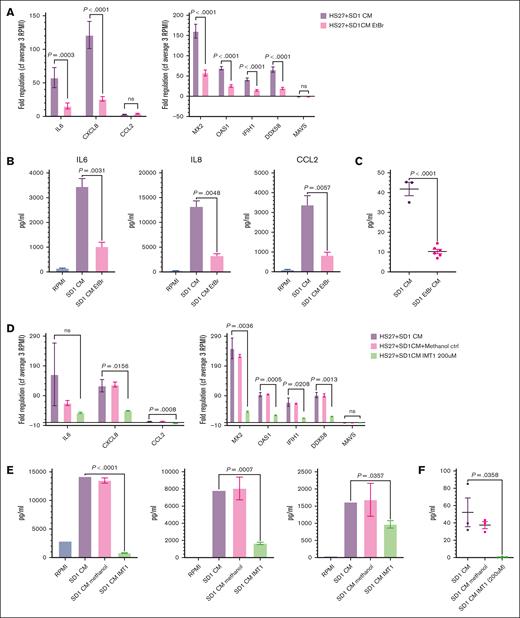
To demonstrate the key role of mtdsRNA in CAF formation, we used 3 independent approaches. First, we heated the conditioned media to 56°C, 70°C, and 100°C to disrupt complement, proteins, and nucleic acids, respectively. End point PCR on cDNA generated from RNA, after immunoprecipitation using the K2 monoclonal antibody, confirmed substantial depletion of mitochondrial RNA (mtRNA) (supplemental Figure 5A) only in the 100°C-treated conditioned media. As shown in Figure 5A, when the heat-treated media were added to HS27a cells, only the 100°C-treated conditioned media failed to cause upregulation of IL-6, IL-8, CCL2, and the IFN-stimulated genes MX2, OAS1, IFIH, and DDX58. IL-6, IL-8, and CCL2 secretion (Figure 5B) by HS27a cells was abolished, as was IFN-β secretion (Figure 5C). Next, we used conditioned media from 10 million viable SD-1 cells, which were plated following pretreatment with low-dose ethidium bromide to deplete mitochondrial nucleic acid. A significantly reduced level of mtRNA was confirmed in both the cells and their conditioned media (supplemental Figure 5B-C). When the experiments described above were repeated using the SD-1–ethidium bromide conditioned medium, we also observed a large and significant reduction in the CAF and IFN pathway gene expression and IFN-β secretion, as shown in Figure 6A-C. Figure 6D-F shows the same experiments performed using conditioned media derived from SD-1 cells treated with the mtRNA polymerase inhibitor IMT1. Depletion of mtRNA was confirmed by RQ-PCR for mtND5 (supplemental Figure 5C-D). Again, we observed a large and significant reduction in the CAF and IFN pathway gene expression and IFN-β secretion, with the caveat that this level of IMT1 also affected cell viability. A reduction in some but not all of the MSC-CAF quantitative measurements was still evident upon 100-μm IMT1 treatment (no impact on cell viability), as shown in supplemental Figure 6.
Degradation of mtdsRNA in SD-1 conditioned medium by 100°C heat treatment prevents the IFN response and the MSC to CAF transition. (A) Fold regulation of CAF gene (IL-6, IL-8, and CCL2) and IFN pathway gene (MX2, OAS1, IFIH1, and DDX58) expression (Y axes) in HS27a cells exposed to SD-1 cell conditioned media heated to different temperatures (X axis). Bars show mean and standard error of the mean of 3 independent experiments. (B) Cytokine bead assays for IL-6, IL-8, and CCL2 (pg/mL, Y axis) following exposure of HS27a MSCs to SD-1 cell conditioned media heated to different temperatures (X axis). Mean and standard error of mean from 3 independent experiments are shown. (C) IFN-β (pg/mL, Y axis) secreted by HS27a MSCs exposed to SD-1 cell conditioned media heated to different temperatures (X axis). Three independent replicates are shown. RT, room temperature.
Degradation of mtdsRNA in SD-1 conditioned medium by 100°C heat treatment prevents the IFN response and the MSC to CAF transition. (A) Fold regulation of CAF gene (IL-6, IL-8, and CCL2) and IFN pathway gene (MX2, OAS1, IFIH1, and DDX58) expression (Y axes) in HS27a cells exposed to SD-1 cell conditioned media heated to different temperatures (X axis). Bars show mean and standard error of the mean of 3 independent experiments. (B) Cytokine bead assays for IL-6, IL-8, and CCL2 (pg/mL, Y axis) following exposure of HS27a MSCs to SD-1 cell conditioned media heated to different temperatures (X axis). Mean and standard error of mean from 3 independent experiments are shown. (C) IFN-β (pg/mL, Y axis) secreted by HS27a MSCs exposed to SD-1 cell conditioned media heated to different temperatures (X axis). Three independent replicates are shown. RT, room temperature.
Reduction of mtdsRNA secretion into conditioned media by low-dose ethidium bromide treatment or mtRNA polymerase inhibition abrogates the IFN response and the MSC to CAF transition. (A) Fold regulation of CAF gene (IL-6, IL-8, and CCL2) and INF pathway gene (MX2, OAS1, IFIH1, DDX58, and MAVS) expression (Y axes) in HS27a cells exposed to conditioned medium from SD-1 cells with (pink) or without purple) ethidium bromide (EtBr) pretreatment (X axis). Bars show mean and standard error of the mean of 3 independent experiments. All P values are at least <.01. (B) Cytokine bead assays for IL-6, IL-8, and CCL2 (pg/mL, Y axis) following exposure of HS27a MSCs to RPMI alone, SD-1 cell conditioned media, or media from SD-1 cells pretreated with EtBr (X axis). Mean and standard error of mean from 3 independent experiments are shown. (C) IFN-β (pg/mL, Y axis) secreted by HS27a MSCs exposed to SD-1 cell conditioned media or media from SD-1 cells pretreated with EtBr (X axis). Three or 6 independent replicates are shown. (D) Fold regulation of CAF gene (IL-6, IL-8, and CCL2) and INF pathway gene (MX2, OAS1, IFIH1, and DDX58) expression (Y axes) in HS27a cells exposed to conditioned medium from SD-1 cells (purple), conditioned medium from SD-1 cells incubated with methanol (pink), or conditioned medium from SD-1 cells incubated with IMT1 (green) (X axis). Bars show mean and standard error of mean of 3 independent experiments. (E) Cytokine bead assays for IL-6, IL-8, and CCL2 (pg/mL, Y axis) following exposure of HS27a MSCs to RPMI alone (blue), conditioned medium from SD-1 cells (purple), conditioned medium from SD-1 cells incubated with methanol (pink), or conditioned medium from SD-1 cells incubated with IMT1 (green). Mean and standard error of mean from 3 independent experiments are shown. (F) IFN-β (pg/mL, Y axis) secreted by HS27a MSCs exposed to conditioned medium from SD-1 cells, conditioned medium from SD-1 cells incubated with methanol, or conditioned medium from SD-1 cells incubated with IMT1 (X axis). Three or 6 independent replicates are shown.
Reduction of mtdsRNA secretion into conditioned media by low-dose ethidium bromide treatment or mtRNA polymerase inhibition abrogates the IFN response and the MSC to CAF transition. (A) Fold regulation of CAF gene (IL-6, IL-8, and CCL2) and INF pathway gene (MX2, OAS1, IFIH1, DDX58, and MAVS) expression (Y axes) in HS27a cells exposed to conditioned medium from SD-1 cells with (pink) or without purple) ethidium bromide (EtBr) pretreatment (X axis). Bars show mean and standard error of the mean of 3 independent experiments. All P values are at least <.01. (B) Cytokine bead assays for IL-6, IL-8, and CCL2 (pg/mL, Y axis) following exposure of HS27a MSCs to RPMI alone, SD-1 cell conditioned media, or media from SD-1 cells pretreated with EtBr (X axis). Mean and standard error of mean from 3 independent experiments are shown. (C) IFN-β (pg/mL, Y axis) secreted by HS27a MSCs exposed to SD-1 cell conditioned media or media from SD-1 cells pretreated with EtBr (X axis). Three or 6 independent replicates are shown. (D) Fold regulation of CAF gene (IL-6, IL-8, and CCL2) and INF pathway gene (MX2, OAS1, IFIH1, and DDX58) expression (Y axes) in HS27a cells exposed to conditioned medium from SD-1 cells (purple), conditioned medium from SD-1 cells incubated with methanol (pink), or conditioned medium from SD-1 cells incubated with IMT1 (green) (X axis). Bars show mean and standard error of mean of 3 independent experiments. (E) Cytokine bead assays for IL-6, IL-8, and CCL2 (pg/mL, Y axis) following exposure of HS27a MSCs to RPMI alone (blue), conditioned medium from SD-1 cells (purple), conditioned medium from SD-1 cells incubated with methanol (pink), or conditioned medium from SD-1 cells incubated with IMT1 (green). Mean and standard error of mean from 3 independent experiments are shown. (F) IFN-β (pg/mL, Y axis) secreted by HS27a MSCs exposed to conditioned medium from SD-1 cells, conditioned medium from SD-1 cells incubated with methanol, or conditioned medium from SD-1 cells incubated with IMT1 (X axis). Three or 6 independent replicates are shown.
Discussion
We have identified, to our knowledge, a novel biological mechanism by which exposure to leukemia cell–derived mtdsRNA can generate CAFs from MSCs in the absence of chemotherapy.
We revealed a differential capacity to generate CAFs, which was associated with the intrinsic ROS level of the cancer cell. It is already known that oxidative stress, which results from an imbalance between the production of ROS and the ability of cells to scavenge them, can trigger the opening of the mitochondrial permeability transition pore. This is known to result in extracellular delivery of mitochondrial DNA, which is normally embedded in the mitochondrial matrix.10,11 For our subsequent experiments, we focused on BCR::ABL1+ and KMT2A::AFF4+ models of ALL because they were the 2 genetic subtypes that showed the greatest disparity in both their intrinsic ROS levels and ability to stimulate CAF formation.
Mitochondrial DNA is bidirectionally transcribed, generating overlapping transcripts, which can form long, dsRNA structures whose production is usually restricted by the degradosome components, mtRNA helicase SUV3 and polynucleotide phosphorylase PNPase.12 However, the recent identification of mtdsRNA as a generator of an antiviral signaling response in humans,9 combined with our RNAseq findings showing a strong and very significant IFN pathway upregulation, prompted us to focus on mtdsRNA as a potential trigger for CAF formation. Thereafter, we readily demonstrated dsRNA inside the BCR::ABL1+ ALL cells and uptake by stromal cells after exposure to conditioned medium from BCR::ABL1+ ALL cells. We also found mtdsRNA in patient-derived xenograft samples grown in NSG mice, although we had insufficient samples to determine a relationship with the genetic subtype of ALL. The causal relationship between mtdsRNA and CAF formation was shown by the abrogation of CAF gene expression, cytokine secretion, and IFN-β secretion upon limiting dsRNA release into or degrading within the conditioned media.
Our data provide, to our knowledge, the first mechanistic insight into how ALL can directly influence the stromal microenvironment. They pave the way for further studies to determine the extent to which this mechanism contributes to the strong influence of genetic subtype on survival outcomes.
Data from the oncolytic virus field shed light on how transformed cells may “tolerate” the presence of dsRNA, whereas the IFN signaling pathway is strongly activated by stromal cells under the same circumstance. It is widely accepted that the particular susceptibility of cancer cells to oncolytic viruses is at least in part mediated by defects in their IFN response in cancer cells, as summarized by Matveeva and Chumakov.13 Previous work from our group used a stepwise model of transformation, in which oncogenic hits were additively expressed in human MSCs.14 Untransformed MSCs were very resistant to vaccine strain measles virus–mediated oncolysis because of a robust IFN response. However, susceptibility to the virus progressively increased with the level of transformation because of an increasing delay and very significant reduction in the magnitude of the IFN response. A contact-dependent transcytosis of cytoplasm from cancer cells into fibroblasts, which leads to STING- and IFR3-mediated expression of IFN-β, subsequently driving IFN-stimulated transcriptional programs in stromal fibroblasts, has also been demonstrated.15
In conclusion, our data reveal, to our knowledge, a previously unidentified mechanism by which contact-independent uptake of mitochondrial dsRNA from leukemia cells by MSCs drives the MSCs to a CAF phenotype. Our previous work shows that CAF can protect leukemia cells from ROS-inducing chemotherapy by donation of mitochondria, demonstrating the clinical relevance of our findings. Studies in other cancer types are warranted.
Acknowledgments
R.J.B. was supported by the Cancer Research UK (CRUK) Clinician Scientist Fellowship (RCCFEL/100017). A.D., A.K.F., and K.K. were supported by the Medical Research Council grant MR/W000148/1. The UKALL14 trial was funded by the CRUK grant CRUK/09/006 to A.K.F. Primary specimens were obtained from the UKALL14 biobank, which was funded by the CRUK grant C27995/A21019 to A.K.F. and Anthony V. Moorman.
Authorship
Contribution: R.J.B. and A.D. conducted experiments and contributed to manuscript writing; A.A., H.A., R.A., S.A., J.C., E.C., R.K., K.K., and T.M. conducted specific experiments; D.A. and J.A.G.-A. provided significant assistance with coding and bioinformatic analyses; J.M. provided significant assistance with confocal microscopy; A.K.F. conceived, funded, and supervised the project and wrote the manuscript; and all authors read and commented on the manuscript.
Conflict-of-interest disclosure: The authors declare no competing financial interests.
The current affiliation for A.K.F. is Hull York Medical School and York Biomedical Research Institute, University of York, York, United Kingdom.
Correspondence: Adele K. Fielding, University College London, Cancer Institute, 72 Huntley St, London WC1E 6DD, United Kingdom; email: a.fielding@ucl.ac.uk.
References
Author notes
R.J.B. and A.D. contributed equally to this study.
Count matrices and RNA sequencing data will be publicly available at https://github.com/EmCutlerUCL/B-ALL_mdsRNA_CAF_Count_Matrix_Data. All other data are available on request from the corresponding author, Adele K. Fielding (adele.fielding@york.ac.uk).
The full-text version of this article contains a data supplement.

