Key Points
Unbiased identification of genetic-morphologic patterns shows separated megakaryocyte nuclei are associated with STAG2 and ASXL1 mutations.
STAG2 mutations are additionally associated with abnormal myeloid nuclear segmentation and myeloid cell hypogranulation.
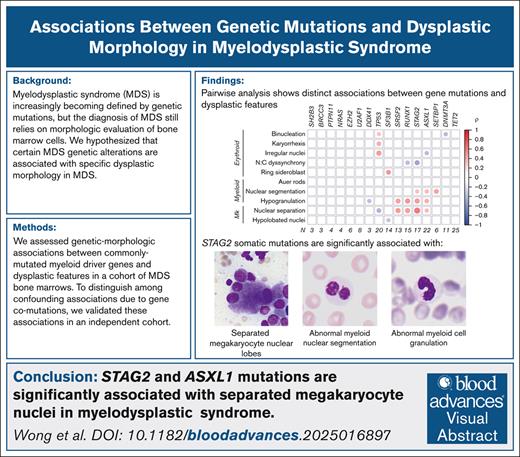
Visual Abstract
Myelodysplastic syndrome (MDS) is driven by genetic mutations, but diagnosis relies on morphologic evaluation of bone marrow hematopoiesis. Only a small number of genetic abnormalities define specific bone marrow morphologic features in MDS, such as SF3B1 mutations and deletions of chromosome 5q. We hypothesized that additional genetic alterations are associated with specific dysplastic morphologic features in MDS. We assessed genetic-morphologic associations between commonly mutated genes and 10 morphologic features in a cohort of MDS bone marrows with a high degree of dysplasia. We replicated the association of SF3B1 mutations with ring sideroblasts and found that dysplastic megakaryocytes with separated nuclei were independently associated with STAG2 and/or ASXL1 mutations. In addition, STAG2 mutations were associated with abnormal myeloid nuclear segmentation and myeloid cell hypogranulation. These findings demonstrate that STAG2 and ASXL1 mutations are associated with specific morphologic abnormalities in MDS.
Introduction
Our understanding of the genetic landscape in myelodysplastic syndrome (MDS) has grown rapidly over the past decade. Large-scale sequencing studies have demonstrated that specific genetic mutations are associated with patient outcomes.1-4 As a result, MDS subtypes are increasingly defined by genetic features.5,6
Nevertheless, histologic evaluation of bone marrow blasts and myelodysplasia remains a key component of MDS diagnosis. Only a few genetic aberrations have an established association with specific bone marrow features. MDS with isolated 5q deletion is associated with micromegakaryocytes, and MDS with SF3B1 mutations is associated with ring sideroblasts.7-9 We hypothesized that additional genetic-morphologic associations exist that can inform the role of these mutations in abnormal hematopoiesis. We rigorously evaluated 2 independent myelodysplastic cohorts to uncover genetic-morphologic associations between common myeloid gene mutations and bone marrow dysplastic features.
Methods
Cohort selection
A total of 272 patients with MDS, diagnosed according to World Health Organization criteria at Brigham and Women’s Hospital from 2013 to 2014 via bone marrow biopsy, were screened for the presence of prominent dysplastic features, and 89 bone marrow core biopsies and aspirates were selected for further analysis. Blinded pathology review (see “Pathology evaluation”) confirmed that 80 of 89 cases showed at least 1 dysplastic feature (of 10 evaluated features), which was rated as 3 (high) or 2 (moderate). Nine cases were downgraded to mild dysplasia (grade 1 in at least 1 dysplastic feature) after pathology review. Subsequently, we identified 1047 nonoverlapping patients diagnosed with a myeloid malignancy at Brigham and Women’s Hospital between 2014 and 2018, all of whom had available DNA next-generation sequencing data, including mutational status of 5 genes of interest identified in the discovery cohort: STAG2, RUNX1, SRSF2, ASXL1, and SETBP1. This enrichment cohort of 155 bone marrow biopsies and aspirates were selected on the basis of mutational profile to represent all combinations of mutations in STAG2, RUNX1, SRSF2, ASXL1, and SETBP1 that were present within eligible cases. The demographic and hematologic characteristics of this cohort were compared with the initial cohort (supplemental Table 5).
DNA sequencing
In the discovery cohort, targeted next-generation sequencing was performed using a 50-gene panel (supplemental Figure 1; supplemental Table 1). Samples in the enrichment cohort underwent clinical next-generation sequencing of 95 genes (supplemental Table 3).10 In both cohorts, pathogenic variants were classified as described previously.11 The minimum variant allele frequency (VAF) cutoff for mutation calling was 2%.
Pathology evaluation
Each bone marrow biopsy and aspirate smear in the discovery cohort was evaluated by 2 hematopathologists, blinded to diagnosis and genotype, and scored for 10 dysplastic features (small hypolobated megakaryocytes, widely separated megakaryocyte nuclei, abnormal myeloid nuclear segmentation, myeloid hypogranulation, Auer rods, ring sideroblasts, erythroid binucleation, irregular erythrocyte nuclei, erythroid nuclear cytoplasmic dyssynchrony, and erythroid karyorrhexis) by 2 independent hematopathologists on a scale of 0 (absent) to 3 (prominent; Figure 1A). In the enrichment cohort, widely separated megakaryocyte nuclei, compared to normal mononucleated megakaryocytes (supplemental Figure 2), were graded absent or present by 3 independent hematopathologists blinded to the diagnosis and genotype of each case. Myeloid nuclear segmentation and hypogranulation were scored by 2 independent hematopathologists on a scale of 0 (absent) to 3 (prominent). The median score was used, except in difficult to ascertain cases (n = 18), which underwent consensus review.
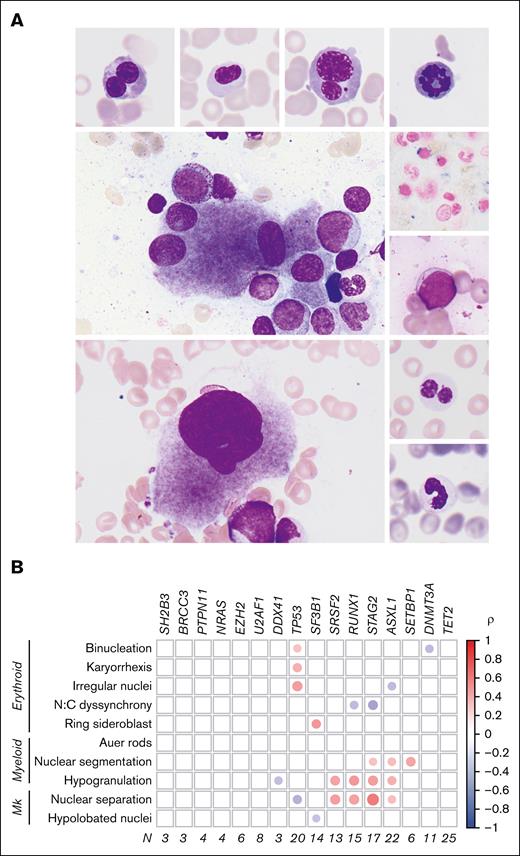
Genetic morphologic associations in MDS. (A) Dysplastic features evaluated include (clockwise from top left) erythroid binucleation, erythroid nuclear irregularity, erythroid karyorrhexis, erythroid mitosis, ring sideroblast, Auer rod, abnormal myeloid nuclear segmentation, myeloid hypogranulation, hypolobated megakaryocyte, and separated megakaryocyte nuclei. (B) Correlation matrix showing association between evaluated dysplastic features and gene mutations in the discovery cohort. Only associations with adjusted P value < .05 are shown. The area of each circle represents the absolute Spearman correlation coefficient (ρ). Mk, megakaryocytes; N, number of samples; N:C, nuclear-to-cytoplasmic.
Genetic morphologic associations in MDS. (A) Dysplastic features evaluated include (clockwise from top left) erythroid binucleation, erythroid nuclear irregularity, erythroid karyorrhexis, erythroid mitosis, ring sideroblast, Auer rod, abnormal myeloid nuclear segmentation, myeloid hypogranulation, hypolobated megakaryocyte, and separated megakaryocyte nuclei. (B) Correlation matrix showing association between evaluated dysplastic features and gene mutations in the discovery cohort. Only associations with adjusted P value < .05 are shown. The area of each circle represents the absolute Spearman correlation coefficient (ρ). Mk, megakaryocytes; N, number of samples; N:C, nuclear-to-cytoplasmic.
Statistical analysis
Statistical analysis was performed in R (version 3.5) using the corrplot package to derive Spearman correlation coefficients between dysplastic features and the VAF of each gene that was mutated in ≥3 patients. Stats package was used for odds ratio (OR) analysis. Wald confidence interval (CI) and Fisher exact P value were used in univariate analyses. For each dysplastic feature, genes identified in univariate analysis were tested by multivariable logistic regression using backward elimination by Akaike (MASS package). The discovery cohort was resampled 100× into train (80%) and test (20%) sets to determine the VAF that best predicted specific dysplastic features with at least 75% accuracy (Rpart package). A default VAF cutoff of 0.1 was used for genes without splits.
All studies involving human participants were conducted in accordance with ethical guidelines established by the Declaration of Helsinki and were approved by the relevant institutional review board.
Results
We surveyed 272 patients diagnosed with MDS according to World Health Organization criteria and selected 89 bone marrow core biopsies and aspirate smears on the basis of having a high degree of dysplasia of any type. In pairwise analyses of dysplastic phenotypes (Figure 1A) and somatic mutations (supplemental Table 2) ASXL1, SETBP1, SRSF2, STAG2, and RUNX1 mutations were associated with myeloid and megakaryocytic dysplasia (Figure 1B). Somatic mutations in TP53 and SF3B1 were associated with a distinct morphologic phenotype, including erythroid dysplasia, consistent with known roles for these genes in erythropoiesis.12,13
Univariate analysis demonstrated that megakaryocytes with widely separated nuclei were significantly associated with mutations in STAG2 (OR, 22.2; 95% CI, 4.59-107.8; P = 3.59 × 10⁻⁶), SRSF2 (OR, 14.85; 95% CI, 3.02-72.9; P = .0001), RUNX1 (OR, 7.15; 95% CI, 2.04-25.1; P = .002), and ASXL1 (OR, 4.33; 95% CI, 1.54-12.2; P = .008; supplemental Figure 3A). In multivariable analysis, only STAG2 and SRSF2 mutations were significantly and independently associated with widely separated nuclei in megakaryocytes (STAG2 [OR, 32.4; 95% CI, 5.45-624.0; P = .001] and SRSF2 [OR, 8.87; 95% CI, 1.68-67.6; P = .015]; supplemental Figure 3A). We observed that STAG2, SRSF2, RUNX1, and ASXL1 mutations demonstrated some gene dosage effects on the incidence of separated megakaryocyte nuclei, although these effects were likely confounded by the presence of comutations (supplemental Figure 4). We iteratively partitioned each gene of interest based on VAF to determine the threshold that best predicted megakaryocyte nuclear lobe separation. With the exception of RUNX1 (allele frequency cutoff, 0.40), this analysis identified VAF cutoffs for STAG2, SRSF2, and ASXL1 ranging from 0.03 to 0.10 for detecting megakaryocyte nuclear lobe separation (supplemental Figure 5).
STAG2 gene mutations were associated not only with separated megakaryocyte nuclei but also with myeloid dysplasia. In univariate analysis, granulocytes with hypolobated or hypersegmented nuclei were significantly associated with mutations in STAG2 (OR, 3.68; 95% CI, 1.21-11.3; P = .03), NRAS (OR, 10.4; 95% CI, 1.02-106.0; P = .045), SETBP1 (OR, 19.4; 95% CI, 2.12-177.3; P = .003), RUNX1 (OR, 3.44; 95% CI, 1.08-11.0; P = .047), and ASXL1 (OR, 3.82; 95% CI, 1.34-10.9; P = .02; supplemental Figure 3B). Multivariable analysis showed independent significant associations of both STAG2 and SETBP1 mutations with abnormal granulocytic nuclear segmentation (STAG2 [OR, 7.08; 95% CI, 1.94-28.0; P = .004]; SETBP1 [OR, 12.2; 95% CI, 1.29-267.4; P = .042]; supplemental Figure 3B). Furthermore, STAG2 mutations were significantly associated with myeloid cell hypogranulation in both univariate (OR, 5.45; 95% CI, 1.71-17.4; P = .004) and multivariable analyses (OR, 12.7; 95% CI, 3.10-86.3; P = .002; supplemental Figure 3C).
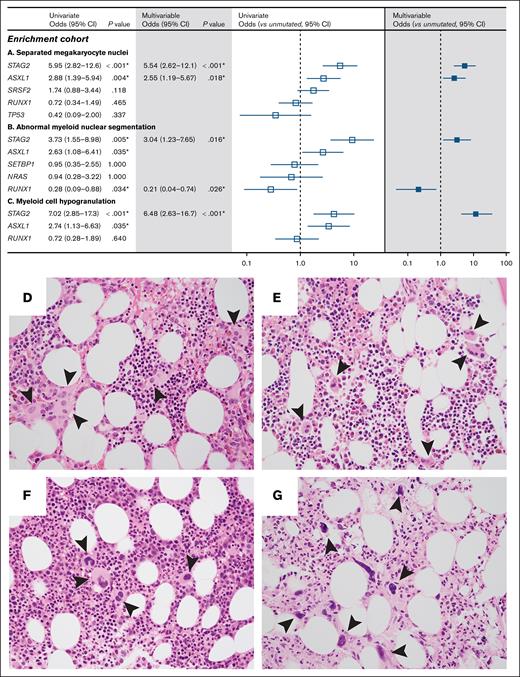
Because co-occurrence of mutations in the discovery cohort potentially confounded the association of individual gene mutations with particular morphologic abnormalities, we compiled a group of 155 myeloid neoplasms with myelodysplastic features that were enriched for comutations in ASXL1, RUNX1, SETBP1, SRSF2, and STAG2 (supplemental Figure 6; supplemental Table 4). In this enrichment cohort, STAG2 mutations were significantly associated with separated megakaryocyte nuclei (univariate OR, 5.95; 95% CI, 2.82-12.6; P = 6.0 × 10⁻⁶; multivariable OR, 5.54; 95% CI, 2.62-12.1; P = 1.41 × 10⁻⁵), abnormal myeloid nuclear segmentation (univariate OR, 3.73; 95% CI, 1.55-8.98; P = .005; multivariable OR, 3.04; 95% CI, 1.23-7.65; P = .02), and myeloid cell hypogranulation (univariate OR, 7.02; 95% CI, 2.85-17.3; P = 1.85 × 10⁻⁶; multivariable OR, 6.48; 95% CI, 2.63-16.7; P = 5.68 × 10⁻⁶; Figure 2A-C). Inclusion of samples with SRSF2 mutations only, ASXL1 mutations only, and samples with ASXL1 and SRSF2 comutations enabled the effect of these genes to be disambiguated. For example, the association of SRSF2 mutations with separated megakaryocyte nuclei in the discovery cohort was likely due to comutation with STAG2 and was not confirmed in enrichment analysis (supplemental Figure 3A; Figure 2A). Consistent with findings from univariate analysis in the discovery cohort, ASXL1 mutations were associated with separated megakaryocyte nuclei in the enrichment cohort (univariate OR, 2.88; 95% CI, 1.39-5.94; P = .004; multivariable OR, 2.55; 95% CI, 1.19-5.67; P = .018).
Specific gene mutations are associated with dysplastic features. Forest plots of univariate (open) and multivariable (filled) analyses for gene mutations associated with separated megakaryocyte nuclei (A), abnormal myeloid nuclear segmentation (B), and myeloid hypogranulation (C) in the enrichment cohort. (D-G) Bone marrow biopsy micrographs demonstrate megakaryocytes with widely separated nuclei (arrowheads) in a patient with STAG2, SRSF2, ASXL1, IDH2, KRAS, PTPN11, and subclonal CUX1 and RUNX1 mutations (D) and a patient with germ line GATA2 and secondary somatic STAG2 mutations (E); in contrast, dysplastic megakaryocytes (arrowheads) are present but do not display separated nuclei in a patient with ASXL1, RUNX1, SRSF2, and TET2 mutations (F) or a patient with ASXL1 and SRSF2 mutations (G).
Specific gene mutations are associated with dysplastic features. Forest plots of univariate (open) and multivariable (filled) analyses for gene mutations associated with separated megakaryocyte nuclei (A), abnormal myeloid nuclear segmentation (B), and myeloid hypogranulation (C) in the enrichment cohort. (D-G) Bone marrow biopsy micrographs demonstrate megakaryocytes with widely separated nuclei (arrowheads) in a patient with STAG2, SRSF2, ASXL1, IDH2, KRAS, PTPN11, and subclonal CUX1 and RUNX1 mutations (D) and a patient with germ line GATA2 and secondary somatic STAG2 mutations (E); in contrast, dysplastic megakaryocytes (arrowheads) are present but do not display separated nuclei in a patient with ASXL1, RUNX1, SRSF2, and TET2 mutations (F) or a patient with ASXL1 and SRSF2 mutations (G).
Discussion
STAG2 encodes a member of the ring-shaped cohesin complex that is required for DNA loop extrusion, transcriptional regulation, DNA damage repair, and sister chromatid cohesion. STAG2 is often mutated in cancer, including in the germ line leading to Cornelia de Lange syndrome, a childhood cohesinopathy characterized by well-defined facial features, limb malformations, and low platelet count, although a link to dysmegakaryopoiesis remains unproven.14,15 Among myeloid malignancies, STAG2 mutations are particularly associated with MDS and define a subset of acute myeloid leukemia that arise out of an antecedent myeloid neoplasm.16,17 Although a prior study of “de novo” acute myeloid leukemia also described an association between STAG2 mutations and megakaryocyte dysplasia in a small sample size,18 our analysis of 17 and 50 individuals with mutated STAG2 in 2 independent cohorts (one unbiased and one enriched for STAG2 mutations) demonstrated a robust association between STAG2 mutation and separated megakaryocyte nuclei as a feature of myelodysplasia. Nevertheless, the precise role of STAG2 in megakaryopoiesis and MDS pathogenesis remains unclear. A recent study demonstrated that inactivation of cohesin-mediated loop extrusion in myeloid cells results in nuclear hypersegmentation and neutrophil differentiation, suggesting a potential mechanism for STAG2 and other cohesin components in regulating nuclear segmentation and shape.19 Dysplastic megakaryocytes demonstrate uneven chromosome ploidy within each separate nuclei, but it is unknown whether this phenomenon is predicated on loss of cohesin complex function.20
In conclusion, we report that the presence of separated megakaryocyte nuclei in MDS is strongly associated with mutations in STAG2 (69% of mutated vs 22% of unmutated; P < .0001) and ASXL1 (47% of mutated vs 24% of unmutated; P = .0002). Additionally, STAG2 mutations in MDS are significantly associated with abnormal myeloid nuclear segmentation (58% vs 19%; P < .0001) and myeloid cell hypogranulation (74% vs 21%; P < .0001). These associations show similar strength to previously observed associations between SF3B1 mutation and ring sideroblasts.9 Further investigation is required to determine whether STAG2 and ASXL1 mutations confer specific functional deficits in megakaryocyte and myeloid cell differentiation in MDS.
Acknowledgments
The authors gratefully acknowledge the patients who provided biological samples and data for this study.
B.L.E. is supported by National Institutes of Health (NIH), National Heart, Lung, and Blood Institute (NHLBI) grant R01HL082945, NIH, National Cancer Institute grants P01CA066996 and P50CA206963, the Edward P. Evans Foundation, and the Adelson Medical Research Foundation. B.L.E. and E.A.M. were supported by the Leukemia and Lymphoma Society/RUNX1 Research Program Translational Research Program (6556-18). W.J.W. is supported by NIH, NHLBI grant K08HL171879 and a RUNX1 Research Program/Alex's Lemonade Stand Foundation Early Career Investigator grant. R.L.Z. is supported by the American Society of Hematology Research Training Award for Fellows and the Mark Foundation for Cancer Research Physician-Scientist of the Damon Runyon Cancer Research Foundation (PST-44-24). The work of Z.T. was supported by NIH, NHLBI grant 1R01HL171973, the Edward P. Evans Foundation, the Burroughs Wellcome Fund, the Doris Duke Charitable Foundation, the Gabrielle Angel’s Foundation, the Ludwig Center at Harvard, and the RUNX1 Foundation.
Authorship
Contribution: B.L.E., E.M.B., E.A.M., M.R.L., C.J.G., and Z.T. conceived and designed the project and secured funding; W.J.W., E.A.M., M.R.L., C.J.G., and Z.T. assembled patient cohorts; E.A.M. and C.J.G. interpreted sequencing data; W.J.W., C.H., O.P., and E.A.M. reviewed pathology; W.J.W., R.L.Z., and D.N. analyzed results; W.J.W., R.L.Z., and B.L.E. wrote the manuscript; and all authors revised the manuscript for intellectual content.
Conflict-of-interest disclosure: B.L.E. reports research funding from Novartis and Calico; consulting fees from AbbVie; and is a member of the scientific advisory board for and shareholder in Neomorph Inc, Big Sur Bio, Skyhawk Therapeutics, and Exo Therapeutics. R.L.Z. is a consultant for and stockholder in Triveni Bio. D.N. reports stock ownership in Madrigal Pharmaceuticals. Z.T. reports research funding from Novartis, not related to this work. C.H. is a full-time employee of Foundation Medicine, Inc, which was not involved in this study. The remaining authors declare no competing financial interests.
The current affiliation for W.J.W. is Department of Pathology, Northwestern University, Chicago, IL.
The current affiliation for O.P. is Department of Pathology and Laboratory Medicine, Hospital of the University of Pennsylvania, Philadelphia, PA.
The current affilation for C.J.G. is Novartis Biomedical Research, Cambridge, MA.
Correspondence: Benjamin L. Ebert, Department of Medical Oncology, Dana-Farber Cancer Institute, 450 Brookline Ave, Boston, MA 02215; email: benjamin_ebert@dfci.harvard.edu.
References
Author notes
W.J.W. and R.L.Z. contributed equally to this study.
Sequencing and morphologic data may be found in a data supplement available with the online version of this article.
The full-text version of this article contains a data supplement.


