Key Points
VpreB1 is a unique component of the pre–B-cell receptor and is expressed by most B-ALLs, but not by mature lymphocytes.
An ADC targeting VpreB1 demonstrated preclinical efficacy against B-ALL cell lines and patient-derived xenograft models.
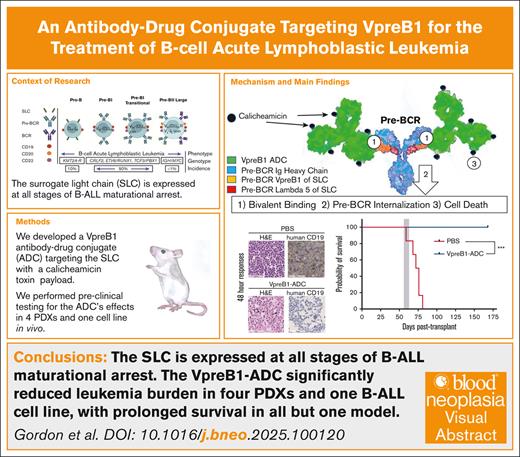
Visual Abstract
B-lineage acute lymphoblastic leukemia (B-ALL) therapy is being transformed by therapies targeting antigens such as CD19, CD20, and CD22 on the surface of B-ALL cells. Moreover, having therapies targeting these different B-ALL antigens has helped address challenges associated with both intra- and inter-patient variability in targeted antigen expression levels and antigen loss as mechanisms of therapy resistances. To further expand the range of targetable antigens in B-ALL therapy, we developed a novel antibody-drug conjugate (ADC) that targets the VpreB1 (CD179a) component of the surrogate light chain. VpreB1 is expressed across most B-ALL molecular subtypes but otherwise has expression limited to precursor B cells, but not mature B cells. Our VpreB1 antibody demonstrated high affinity for its target protein and when conjugated to the toxin calicheamicin (VpreB1-ADC) exhibited significant in vitro toxicity against B-ALL cells harboring a range of genomic alterations. In vivo, the VpreB1-ADC was well tolerated in mice, with modest weight loss and decreased white blood cell counts. When tested against a B-ALL cell line and multiple B-ALL patient-derived xenograft models, the VpreB1-ADC significantly reduced leukemia burden, prolonged survival, and cured a subset of mice. These promising results support further investigation of the VpreB1 component of the surrogate light chain as a therapeutic target, including the VpreB1-ADC in preclinical and clinical trials, with the goal of expanding the arsenal of immunoconjugates available for the treatment of B-ALL.
Introduction
B-lineage acute lymphoblastic leukemia/lymphoma (B-ALL) is the most common malignancy in children and young adults.1,2 Although intensive, multiagent chemotherapy regimens can cure ∼85% of children and 40% of adults with B-ALL, these treatment regimens carry significant risks of both acute and long-term toxicities. Moreover, these regimens have demonstrated reduced efficacy in patients with high-risk or relapsed/refractory leukemias, and further intensification of treatment often results in diminishing clinical benefits accompanied by increased toxicity. Consequently, recent efforts in B-ALL therapy have shifted toward the exploration of novel targeted therapies, initially in relapsed/refractory cases and more recently as part of frontline treatment regimens.3 B-ALL cells express multiple surface antigens, including CD20, CD22, and CD19, which can be targeted by monoclonal antibodies, ADCs, bispecific T-cell engagers antibodies, and chimeric antigen receptor T cells.4-8 The impressive clinical efficacy of these therapies to date is transforming B-ALL management and illustrates that B-ALL can be highly responsive to targeted therapies.
However, despite the ability to target several B-ALL antigens, there is still a currently unmet need to develop additional new therapies for B-ALL. The presence and expression level of surface antigens on B-ALL cells can vary significantly between patients and even between different leukemia clones within the same patient. In addition, antigen loss is a well-documented mechanism of relapse after immunotherapy, making it necessary to target multiple antigens either sequentially or concurrently to improve treatment efficacy.9-13 Moreover, current B-ALL therapies target antigens with broad expression across normal B-cell developmental stages, which can cause on-target, off-tumor B-cell aplasia with subsequent risks of hypogammaglobulinemia and infections.14-18 This immune dysregulation can persist for months or even years after treatment,19 highlighting the need to identify and target novel antigens on B-ALL cells that are more restricted to malignant, immature B-lymphoblasts, in contrast to mature, antibody-producing B cells.
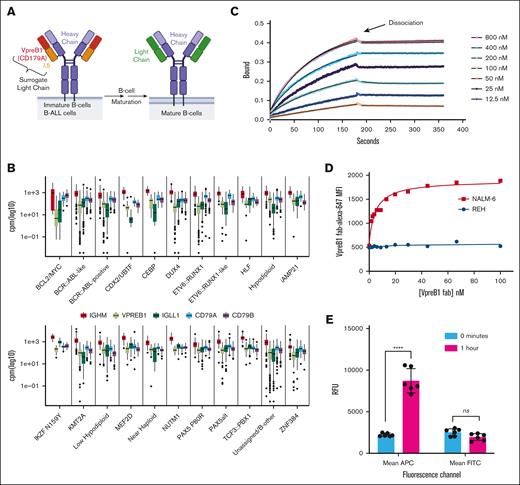
Expression of surrogate light chain (SLC) components, VpreB1 (CD179a) and IGLL1 (CD179b), is highly restricted to the early stages of B-cell development (Figure 1A).20-23 Although the SLC is best characterized as critical to assembly and function of the pre–B-cell receptor (pre-BCR) complex, early work established that the SLCs can be detected on precursor B cells in complex with other glycoproteins even before immunoglobulin H (IgH) loci rearrangement. As its name implies, once pro-B cells express rearranged immunoglobulin heavy chains, the SLC functions as a substitute in advance of light chain rearrangements to coassemble with the BCR signaling Igα and Igβ components. The pre-BCR signaling cascade then cooperates with interleukin-7 signaling to drive further B-cell development. As B cells mature, the SLC is subsequently replaced by the mature light chain.23
VpreB1 is expressed across a spectrum of B-ALLs and can be targeted with an antibody. (A) Schematic illustrating the expression of the SLC, consisting of VpreB1 (CD179a) and IGLL1 (CD179b or λ5), during B-cell and B-ALL development. (B) Gene expression of pre-BCR component-encoding genes was analyzed across 3532 B-ALL samples, classified into 21 molecular subtypes, with counts normalized using counts per million.24 (C) The binding and dissociation of varying recombinant VpreB1/λ5 concentrations to anti-VpreB1 antibody were measured with biolayer interferometry. The experiment was performed in triplicate, and representative data are revealed. The association and dissociation transients were used to estimate a binding affinity Kd = 26.7 nM (±2.5 nM). (D) MFI of NALM-6 and REH leukemia cells incubated with increasing concentrations of VpreB1-AF647 antibody. (E) Internalization of cell surface VpreB1 protein on NALM-6 cells was measured by labeling the cells with both a fluorescent (AF647) and biotin conjugated anti-VpreB1 antibody. Internalization was then either blocked by incubation on ice or allowed to proceed for 1 hour at 37°C. Cells were then labeled with fluorescein isothiocyanate (FITC)-Neutravidin and assessed by flow cytometry. FITC fluorescence corresponds to relative cell surface anti-VpreB1 and APC (AF647) fluorescence to total cell surface and intracellular anti-VpreB1. Error bars represent the mean ± standard deviation (SD). ∗∗∗∗P < .0001 by t test. MFI, mean fluorescent intensity; ns, not significant; RFU, relative fluorescence units.
VpreB1 is expressed across a spectrum of B-ALLs and can be targeted with an antibody. (A) Schematic illustrating the expression of the SLC, consisting of VpreB1 (CD179a) and IGLL1 (CD179b or λ5), during B-cell and B-ALL development. (B) Gene expression of pre-BCR component-encoding genes was analyzed across 3532 B-ALL samples, classified into 21 molecular subtypes, with counts normalized using counts per million.24 (C) The binding and dissociation of varying recombinant VpreB1/λ5 concentrations to anti-VpreB1 antibody were measured with biolayer interferometry. The experiment was performed in triplicate, and representative data are revealed. The association and dissociation transients were used to estimate a binding affinity Kd = 26.7 nM (±2.5 nM). (D) MFI of NALM-6 and REH leukemia cells incubated with increasing concentrations of VpreB1-AF647 antibody. (E) Internalization of cell surface VpreB1 protein on NALM-6 cells was measured by labeling the cells with both a fluorescent (AF647) and biotin conjugated anti-VpreB1 antibody. Internalization was then either blocked by incubation on ice or allowed to proceed for 1 hour at 37°C. Cells were then labeled with fluorescein isothiocyanate (FITC)-Neutravidin and assessed by flow cytometry. FITC fluorescence corresponds to relative cell surface anti-VpreB1 and APC (AF647) fluorescence to total cell surface and intracellular anti-VpreB1. Error bars represent the mean ± standard deviation (SD). ∗∗∗∗P < .0001 by t test. MFI, mean fluorescent intensity; ns, not significant; RFU, relative fluorescence units.
Previously, we demonstrated using flow cytometry that all 36 standard- and high-risk pediatric B-ALL samples tested expressed VpreB1 at diagnosis.25 Moreover, VpreB1 was also consistently expressed in samples with postinduction minimal residual disease >1%. Given that VpreB1 is expressed on precursor B-ALL cells but not on mature B cells, it represents an attractive and highly specific target for molecularly targeted therapy. In this context, we describe the development and testing of a novel VpreB1-ADC for the treatment of B-ALL with potent preclinical activity in vitro against human cell lines and in vivo in patient-derived xenograft (PDX) models.
Methods
Human leukemia cell lines and tissue culture
Leukemia cell lines were obtained from American Type Culture Collection or DSMZ and cultured in RPMI media (Sigma-Aldrich) supplemented with fetal bovine serum (Cytiva HyClone) 10% and penicillin-streptomycin (Sigma-Aldrich). For the bioluminescence experiments, the NALM-6 cell line was labeled with luciferase according to established protocols.26
PDXs
We used the ALLCatchR classification system24 to select 10 representative human leukemia PDX models from the pro-B (n = 1), pre-B1 (n = 6), and pre-B1 transitional (n = 3) stages of B-cell development (supplemental Table 1; supplemental Figure 1). B-ALL PDX models were obtained from the Public Repository of Xenografts (PRoXe,27 Dana Farber Cancer Institute) and the Public Resource of Patient-Derived and Expanded Leukemias (PROPEL, St Jude): PDX B1 (KMT2A-R, CBAB-62871-V1; PRoXe), B2 (CRLF2::JAK2, CBAB-29894-V2, PRoXe), B3 (TCF3::PBX1, SJBALL055669_D1, PROPEL), B4 (IGH::CRLF2, SJBALL206_D1, PROPEL), B5 (TCF3::PBX1, CBAB-35186-V0, PRoXe), B7 (BCR::ABL, DFAB-74952-V1, PRoXe), B8 (CDKN2A deletion, CBAB-99562-V1, PRoXe), B9 (ETV6::RUNX1, SJBALL019053_R1, PROPEL), and B10 (SJETV026_D, PROPEL) and AALL180728 (TCF3::HLF, Children’s Hospital of Philadelphia).
Protein and ADC synthesis
Humanized, monoclonal anti-VpreB1 (IgG1 isotype)29 was either produced by GenScript or generated, as described in the supplemental Methods. Soluble light chain protein (VpreB1-λ5 fusion) was generated also as described in the supplemental Methods. To generate Vpreb1-ADC, the VpreB1 antibody was covalently linked through an acid-labile 4-(4′-acetylphenoxy) butanoic acid (acetyl butyrate) to N-acetyl ɣ-calicheamicin 1, 2-dimethyl hydrazine dichloride using a lysine conjugation process (Creative Biolabs). The VpreB1-ADC was determined to have a drug-to-antibody ratio of 4.97, aggregation level of 1.63%, and endotoxin level of <1 EU/mg.
VpreB1 antibody binding studies
Biolayer interferometry was used to measure binding of soluble light chain (VpreB1-λ5 fusion) to biotinylated VpreB1 antibody immobilized to streptavidin 2.0 capture tips using a single-channel Forte Bio BLItz (Sartorius). Tips were equilibrated in an assay buffer (phosphate-buffered saline [PBS] with 0.05% Tween 20), loaded with biotinylated VpreB1 antibody 200 nM, and then tested with increasing concentrations of purified soluble light chain (12.5-800 nM). The association and dissociation transients were analyzed globally using the instrument’s software to obtain second-order association constant kon, dissociation constant koff, and estimates of binding affinity Kd. Studies of binding of VpreB1 antibody to leukemia cells used a VpreB1 antibody labeled with AF647 fluorophore (supplemental Methods). Varying concentrations of VpreB1-AF647 antibody were incubated with 50 000 REH and NALM-6 cells for 1 hour, washed 3 times, and then analyzed on an Accuri C5 Plus flow cytometer (BD Biosciences). Mean fluorescence intensity for AF647 in each sample was determined using FlowJo software (BD Biosciences). Finally, VpreB1 antibody binding capacity for normal bone marrow mononuclear cells (n = 3) and malignant B-cell lines and PDX model cells (n = 17, once each) was determined using the Quantibrite PE Phycoerythrin Fluorescence Quantitation Kit (BD Biosciences), according to manufacturer’s instructions, on a BD FACSCanto II flow cytometer. Samples were stained with VpreB1-PE (BioLegend; catalog no. 347404), CD19-PC7 (Beckman; catalog no. IM3628U), CD10-FITC (BD Biosciences; catalog no. 340698), CD20-APC (BD Biosciences; catalog no. 340940), CD34-PerCP-Cy5.5 (BD Biosciences; catalog no. 347213), and CD45-APC-H7 (BD Biosciences; catalog no. 641408) antibodies. Flow cytometric data were analyzed with Kaluza (Beckman Coulter) for VpreB1 antibody binding capacity in viable CD19/CD45 expressing B-cell populations. For bone marrow mononuclear cells, B-cell developmental progression was assigned based on CD10 and CD20 expression (supplemental Figure 2C).30
VpreB1-ADC cytotoxicity assays
Leukemia cell lines and PDX-origin cells were cultured in 96-well plates in the presence of VpreB1-ADC or VpreB1 antibody for 48 hours. Leukemia viability was assessed with the CellTiter-Glo Luminescent Cell Viability Assay (Promega) and a Tecan Infinite M200 Pro plate reader. All experiments were performed with at least 3 wells per condition.
VpreB1-ADC toxicity and efficacy testing in vivo in cell line and PDX murine models
NSG (NOD.Cg-Prkdcscid, Il2rgtm1Wjl/SzJ; Jackson Labs, Bar Harbor, ME) mice were housed under aseptic conditions and received autoclaved cages, bedding material, water, bottles, and irradiated food. Mouse care and experiments were in accordance with a protocol (no. 2204-39979A) approved by the Institutional Animal Care and Use Committee at the University of Minnesota. NSG mice were treated with VpreB1-ADC 2 mg/kg by intraperitoneal injection every 4 days for 3 doses. Mice were weighed weekly. Mice were also bled weekly through the facial vein. Blood was collected in a heparinized microhematocrit tube and analyzed using a Hemavet hematology analyzer.
Furthermore, 5- to 7-week-old NSG mice were injected IV through the tail vein with ∼1 × 10⁶ leukemia cells. Beginning ∼4 weeks after injection, biweekly peripheral blood samples were collected through the facial vein bleeding and assessed for human leukemia cells using human CD19 (BD Biosciences; catalog no. 557697) and CD45 (BD Biosciences; catalog no. 563879) staining and flow cytometry. When 1% to 5% leukemia cells were detectable in the peripheral blood, the mice were treated with VpreB1-ADC (2 mg/kg), VpreB1 antibody (2 mg/kg), or vehicle-only control by intraperitoneal injection every 4 days for 3 doses. Several approaches were used to assess leukemia response to therapy. First, mice were euthanized, femurs and spleens collected, and cells isolated for flow cytometry. Cells were stained with fluorescent antibodies against human CD19 (BD Biosciences; catalog no. 557697) and CD45 (BD Biosciences; catalog no. 563879) and a fixable viability dye eFluor 780 (eBioscience; catalog no. 65-0865). Viable leukemia cells were quantitated by flow cytometry using a BD Accuri C6 or Symphony instrument. Second, femurs and spleen were placed in fixative and then used for immunohistochemistry (IHC) as described subsequently. Third, mice transplanted with leukemia cells expressing luciferase (NALM-6 and PDX B4) were followed by bioluminescent imaging (BLI). Finally, survival times were recorded, and Kaplan-Meier survival curves were generated for each treatment group.
BLI
BLI was performed using the IVIS Spectrum In Vivo Imaging System (PerkinElmer; University of Minnesota Imaging Centers). Mice were anesthetized using isoflurane 2% and injected intraperitoneally with D-luciferin (150 mg/kg; GoldBio) prepared in PBS. Luminescence data were acquired 10 minutes after injection using the automatic acquisition settings in IVIS Living Image software. Subsequent images and figure data were derived from whole-body radiance as measured in Living Image.
IHC
Unstained mouse femur and spleen sections (4 μm) were deparaffinized and rehydrated using standard methods. For antigen retrieval, slides were incubated in EDTA pH 8.0 buffer in a steamer for 30 minutes at 95 to 98°C , followed by a 20-minute cool-down period. Slides were rinsed for 5 minutes and transferred to Tris-buffered saline with Tween 20 (TBST) buffer. Endogenous peroxidase activity was quenched by slide immersion in 3% hydrogen peroxide solution for 10 minutes followed by a water rinse and TBST rinse. A serum-free blocking solution, Rodent Block M (Biocare Medical) was placed on sections for 15 minutes. Blocking solution was removed and slides were incubated in primary antibody diluted in 10% blocking solution/90% TBST. Rabbit monoclonal anti-CD19 (clone EPR5906 1:250) was incubated for 60 minutes at room temperature followed by TBST rinse and detection with Rabbit on Rodent Polymer (Biocare Medical) using the manufacturer’s specifications. All slides then proceeded with TBST rinse and detection with diaminobenzidine (BioLegend). Slides were incubated for 5 minutes followed by Tris-buffered saline rinse then counterstained with CAT Hematoxylin (Biocare) for 5 minutes. Slides were then dehydrated and cover slipped.
Statistical analyses
Results are displayed as the mean ± standard deviation. All graphing, curve fitting (nonlinear regression, sigmoidal, 4-parameter logistic, X is log[concentration]), and statistical significance testing were performed using GraphPad Prism 10.1.1 software (GraphPad Software). The log-rank (Mantel-Cox) test was used to calculate P values comparing the mouse survival curves. P values <.05 were considered statistically significant.
Results
VpreB1 is highly expressed across a spectrum of pediatric B-ALLs
To assess the therapeutic potential of targeting VpreB1, we assessed VPREB1 messenger RNA (mRNA) expression across pediatric cancers and within B-ALL molecular subtypes.24,31 As expected, given its role in B-cell development, VPREB1 mRNA was much more highly expressed in B-ALL compared with T-cell ALL (T-ALL), acute myeloid leukemia (AML), solid tumors, or brain tumors (supplemental Figure 2A-C). VPREB1 was generally highly expressed across B-ALL molecular subtypes, except for BCL2/MYC cases (Figure 1B; supplemental Figure 2A). In addition, other components of the pre-BCR (IGLL1, IGHM, CD79A, CD79B) coexpressed with VPREB1 (Figure 1B). Because the VpreB1 protein must localize to the cell surface to serve as a therapy target, we next quantified VpreB1 surface expression in B-ALL cell lines and multiple B-ALL PDXs with B-lineage developmental stages predicted based on gene expression profiles (supplemental Figure 1).24 VpreB1 surface expression in the B-ALL cell lines (n = 5) and PDXs (n = 10) ranged from 13% to 98% (supplemental Table 1; supplemental Figure 3A). In cells that expressed VpreB1, VpreB1 molecules per cell ranged from 245 to 3788, except for NALM-6 which revealed 31 945 VpreB1 molecules per cell (supplemental Figure 3B). As a comparison to the leukemia cells, developing B cells in normal bone marrow revealed a comparable number of VpreB1 molecules per cell (supplemental Figure 3C-D).
A VpreB1-ADC targets B-ALL cell lines and PDX models in vitro
We assessed binding of a humanized anti-VpreB1 antibody29 to recombinant soluble light chain protein (VpreB1-λ5 fusion) using biolayer interferometry (Figure 1C). The VpreB1 antibody demonstrated robust binding and low dissociation to its target protein (estimated Kd = 26.7 nM ± 2.5 nM), comparable to other therapeutic antibodies.32 We then fluorescently labeled the antibody and tested its binding with NALM-6 and REH B-ALL cells which express high and low levels of VpreB1 on the cell surface, respectively (supplemental Table 1).33 As predicted, the VpreB1 antibody exhibited greater dose-dependent binding to NALM-6 cells, confirming its specificity for VpreB1 in a cellular context (Figure 1D). Finally, we confirmed that the VpreB1 antibody is rapidly internalized by NALM-6 cells (Figure 1E), a critical characteristic for an effective ADC.
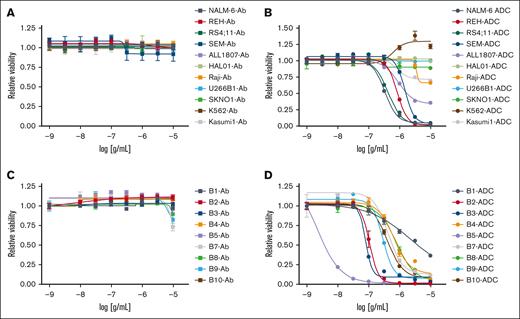
Next, we conjugated the humanized anti-VpreB1 antibody to calicheamicin, a potent DNA-binding cytotoxic agent, through an acid-labile linker to create a novel VpreB1-ADC.34-36 We generated dose-response curves for the VpreB1-ADC and the unconjugated VpreB1 antibody across multiple B-ALL (NALM-6, REH, RS4;11, SEM, ALL1807, HAL01), mature B cell (Raji, Burkitt lymphoma; U266B1; multiple myeloma), AML (Kasumi-1, SKNO), and chronic myeloid leukemia (K562) cell lines (Figure 2A-B; supplemental Table 1) using a cell proliferation and viability assay. Although the VpreB1 antibody had minimal effect, the VpreB1-ADC exhibited dose-dependent toxicity against most B-ALL cell lines with varying potencies. However, the VpreB1-ADC was less effective against B-ALL cells harboring a TCF3::HLF translocation (HAL01 and ALL1807). The VpreB1-ADC also demonstrated no significant effects on mature B cell, AML, and chronic myeloid leukemia cell lines, which are predicted to have lower VPREB1 expression (supplemental Figure 2A). Consistent with the proliferation assay, VpreB1-ADC also significantly increased leukemia cell apoptosis, as evidenced by increased annexin-V and viability dye staining (supplemental Figure 4). In agreement with the proliferation assay, ALL1807 had less apoptosis in the presence of VpreB1-ADC than the other leukemia cell lines tested.
In vitro VpreB1-ADC efficacy against B-ALL. VpreB1 antibody (A,C) and VpreB1-ADC (B,D) dose-response curves for leukemia cell lines (A-B) and B-ALL PDX models (C-D). Leukemia cell viability was assessed after 48 hours of treatment using the CellTiter-Glo Luminescent Cell Viability Assay. Error bars represent the mean ± SD of 3 technical replicates.
In vitro VpreB1-ADC efficacy against B-ALL. VpreB1 antibody (A,C) and VpreB1-ADC (B,D) dose-response curves for leukemia cell lines (A-B) and B-ALL PDX models (C-D). Leukemia cell viability was assessed after 48 hours of treatment using the CellTiter-Glo Luminescent Cell Viability Assay. Error bars represent the mean ± SD of 3 technical replicates.
Further testing involved generating dose-response curves for the VpreB1 antibody and VpreB1-ADC with 9 different B-ALL PDX models encompassing various molecular alterations (Figure 2C-D; supplemental Table 1). Consistent with the cell line results, the VpreB1 antibody alone had minimal impact on PDX viability, although the VpreB1-ADC displayed significant toxicity across all 9 PDXs. However, the potency (50% inhibitory concentration [IC50]) and overall efficacy of the VpreB1-ADC varied substantially among the tested PDX models, with IC50 values ranging from 1.98 ng/mL (95% confidence interval, 0.96-3.01 ng/mL) for PDX B5 to 2180 ng/mL (95% confidence interval, 993-2730 ng/mL) for PDX B1. These findings suggest that the VpreB1-ADC could be an effective therapy for B-ALLs with diverse molecular alterations.
VpreB1-ADC has tolerable toxicity in vivo
To determine an optimal in vivo dose for VpreB1-ADC, we conducted a pilot study in which NSG mice engrafted with NALM-6 B-ALL cells expressing luciferase were treated with escalating doses of VpreB1-ADC (0.1-3 mg/kg every 4 days for 3 doses).37-39 Short-term disease response was monitored via BLI (supplemental Figure 5). Except for the lowest dose of VpreB1-ADC (0.1 mg/kg), all dose levels substantially reduced the leukemia burden.
As there was no significant difference in disease response between 2 and 3 mg/kg, we selected 2 mg/kg for further toxicity testing. Leukemia-free mice were treated with VpreB1-ADC at 2 mg/kg for 3 doses and monitored for weight, blood counts, and overall survival for 50 days. Furthermore, 13 of 14 mice survived for the duration of the experiment, with approximately half experiencing modest weight loss (supplemental Figure 6A-B). Although white blood cell counts decreased posttreatment, platelets and red blood cell indices (hemoglobin and hematocrit) remained stable in normal murine ranges throughout the experiment (supplemental Figure 6C-F). These results supported the continued testing of the VpreB1-ADC in vivo at a dose of 2 mg/kg.
VpreB1-ADC targets a B-ALL cell line xenograft
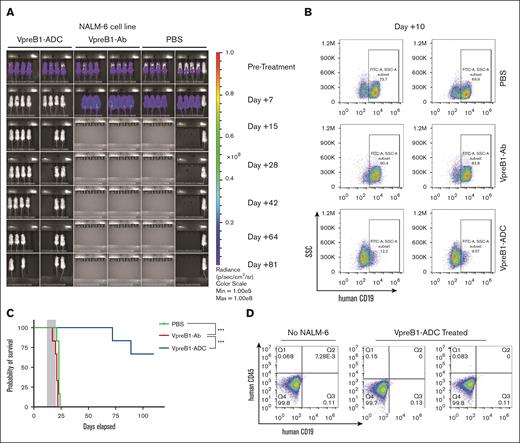
We then evaluated the VpreB1-ADC in a larger cohort of mice engrafted with NALM-6 B-ALL cells expressing luciferase. After leukemia engraftment and baseline imaging, mice were treated with VpreB1-ADC, VpreB1 antibody lacking ADC, or placebo control (PBS) for 3 doses. Posttreatment, disease burden was monitored through regular BLI, and survival was tracked. Two mice from the VpreB1-ADC cohort were euthanized after treatment to assess disease burden in the bone marrow. Both imaging and flow cytometry indicated a significant reduction in leukemia burden in mice treated with VpreB1-ADC (Figure 3A-B). Although mice treated with either VpreB1-Ab or PBS rapidly succumbed to disease, 4 of 6 of VpreB1-ADC treated mice survived for the duration of the experiment (>100 days; Figure 3C). Imaging of the VpreB1-ADC–treated mice that eventually died demonstrated no signs of leukemia recurrence before death (day +64 imaging in Figure 3B), suggesting that leukemia may not have been the cause of death. Furthermore, flow cytometry revealed no detectable leukemia in the bone marrow of 2 surviving mice at the time of euthanasia (Figure 3D). These findings demonstrate the in vivo efficacy of the VpreB1-ADC against B-ALL and supported more extensive testing with additional PDXs.
In vivo VpreB1-ADC efficacy against a B-ALL cell line xenograft model. NSG mice were transplanted through tail vein injection with 1 × 10⁶ luciferase-labeled NALM-6 cells. (A) BLI was performed pretreatment to quantify engraftment and for randomization of treatment groups. VpreB1-ADC 2 mg/kg, VpreB1 antibody 2 mg/kg, or PBS control (n = 8 mice per group) were administered intraperitoneal (IP) on days 1, 4, and 7. Mice were then followed with serial BLI. (B) On day +10 of therapy, 2 mice from each group were euthanized, bone marrow stained with a human CD19 antibody, and leukemia cells measured by flow cytometry. (C) Kaplan-Meier survival curves for mice treated with VpreB1-ADC, VpreB1 antibody, or PBS. The gray square indicates treatment duration. The log-rank (Mantel-Cox) test was used to compare the survival curves (∗∗∗P < .001). (D) On day +110 of treatment, 2 of the remaining mice from the VpreB1-ADC group were euthanized, bone marrow stained with a human CD19 antibody, and leukemia burden assessed by flow cytometry.
In vivo VpreB1-ADC efficacy against a B-ALL cell line xenograft model. NSG mice were transplanted through tail vein injection with 1 × 10⁶ luciferase-labeled NALM-6 cells. (A) BLI was performed pretreatment to quantify engraftment and for randomization of treatment groups. VpreB1-ADC 2 mg/kg, VpreB1 antibody 2 mg/kg, or PBS control (n = 8 mice per group) were administered intraperitoneal (IP) on days 1, 4, and 7. Mice were then followed with serial BLI. (B) On day +10 of therapy, 2 mice from each group were euthanized, bone marrow stained with a human CD19 antibody, and leukemia cells measured by flow cytometry. (C) Kaplan-Meier survival curves for mice treated with VpreB1-ADC, VpreB1 antibody, or PBS. The gray square indicates treatment duration. The log-rank (Mantel-Cox) test was used to compare the survival curves (∗∗∗P < .001). (D) On day +110 of treatment, 2 of the remaining mice from the VpreB1-ADC group were euthanized, bone marrow stained with a human CD19 antibody, and leukemia burden assessed by flow cytometry.
VpreB1-ADC targets multiple B-ALL PDX models
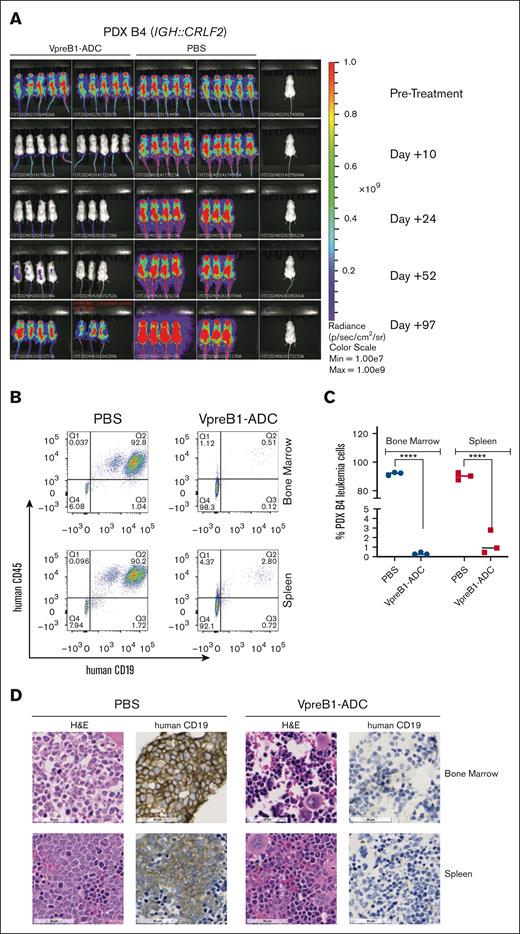
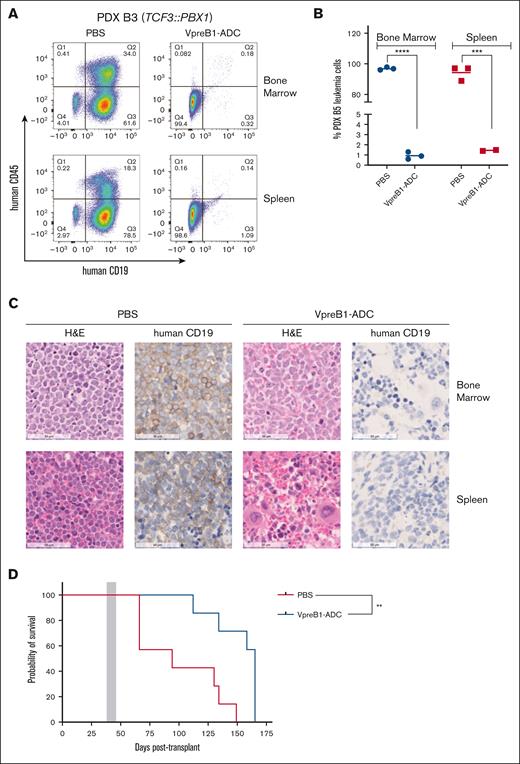
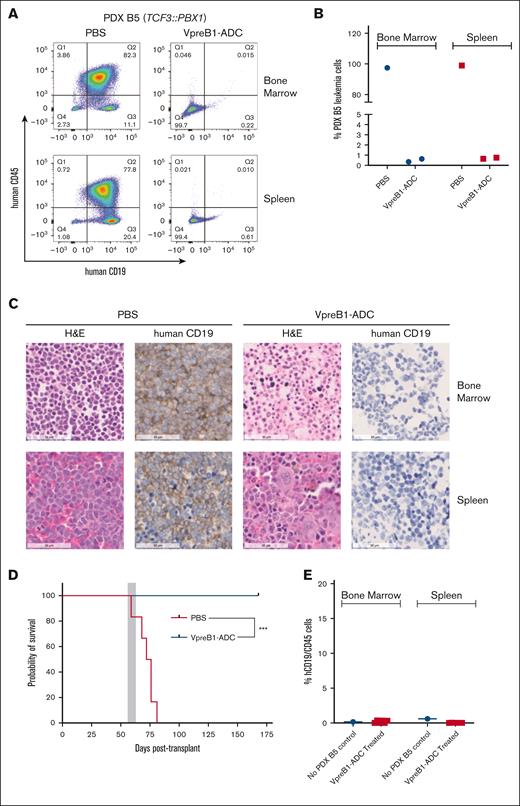
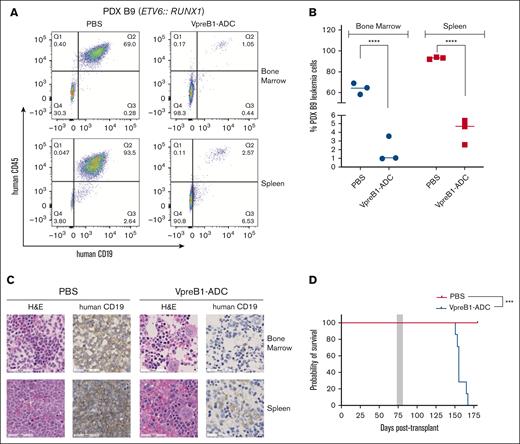
We further tested the VpreB1-ADC in 4 different B-ALL PDX models, 2 with IC50 values of <100 ng/mL (B3 and B5) and 2 with IC50 values of ∼500 ng/mL (B4 and B9) (Figures 4-7). Notably, PDX model B4 also expressed luciferase for BLI. For all PDX models, treatment with the VpreB1-ADC 2 mg/kg for 3 doses or placebo (PBS) commenced when ∼1% to 5% B-ALL cells were detected in the peripheral blood. Approximately 2 days after the final dose, 3 mice from each cohort were euthanized, and leukemia burden was assessed in the bone marrow and spleen through flow cytometry and IHC. Both methods demonstrated a dramatic reduction in leukemia burden in the spleen and bone marrow immediately after VpreB1-ADC treatment (Figures 4-7). Flow cytometry revealed that placebo-treated mice typically exhibited >90% leukemia burden in the bone marrow and spleen, whereas VpreB1-ADC–treated mice had <5%. The remaining mice were monitored for survival (Figures 5-7D) or through BLI (PDX model B4; Figure 4A). BLI corroborated the flow cytometry and IHC results, revealing a dramatic reduction in bioluminescent signal in VpreB1-ADC–treated mice compared with placebo-treated mice (Figure 4A). The bioluminescent signal in the treated mice remained low relative to the placebo-treated mice until ∼97 days posttreatment when it significantly increased, consistent with leukemia recurrence. VpreB1-ADC treatment also significantly increased survival in PDX models B3 and B5 mice compared with placebo (Figures 5-6D). Remarkably, all PDX model B5 mice treated with VpreB1-ADC survived for >150 days, and flow cytometry detected no leukemia in the bone marrow or spleen of several mice at euthanasia (Figure 6E; supplemental Figure 7). However, VpreB1-ADC–treated PDX model B9 mice had decreased overall survival relative to placebo (Figure 7D), despite demonstrating a dramatic reduction in leukemia burden at the completion of therapy (Figure 7A-C).
In vivo VpreB1-ADC efficacy against an IGH::CRLF2 B-ALL PDX model. NSG mice were transplanted through tail vein injection with 1 × 10⁶ luciferase-labeled PDX model B4 cells. (A) BLI was performed pretreatment to quantify engraftment and for randomization of treatment groups. VpreB1-ADC 2 mg/kg or PBS control (n = 8 mice per group) were administered IP on days 1, 4, and 7. Mice were then followed with serial BLI until leukemia recrudescence was observed in the VpreB1-ADC–treated mice on day +97. (B-D) After 48 hours from completing the therapy, 3 mice from each group were euthanized, femurs and spleens isolated, and leukemia burden assessed using either flow cytometry (human CD19 and CD45 antibodies) or IHC (human CD19). Representative flow cytometry plots (B) with quantification (C) and IHC (D) images are illustrated. ∗∗∗∗P < .0001. H&E, hematoxylin and eosin.
In vivo VpreB1-ADC efficacy against an IGH::CRLF2 B-ALL PDX model. NSG mice were transplanted through tail vein injection with 1 × 10⁶ luciferase-labeled PDX model B4 cells. (A) BLI was performed pretreatment to quantify engraftment and for randomization of treatment groups. VpreB1-ADC 2 mg/kg or PBS control (n = 8 mice per group) were administered IP on days 1, 4, and 7. Mice were then followed with serial BLI until leukemia recrudescence was observed in the VpreB1-ADC–treated mice on day +97. (B-D) After 48 hours from completing the therapy, 3 mice from each group were euthanized, femurs and spleens isolated, and leukemia burden assessed using either flow cytometry (human CD19 and CD45 antibodies) or IHC (human CD19). Representative flow cytometry plots (B) with quantification (C) and IHC (D) images are illustrated. ∗∗∗∗P < .0001. H&E, hematoxylin and eosin.
In vivo VpreB1-ADC efficacy against a TCF3::PBX1 B-ALL PDX model. NSG mice were transplanted through tail vein injection with 1 × 10⁶ PDX B3 model cells. When 1% to 5% leukemia cells were detectable in the peripheral blood, mice were treated with VpreB1-ADC 2 mg/kg or PBS control (n = 10 mice per group) IP on days 1, 4, and 7. (A-C) After 48 hours from the completion of the therapy, 3 mice from each group were euthanized, femurs and spleens isolated, and leukemia burden assessed using either flow cytometry (human CD19 and CD45 antibodies) or IHC (human CD19). Representative flow cytometry plots (A) with quantification (B) and IHC (C) images are illustrated. ∗∗∗P < .001; ∗∗∗∗P < .0001. (D) The remaining mice were monitored for survival and Kaplan-Meier curves generated. The gray square indicates treatment duration. The log-rank (Mantel-Cox) test was used to compare the survival curves; ∗∗P < .01. H&E, hematoxylin and eosin.
In vivo VpreB1-ADC efficacy against a TCF3::PBX1 B-ALL PDX model. NSG mice were transplanted through tail vein injection with 1 × 10⁶ PDX B3 model cells. When 1% to 5% leukemia cells were detectable in the peripheral blood, mice were treated with VpreB1-ADC 2 mg/kg or PBS control (n = 10 mice per group) IP on days 1, 4, and 7. (A-C) After 48 hours from the completion of the therapy, 3 mice from each group were euthanized, femurs and spleens isolated, and leukemia burden assessed using either flow cytometry (human CD19 and CD45 antibodies) or IHC (human CD19). Representative flow cytometry plots (A) with quantification (B) and IHC (C) images are illustrated. ∗∗∗P < .001; ∗∗∗∗P < .0001. (D) The remaining mice were monitored for survival and Kaplan-Meier curves generated. The gray square indicates treatment duration. The log-rank (Mantel-Cox) test was used to compare the survival curves; ∗∗P < .01. H&E, hematoxylin and eosin.
In vivo VpreB1-ADC efficacy against a TCF3::PBX1 B-ALL PDX model. NSG mice were transplanted through tail vein injection with 1 × 10⁶ PDX B5 model cells. When 1% to 5% leukemia cells were detectable in the peripheral blood, mice were treated with VpreB1-ADC 2 mg/kg or PBS control (n = 9 mice per group) IP on days 1, 4, and 7. (A-C) After 48 hours from completing the therapy, mice from each group were euthanized, femurs and spleens isolated, and leukemia burden assessed using either flow cytometry (human CD19 and CD45 antibodies) or IHC (human CD19). Representative flow cytometry plots (A) with quantification (B) and IHC (C) images are illustrated. Several mice died due to rapid leukemia progression before randomization and therapy initiation, and, as a result, only 1 (PBS) and 2 (VpreB1-ADC) mice were available for flow cytometry and IHC. (D) The remaining 6 mice were monitored for survival and Kaplan-Meier curves generated. The gray square indicates treatment duration. The log-rank (Mantel-Cox) test was used to compare the survival curves; ∗∗P < .01. (E) On day +168 of treatment, the 6 remaining mice from the VpreB1-ADC group were euthanized, bone marrow stained with human CD19 and CD45 antibodies, and assessed by flow cytometry (supplemental Figure 7 reveals the flow cytometry plots and gating strategy). H&E, hematoxylin and eosin.
In vivo VpreB1-ADC efficacy against a TCF3::PBX1 B-ALL PDX model. NSG mice were transplanted through tail vein injection with 1 × 10⁶ PDX B5 model cells. When 1% to 5% leukemia cells were detectable in the peripheral blood, mice were treated with VpreB1-ADC 2 mg/kg or PBS control (n = 9 mice per group) IP on days 1, 4, and 7. (A-C) After 48 hours from completing the therapy, mice from each group were euthanized, femurs and spleens isolated, and leukemia burden assessed using either flow cytometry (human CD19 and CD45 antibodies) or IHC (human CD19). Representative flow cytometry plots (A) with quantification (B) and IHC (C) images are illustrated. Several mice died due to rapid leukemia progression before randomization and therapy initiation, and, as a result, only 1 (PBS) and 2 (VpreB1-ADC) mice were available for flow cytometry and IHC. (D) The remaining 6 mice were monitored for survival and Kaplan-Meier curves generated. The gray square indicates treatment duration. The log-rank (Mantel-Cox) test was used to compare the survival curves; ∗∗P < .01. (E) On day +168 of treatment, the 6 remaining mice from the VpreB1-ADC group were euthanized, bone marrow stained with human CD19 and CD45 antibodies, and assessed by flow cytometry (supplemental Figure 7 reveals the flow cytometry plots and gating strategy). H&E, hematoxylin and eosin.
In vivo VpreB1-ADC efficacy against an ETV6::RUNX1 B-ALL PDX model. NSG mice were transplanted through tail vein injection with 1 × 10⁶ PDX B9 model cells. When 1% to 5% leukemia cells were detectable in the peripheral blood, mice were treated with VpreB1-ADC 2 mg/kg or PBS control (n = 10 mice per group) IP on days 1, 4, and 7. (A-C) After 48 hours from the completion of the therapy, 3 mice from each group were euthanized, femurs and spleens isolated, and leukemia burden assessed using either flow cytometry (human CD19 and CD45 antibodies) or IHC (human CD19). Representative flow cytometry plots (A) with quantification (B) and IHC (C) images are illustrated. ∗∗∗∗P < .0001. (D) The remaining mice were monitored for survival and Kaplan-Meier curves generated. The gray square indicates treatment duration. The log-rank (Mantel-Cox) test was used to compare the survival curves; ∗∗∗P < .001. H&E, hematoxylin and eosin.
In vivo VpreB1-ADC efficacy against an ETV6::RUNX1 B-ALL PDX model. NSG mice were transplanted through tail vein injection with 1 × 10⁶ PDX B9 model cells. When 1% to 5% leukemia cells were detectable in the peripheral blood, mice were treated with VpreB1-ADC 2 mg/kg or PBS control (n = 10 mice per group) IP on days 1, 4, and 7. (A-C) After 48 hours from the completion of the therapy, 3 mice from each group were euthanized, femurs and spleens isolated, and leukemia burden assessed using either flow cytometry (human CD19 and CD45 antibodies) or IHC (human CD19). Representative flow cytometry plots (A) with quantification (B) and IHC (C) images are illustrated. ∗∗∗∗P < .0001. (D) The remaining mice were monitored for survival and Kaplan-Meier curves generated. The gray square indicates treatment duration. The log-rank (Mantel-Cox) test was used to compare the survival curves; ∗∗∗P < .001. H&E, hematoxylin and eosin.
Discussion
To expand the scope of B-ALL therapy, we developed a novel ADC targeting the VpreB1 component of the SLC. The SLC is expressed early in B-cell development as part of the pre-BCR complex before being replaced by the kappa and lambda light chains in mature, antibody-producing B cells.20-23,40,41 VpreB1 is thus typically expressed during the specific stages of B-cell development where most B-lymphoblasts are expected to arrest during leukemogenesis.24,42 Consistent with this ontogeny, we observed broad VPREB1 expression across >3000 primary pediatric B-ALL samples with diverse genetic abnormalities (Figure 1C), corroborating our previous work using flow cytometry on a smaller set of diagnostic and remission samples.25 It is important to note that “pre-BCR” ALL has previously been reported in only ∼15% cases of B-ALL.33,43-48 This subset was classified based on evidence of strong activation of downstream pre-BCR signaling pathways,46 suggesting that therapies targeting pre-BCR–dependent signaling pathways, such as B-cell lymphoma 6 (BCL6), Spleen tyrosine kinase (SYK), or Bruton's tyrosine kinase (BTK), may be particularly suitable for this defined group of “pre-BCR” B-ALL cases.33,45,47,49 In contrast, the VpreB1-ADC has the potential to benefit a much broader range of patients with B-ALL, including those expressing only low levels of VpreB1 on the cell surface that may not generate targetable pre-BCR signaling.50-53 Importantly, VpreB1 cell surface expression was detected in all cases of B-ALL cell lines and PDXs that we studied, which span the pro-B, pre-B1, and pre-B transitional stages of development and comprise >99% of B-ALL cases.24 However, the percentage of leukemia cells expressing VpreB1 in each leukemia sample varied (supplemental Table 1) and VpreB1-negative clones provide a likely mechanism of therapy resistance. Accordingly, we envision that the eventual clinical use of the VpreB1-ADC would be as part of a current multiagent treatment regimen that does not require that a single agent can eradicate all leukemia clones. Finally, B-ALL cases with rare homozygous genomic deletions of VpreB154,55 would not be suitable targets for VpreB1-ADC, highlighting the importance of screening for surface VpreB1 expression as part of in-human inclusion criteria.
The VpreB1 antibody chosen as the targeting vehicle has been extensively evaluated for both its high affinity, high specificity, and ability to undergo rapid internalization on VpreB1 binding, which is a critical factor for payload delivery.29 We selected calicheamicin for antibody conjugation as calicheamicin-based ADCs in active clinical use, such as inotuzumab and gemtuzumab, have undergone extensive testing in both murine models and humans, demonstrating high toxicity against the targeted cancer cells and manageable toxicities.17,34-36,56 The VpreB1-ADC demonstrated acceptable toxicity and potent, dose-dependent cytotoxicity against multiple B-ALL cell lines and PDXs in vitro. Interestingly, 2 of the B-ALLs (cell line HAL01 and PDX ALL1807) that were least sensitive to the VpreB1-ADC both contain a TCF3::HLF translocation, a very rare subtype of B-ALL that is highly chemotherapy resistant.55 Conflicting data exist regarding VpreB1 expression in TCF3::HLF B-ALL. Although hemizygous and homozygous VpreB1 genomic deletions were frequently identified in a small cohort of TCF3::HLF samples,55 VpreB1 was detectable by flow cytometry for both HAL01 and ALL1807 cell lines. It will be informative in future studies to test the VpreB1-ADC with additional TCF3::HLF samples and to use these cell lines for defining mechanisms of ADC resistance.
The 2 cell lines from mature B-cell neoplasms (Raji, Burkitt lymphoma; U266B1, multiple myeloma) were resistant to the VpreB1-ADC. Similarly, a limited number of AML cell lines were insensitive to the VpreB1-ADC. However, low levels of VPREB1 mRNA expression occurred in some primary AML and T-ALL samples (supplemental Figure 2A), suggesting that lineage-aberrant expression of VPREB1 may occur, as can be found for other leukemia antigens. This raises the possibility that the VpreB1-ADC could have efficacy against other hematologic malignancies. Although, it remains to be determined whether VPREB1 mRNA in these T-ALL and AML samples is translated and whether VpreB1 protein traffics to the cell surface.
Supporting our in vitro data, the VpreB1-ADC also demonstrated significant in vivo efficacy against NALM-6 cells and 4 different B-ALL PDX models with various molecular aberrations. For all PDX models, IHC and flow cytometry assessments of bone marrow and spleen ∼48 hours after the last dose of ADC demonstrated a significant reduction in leukemia burden, which generally led to prolonged survival of the mice treated with VpreB1-ADC compared with placebo. Notably, NALM-6 and PDX model B5 mice treated with the VpreB1-ADC demonstrated extended survival, with some mice eventually being electively euthanized. Bone marrow analysis in several of these mice revealed no convincing evidence of leukemia by flow cytometry, suggesting potential cures with VpreB1-ADC monotherapy. Consistently, PDX model B5 and NALM-6 demonstrated the greatest in vitro sensitivity to VpreB1-ADC. However, further testing of the VpreB1-ADC with additional leukemia samples is essential to rigorously determine whether leukemia cell characteristics, such as in vitro sensitivity, VpreB1 surface expression levels, B-cell maturation stage, or genomic alterations, can predict in vivo response to the VpreB1-ADC.
Unexpectedly, PDX model B9 mice treated with VpreB1-ADC had shorter survival than those treated with placebo, despite a significant reduction in leukemia burden immediately after completing therapy. Although the mechanism underlying this result is unknown, it is possible that the VpreB1-ADC selected for a more aggressive leukemia clone that rapidly expanded. Future studies with PDX model B9 may help identify and define mechanisms of therapy relapse.
In conclusion, a VpreB1-ADC exhibits significant toxicity against B-ALL cells both in vitro and in vivo. These findings further support investigating the pre-BCR as a therapeutic target, consistent with recent studies that tested an ADC targeting CD79b, present in both the pre-BCR and mature BCR complexes, in the treatment of diffuse large B-cell lymphoma and B-ALL.57,58 Further preclinical testing will include assessing the efficacy of the VpreB1-ADC with additional PDX models to better capture the genetic diversity of B-ALL and investigating mechanisms of resistance. The TCF3::HLF cell lines and PDX model B9 may be particularly useful for these resistance studies. We will also explore the use of the VpreB1-ADC in combination with or after cytotoxic chemotherapy to better replicate current clinical ADC use. Importantly, we previously revealed that VpreB1 expression persists on the rare minimal residual disease leukemia cells remaining after induction chemotherapy.25 Finally, we will test whether sparing mature B cells that lack VpreB1 could reduce B-cell aplasia, hypogammaglobulinemia, and the impact on humoral immunity compared with other current B-ALL immunotherapies.
Acknowledgments
The authors thank Matthew C. Winter for his assistance in the analysis of VpreB1 antibody binding capacity expression and the members of the Children’s Minnesota Clinical Laboratory Improvement Amendments/College of American Pathologists (CLIA/CAP)–approved flow cytometry facility for their support. The authors gratefully acknowledge philanthropic support of TCF3::HLF acute lymphoblastic leukemia research at the Children’s Hospital of Philadelphia from the Simutis family in memory of Andrew David Simutis. S.K.T. is a Scholar of the Leukemia & Lymphoma Society and holds the Joshua Kahan Endowed Chair in Pediatric Leukemia Research at the Children’s Hospital of Philadelphia.
This work was supported by R21CA280433 (P.M.G. and S.S.W.) and a Hyundai Hope on Wheels Scholar Grant (P.M.G. and S.S.W.). This work used the University of Minnesota Masonic Cancer Center shared flow cytometry core facility, which is supported in part by National Institutes of Health (NIH) P30 CA77598: National Cancer Institute (NCI) UM1TR004405: National Center for Advancing Translational Sciences (NCATS).
Authorship
Contribution: P.M.G. and S.S.W. designed the study, oversaw the laboratory investigations, prepared the figures, and wrote the manuscript; J.O., K.C.L., H.N.B., and L.L. designed and performed the experiments, analyzed the data, and prepared the figures; J.M.M. designed and performed the experiments, analyzed the data, prepared the figures, and oversaw laboratory investigations; T.S. designed the experiments, oversaw laboratory investigations, and analyzed the data; T.B. and C.D.B. analyzed RNA sequencing data and prepared a figure; R.L.W. analyzed the data; B.E.D. analyzed the data and prepared the figures. S.K.T. provided critical experimental reagents; and all authors reviewed, edited, and approved the final version of the manuscript.
Conflict-of-interest disclosure: S.S.W. and B.S.W. have a patent pending for the VpreB1-ADC (USPTO 17/672573 and US20220265846A1). S.K.T. receives research funding from Incyte Corporation and Kura Oncology; serves/d on scientific advisory boards for Aleta Biotherapeutics, AstraZeneca, Jazz Pharmaceuticals, Kestrel Therapeutics, Kura Oncology, Syndax Pharmaceuticals, and Wugen, Inc; and has received travel support from Amgen and Jazz Pharmaceuticals. S.S.W. has received travel support and honoraria from Amgen; and serves on the board of directors for Cytotheryx, Inc. The remaining authors declare no competing financial interests.
Correspondence: Stuart S. Winter, Children’s Minnesota, Research Institute, 2525 Chicago Ave South, Minneapolis, MN 55404; email: stuart.winter@childrensmn.org.
References
Author notes
The data sets generated and analyzed in this study are available on reasonable request from the corresponding author, Stuart S. Winter (stuart.winter@childrensmn.org). The messenger RNA expression data were obtained from St. Jude Cloud, which can be accessed at https://pecan.stjude.cloud/. For additional questions about data access, please contact the corresponding author.
The full-text version of this article contains a data supplement.

