Traditionally, remission status has been determined by bone marrow morphology at the end of the induction phase of treatment in acute lymphoblastic leukemia (ALL). Minimal residual disease (MRD) testing is now routinely performed in conjunction with morphologic assessment to determine the depth of remission, and MRD response is the most powerful prognostic determinant. Although the vast majority of children achieve a remission (<5% blasts by morphology) with frontline induction therapy, a small percentage fail induction. While in the majority of cases MRD assessments are concordant with morphology, discordance can be observed. This raises the question of how to determine induction response most reliably, as patients with persistence of a high tumor burden at the end induction fare poorly with conventional treatment and may be candidates for alternative therapies.
To address the question of the role and accuracy of conventional morphology and MRD in defining induction failure, Dr. David O’Connor and colleagues analyzed 3,113 pediatric patients with newly diagnosed ALL who were treated on the Medical Research Council UKALL 2003 trial. All patients underwent routine morphologic assessment of marrow response at individual treating centers at the end of induction (EOI), and response was categorized as M1 (<5% blasts), M2 (5-25% blasts), or M3 (>25% blasts). Induction failure was defined as failure to achieve morphologic complete remission (<5% bone marrow blasts). In parallel, bone marrow MRD was measured at one of five laboratories in the United Kingdom using standardized real-time quantitative polymerase chain reaction for immunoglobulin and T-cell receptor gene rearrangements, with a cutoff of 0.01 percent used to define MRD positivity. All patients underwent routine cytogenetic testing for chromosomal abnormalities of known prognostic significance. Patients lacking established cytogenetic alternations were designated “B-other,” and a representative cohort of these patients underwent additional testing for ABL1, ABL2, PDGFRB, CSF1R, CRLF2, and JAK2 rearrangements.
Fifty-nine patients (1.9%) had morphologic induction failure at the EOI, with 44 M2 and 15 M3 marrow responses. Patients with M2 marrow responses received intensified chemotherapy on protocol, whereas those with M3 marrow responses were taken off protocol to receive salvage therapy. Patients with morphologic induction failure had poor outcomes, with a -year event-free survival (EFS) of 50.7 percent and a five-year overall survival (OS) of 57.7 percent, and outcomes did not differ significantly among those who underwent hematopoietic stem cell transplantation. Not unexpectedly, induction failure was associated with high-risk clinical and cytogenetic features.
The authors analyzed the relationship between morphologic response and molecular MRD at the EOI. While there was concordance between MRD and morphologic responses in the vast majority of cases, 61 patients (2.3%) were identified with M1 marrow morphologic responses but with discordantly high MRD levels of at least 5 percent. These patients had a -year EFS of 47 percent that was comparable to morphologic induction failure (5-year EFS, 50.7%). Discordantly high MRD in patients in morphologic remission was more common in children with T-cell ALL (8%) than B-lineage ALL (1.5%), p<0.001. Conversely, another very small group of six discordantly low MRD patients was identified with morphologic induction failures (M2) but with MRD less than 0.01 percent and this group had a -year EFS of 100 percent.
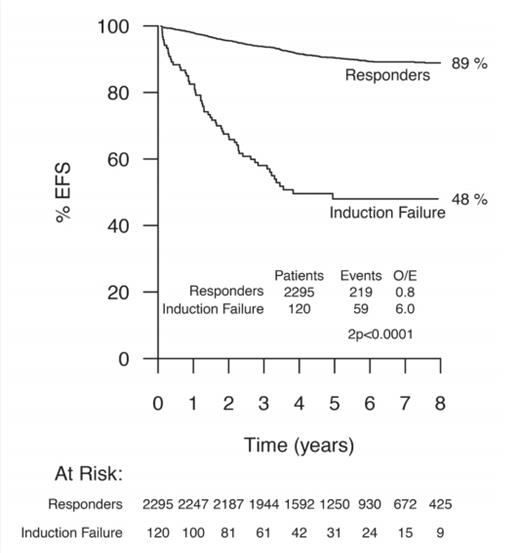
Event-free Survival in Patients With Induction Failure Versus Patients Who Achieved Complete Remission. Event-free survival (EFS) in 120 patients with induction failure on the basis of new criteria (M2 and M3 marrow and/or end of induction minimal residual disease ? 5%) compared with those patients who achieved complete remission at the end of induction. Data indicate eight-year EFS estimates. Numbers within each group are indicated in the at-risk table beneath the graph. O/E, observed/expected. Reprinted with permission. © 2017 American Society of Clinical Oncology. All rights reserved.
Event-free Survival in Patients With Induction Failure Versus Patients Who Achieved Complete Remission. Event-free survival (EFS) in 120 patients with induction failure on the basis of new criteria (M2 and M3 marrow and/or end of induction minimal residual disease ? 5%) compared with those patients who achieved complete remission at the end of induction. Data indicate eight-year EFS estimates. Numbers within each group are indicated in the at-risk table beneath the graph. O/E, observed/expected. Reprinted with permission. © 2017 American Society of Clinical Oncology. All rights reserved.
Approximately one third of the induction failure patients defined by both morphology and MRD levels of 5 percent or greater fell into the “B-other” cytogenetic group, where expanded testing for genetic fusions was performed. Notably, EBF1-PDGFRB fusions, which have been successfully targeted with imatinib, were detected in approximately 10 percent of induction failure patients overall. Based on the findings in this report, the UK group has revised their definition of induction failure to include at least 5 percent residual disease by either MRD or morphology. Thus the new definition doubles the number of induction failures (Figure). Given the high proportion of adverse cytogenetic alterations in this group, patients with induction failure now also undergo expanded cytogenetic testing for targetable fusions.
In Brief
This report provides important new insight into improving the accuracy of induction response assessment by incorporating MRD. While this report suggests that treatment response may be more accurately determined by MRD alone, given the relatively small number of discordant cases, confirmatory studies using different MRD methodologies and therapeutic backbones are presently underway. Additionally, the MRD threshold that optimally defines a poor risk group remains to be defined. This work is anticipated to lead to a revised universal definition of induction failure in the future, identifying an expanded group of patients with poor outcomes, who may benefit from alternative treatment approaches.
Competing Interests
Dr. Raetz indicated no relevant conflicts of interest.

