The classical BCR:: ABL1-negative myeloproliferative neoplasms (Ph- MPNs) polycythemia vera (PV), essential thrombocythemia (ET), and primary myelofibrosis (PMF) are typically diseases of older adults, with a median age at diagnosis within the sixth decade of life. In two large case series from cancer centers in the United States, adolescent and young adult (AYA) patients were reported to account for 11 to 12% of the Ph- MPNs evaluated.1,2 The data on AYA patients with Ph- MPNs is less robust than that available for their older counterparts, and this patient population may not be represented in cohorts used to develop prognostic scoring systems.
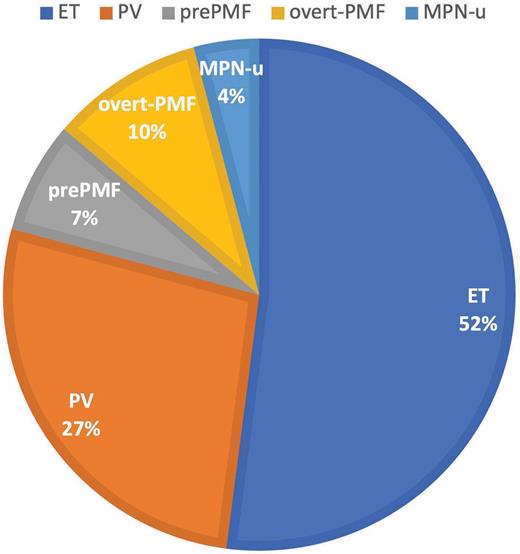
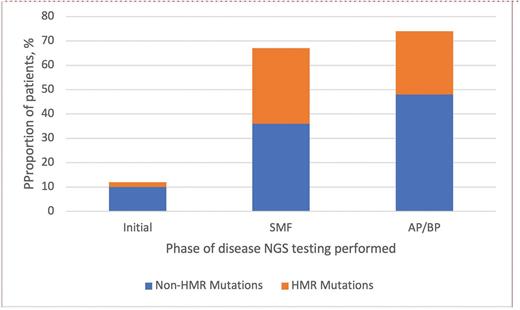
Recently, James T. England, MD, MSc, and colleagues investigated the clinical features and long-term outcomes of a cohort of 609 patients (17 pediatric patients aged <18 years and 592 patients aged 18-45 years) with Ph- MPNs from across eight participating centers in Canada. Initial diagnoses are shown in Figure 1. Clinical features from the current study cohort are compared with those of a 2018 Mayo Clinic AYA cohort1 (Table). The patients were diagnosed between 2000 and 2022, with MPN driver mutation analysis performed in 89% and next-generation sequencing (NGS) of clinically relevant myeloid genes performed in 48%. More than one-third of patients (211) had NGS testing first performed during initial disease phase, with a median time from diagnosis of 3.9 years (range, 0-29 years). Sixty-four patients had NGS first performed during the post-ET/post-PV secondary myelofibrosis (SMF) phase, while 19 had NGS first performed during the accelerated phase (AP)/blast phase (BP) of disease. Non-MPN driver mutations were detected in a higher proportion of patients evaluated during disease progression (secondary myelofibrosis or elevated blasts) than during initial disease phase, including more frequent high molecular risk (HMR) mutations (Figure 2). Mutations defined as HMR included pathogenic and likely pathogenic variants in ASXL1, EZH2, IDH1/2, SRSF2, TP53, and U2AF1Q157. Among those patients with NGS testing performed during the initial disease phase, additional mutations were most frequently detected in those with overt PMF (26%).
Distribution of diagnoses in AYA cohort
Abbreviations: AYA, adolescent and young adult; ET, essential thrombocythemia; MPN-u, myeloproliferative neoplasm, unclassifiable; PMF, primary myelofibrosis; PV, polycythemia vera.
Abbreviations: AYA, adolescent and young adult; ET, essential thrombocythemia; MPN-u, myeloproliferative neoplasm, unclassifiable; PMF, primary myelofibrosis; PV, polycythemia vera.
Comparison of features of Mayo Clinic cohort and Canadian MPN cohort
| Features . | 2018 Mayo Clinic cohort . | 2024 Canadian MPN cohort . |
|---|---|---|
| Study years | 1967-2017 | 2000-2022 |
| Total number of patients in AYA cohort | 361 | 609 |
| AYA cohort age range | 18-40 | <18 (n=17); 18-45 (n=592) |
| ET diagnosis, number of patients | 219 | 317 |
| Fibrotic transformation/blast progression | 16%/2% | 22%/4% |
| Thrombosis history at diagnosis/thrombosis after diagnosis | 13%/16% | 12%/10% |
| PV diagnosis, number of patients | 79 | 165 |
| Fibrotic transformation/blast progression | 22%/4% | 28%/7% |
| Thrombosis history at diagnosis/thrombosis after diagnosis | 27%/27% | 17%/16% |
| pre-PMF diagnosis, number of patients | n/a | 43 |
| Blast progression | n/a | 8% |
| Thrombosis history at diagnosis/thrombosis after diagnosis | n/a | 19%/9% |
| PMF diagnosis, number of patients | 63 | 59 |
| Blast progression | 10% | 15% |
| Thrombosis history at diagnosis/thrombosis after diagnosis | 16%/5% | 7%/7% |
| MPN-u diagnosis, number of patients | n/a | 25 |
| Fibrotic transformation/blast progression | n/a | 13%/0% |
| Thrombosis history at diagnosis/thrombosis after diagnosis | n/a | 36%/20% |
| NGS testing, number of patients | 27-37 (number depends on gene, all with PMF diagnosis) | 294 (211 from initial disease phase) |
Abbreviations: AYA, adolescent and young adult; ET, essential thrombocythemia; MPN, myeloproliferative neoplasm; MPN-u, myeloproliferative neoplasm, unclassifiable; NGS, next-generation sequencing; PMF, primary myelofibrosis; PV, polycythemia vera.
Proportion of patients with additional non-MPN driver mutations
HMR mutations included pathogenic and likely pathogenic variants in ASXL1, EZH2, IDH1/2, SRSF2, TP53, and U2AF1Q157. Abbreviations: AP, accelerated phase; BP, blast phase; HMR, high molecular risk; MPN, myeloproliferative neoplasm; NGS, next-generation sequencing; SMF, secondary myelofibrosis.
HMR mutations included pathogenic and likely pathogenic variants in ASXL1, EZH2, IDH1/2, SRSF2, TP53, and U2AF1Q157. Abbreviations: AP, accelerated phase; BP, blast phase; HMR, high molecular risk; MPN, myeloproliferative neoplasm; NGS, next-generation sequencing; SMF, secondary myelofibrosis.
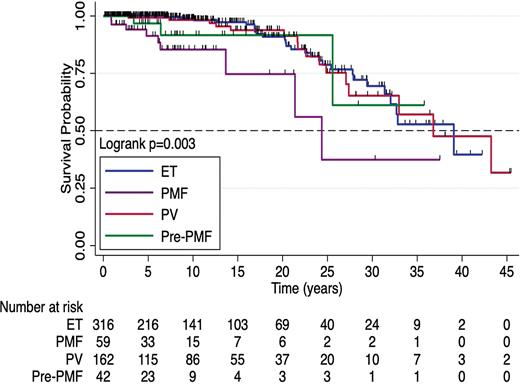
Nearly one-quarter (24%) of the patients in the study cohort had a thrombotic complication, with JAK2 driver mutation, portal hypertension, and dyslipidemia associated with shorter thrombosis-free survival on multivariable analysis. Overall survival (OS) by diagnosis is shown in Figure 3; patients with overt PMF had a significantly shorter OS (24.4 years vs. 39.1 for ET and 36.8 for PV). In multivariable survival analysis, diagnosis of overt- or pre-PMF; higher peripheral blast percentage; and Eastern Cooperative Oncology Group (ECOG) performance status ≥1 were predictive of shorter OS, while a higher risk of AP/BP progression was predicted by pre- or overt-PMF and higher white blood cell count.
Overall Survival by Diagnosis
Abbreviations: ET, essential thrombocythemia; PMF, primary myelofibrosis; PV, polycythemia vera.
Abbreviations: ET, essential thrombocythemia; PMF, primary myelofibrosis; PV, polycythemia vera.
The authors evaluated the performance of several established prognostic risk scores for predicting thrombotic risk and OS, including European LeukemiaNet’s PV risk category (using only thrombosis history since age <60 years); the International Prognostic Score for Thrombosis in Essential Thrombocythemia (IPSET); the revised-IPSET thrombosis score; the Dynamic International Prognostic Scoring System (DIPSS) for PMF; age-adjusted DIPSS; and the mutation-enhanced international prognostic scoring systems for PV (MIPSS-PV), ET (MIPSS-ET), and transplantation-age patients with PMF (MIPSS70).. The patient cohort consisted of predominantly low-risk patients by all evaluated scoring systems. The authors compared the scoring systems using Harrell’s concordance (C) statistic for OS, AP/BP-free survival, or thrombosis-free survival, with C-statistics ranging from 0.543 to 0.728. While illustrative, the generalizability of this prognostic scoring comparison is limited.3
Limitations of this study include a lack of germline testing for hereditary MPN — although the authors report that a minority of patients (5%) had a family history of hematological malignancy — and a lack of complete cytogenetic analysis in nearly half the patients. Diagnostic categorization according to WHO 2016 guidelines4 was via retrospective review of reported data, not retrospective slide review, and not all patients had a bone marrow biopsy at time of initial diagnosis.
In Brief
This study provides clinical features and long-term outcomes for an impressively large cohort of AYA patients with Ph- MPNs treated during a relatively contemporary period. In the current study, the median OS was 36.8 years, with a shorter OS for patients with overt PMF. Thrombotic complications were seen in nearly one-quarter of the cohort. A strength of this study is the large proportion of molecularly annotated patients, with NGS mutation testing performed in one-third of patients during their initial disease phase. The authors found an overall low prevalence of additional non-MPN driver mutations at initial diagnosis, with the highest frequency of additional mutations occurring in patients with overt PMF. In patients with PV and ET, the presence of additional non-MPN driver mutations at initial diagnosis was predictive of shorter secondary myelofibrosis-free survival.
Competing Interests
Dr. Courville indicated no relevant conflicts of interest.


