The phenotype induced by the GATA-1low (neoδHS) mutation is here further characterized by analyzing the hemopoietic system during the aging (up to 20 months) of a GATA-1lowcolony (135 mutants and 40 normal littermates). Mutants expressed normal hematocrit values (Hct = 45.9 ± 4.0) until 12 months but became anemic from 15 months on (Hct = 30.9 ± 3.9;P < .05). Anemia was associated with several markers of myelofibrosis such as the presence of tear-drop poikilocytes and progenitor cells in the blood, collagen fibers in the marrow and in the spleen, and hemopoietic foci in the liver. Semiquantitative reverse transcription–polymerase chain reaction showed that growth factor genes implicated in the development of myelofibrosis (such as osteocalcin, transforming growth factor-β1, platelet-derived growth factor, and vascular endothelial growth factor) were all expressed in the marrow from the mutants at higher levels than in corresponding normal tissues. The GATA-1low mutants experienced a slow progression of the disease because the final exitus was not observed until at least 15 months with a probability of survival more favorable than that of W/Wv mice concurrently kept in the animal facility (P < .001, by Kaplan-Meier analysis). In conclusion, impaired GATA-1 expression may contribute to the development of myelofibrosis, and the GATA-1low mutants may represent a suitable animal model for the human disease that may shed light on its pathogenesis.
Introduction
Idiopathic myelofibrosis (IM), also known as agnogenic myeloid metaplasia, is a myeloproliferative disorder of clonal origin of unknown etiopathology characterized by fibrotic degeneration of the marrow and extensive extramedullary hemopoiesis in the spleen and liver.1-3 The fact that human IM is often associated with alterations of megakaryocytopoiesis, such as thrombocytopenia and accumulation of megakaryocytes (Mk) in the tissues,1-3 has prompted the hypothesis that the disease may be the consequence of chronic activation of bone marrow stromal cells by growth factors, such as transforming growth factor-β1 (TGF-β1), platelet-derived growth factor (PDGF), vascular endothelial growth factor (VEGF), and fibroblast growth factor-A (FGF-A), released by Mk in the microenvironment.4,5 In mice, the number of Mk in the marrow can be altered by manipulating the in vivo levels of thrombopoietin (TPO), the growth factor that specifically regulates megakaryocytopoiesis.6 Mice expressing high levels of human TPO, either because they are transgenic for the human gene7 or because they receive transplants of bone marrow cells infected with a retrovirus containing human TPO,8 express high levels of marrow Mk and blood platelet counts. Both animal models rapidly develop IM (within 2-3 months),9-11 further supporting the hypothesis for the involvement of Mk in the etiopathology of the human disease. However, in the 14 cases of human IM analyzed so far, the high number of Mk in the marrow was not associated with autocrine TPO production or with mutations in the gene for the TPO receptor (Mpl).12 This observation indicates that, unlike the experimentally induced murine disease, human IM might not be the consequence of alterations in the TPO/Mpl pathway, leaving the cause for the increased numbers of Mk observed in these patients still to be ascertained.
GATA-1 is a transcription factor that exerts a well-established role in erythroid and megakaryocytic cell differentiation.13Definitive proof for its importance in hemopoiesis came from genetic manipulation of the expression of GATA-1 in mice. In fact, mice expressing ectopic levels of the gene show an increased rate of erythroid differentiation,14 whereas those lacking the gene by targeted mutation die in utero as the consequence of severe anemia.15,16 Instrumental to determining the role of GATA-1 in megakaryocytopoiesis has been the generation of mutant mice with reduced GATA-1 expression.17,18 These mice are anemic but, unlike the deletion mutants, survive for longer periods during gestation, up to the stage when alterations in megakaryocytopoiesis are detectable. One of these mutants, the mutant in which the first enhancer (DNA hypersensitive site 1) has been replaced with a neo-cassette and which lacks the distal GATA-1 promoter (neoδHS mouse or GATA-1low mutant), is born thrombocytopenic18,19 and anemic.20 The few animals that survive adulthood recover from their anemia at 3 to 4 weeks of age but remain thrombocytopenic all their lives (Vannucchi et al21 and this paper) because of a block in the maturation of Mk into proplatelets that results in the accumulation of Mk in the marrow and spleen.18 21 GATA-1low adult mice can be, therefore, considered a model to study the effects of chronic increases in the Mk population within tissues in the absence of alterations in the TPO/Mpl signaling pathways.
To further confirm the hypothesis that the development of IM may result from an accumulation of Mk in the hemopoietic tissues, it was investigated whether the GATA-1low mice would develop the disease with age. Indeed, early IM traits (presence of reticulotic fibers in the marrow and spleen) could be detected since 10 months of age. However, a frank IM picture (anemia, occurrence of tear-drop poikilocytes and progenitor cells in the blood, fibrotic degeneration of the marrow and spleen, and active hemopoiesis in the liver) developed only after 15 months. These results indicate that Mk accumulation in the marrow, as a consequence of impaired GATA-1 expression, may contribute to the pathogenesis of IM.
Materials and methods
Mice
The GATA-1low colony21 was bred according to standard genetic protocols at the animal facilities of the Istituto Superiore di Sanità (Rome, Italy) starting from 2 genetically modified animals17 (one female and one male) kindly provided for this study by Dr S. Orkin (Harvard Medical School, Boston, MA). The original neoδHS couple (of mixed C57BL/6-SV 129 background) generated a single male offspring that was crossed with a CD1 female (Charles River, Calco, Italy). Their female offspring was back-crossed with the father until a line of homozygous mutant mice (of mixed C57BL/6-SV 129/CD1 background) was obtained. All the littermates were genotyped by polymerase chain reaction (PCR) at birth for the absence of the deleted GATA-1 sequence. Littermates whose genotype contained the GATA-1 region were considered wild type and were used as negative controls. Other mice used in this study were represented by WBB6F1-W/Wv (W/Wv) female mice, purchased at 6 weeks of age from Jackson Laboratory (Bar Harbor, ME). All the animals were housed for up to 2 years in the animal facilities of the Istituto Superiore di Sanità under humane conditions. All the experiments were performed with sex- and age-matched mice under protocols approved by the institutional animal care committee.
Hematologic blood parameters
Blood was collected from the retro-orbital plexus into ethylenediaminetetraacetic acid (EDTA)–coated microcapillary tubes (20-40 μL/sampling). Hematocrit (Hct), white cell counts, and platelet counts were determined manually. Differential counts of white blood cells were performed on May-Grünwald-Giemsa–stained slides, counting at least 100 cells.
Immunohistochemical analysis
Samples of liver, spleen, and bone marrow were routinely fixed in 10% (vol/vol) phosphate-buffered formalin; bones were decalcified using standard techniques with acidified EDTA. Fixed tissues were paraffin embedded, and 2.5- to 3-μM sections were prepared for hematoxylin-eosin staining or Gomori reticulum staining.22For the search of extramedullary foci of hematopoiesis, liver, lung, and kidney samples were serially cut at 100-μM intervals, and at least 25 sections per organ per mouse were examined and their sequences numbered. Immunohistochemical staining with a rat monoclonal antibody directed against murine CD45 (Ly-5; PharMingen, San Diego, CA) was performed on numbered liver sections immediately preceding or following those stained with hematoxylin-eosin in which foci of extramedullary hematopoiesis had been discovered. CD45+ cells were identified with the avidin-biotinylated horseradish peroxidase system (ABC Staining system; Santa Cruz Biotechnology, Santa Cruz, CA) using diaminobenzidine as a substrate.
Progenitor cell counts
The frequency of progenitor cells (erythroid colony-forming unit [CFU-E]; erythroid burst-forming unit [BFU-E]; granulocyte macrophage–colony-forming unit [CFU-GM]; megakaryocytic pure (p) or mixed (m) colony-forming unit [CFU-Mkp, CFU-Mkm]) was analyzed by culturing low-density mononuclear cells (0.25-1.0 × 10⁵cells/plate) of selected organs (marrow, spleen, liver) from wild-type and mutant littermates under specific culture conditions. In the case of peripheral blood, 10 μL whole blood was directly plated per milliliter culture, as described.23 Briefly, cultures were established in standard methylcellulose culture (0.9% wt/vol) in the presence of fetal bovine serum (FBS, 30% vol/vol; Hyclone, Logan, UT) and of a combination of recombinant growth factors including rat stem cell factor (SCF, 100 ng/mL; Amgen, Thousand Oaks, CA), mouse interleukin 3 (IL-3, 10 ng/mL; Genetic Institute, Cambridge, MA), and human erythropoietin (EPO, 2 U/mL; Boehringer Mannheim, Mannheim, Germany) for BFU-E growth or human granulocyte-colony stimulating factor (G-CSF, 50 ng/mL; Neupogen; Dompè Biotech, Milan, Italy) and murine granulocyte-macrophage colony stimulating factor (GM-CSF, 50 ng/mL; a gift from Dr K. Kaushansky, University of Washington, Seattle) for CFU-GM growth.24 The growth of CFU-E–derived colonies was stimulated with EPO alone (2 U/mL).25 The growth of CFU-Mk–derived colonies was obtained in collagen-supplemented cultures (MegaCult; Stem Cell Technologies, Vancouver, British Columbia, Canada) stimulated with the combination of recombinant cytokines including murine IL-3 (25 ng/mL), IL-6 (100 ng/mL; Sigma), IL-11 (50 ng/mL; Sigma), and human TPO (50 ng/mL; Amgen). Cultures were incubated at 37°C in a humidified incubator containing 5% CO2 in air and scored after 3 days (for CFU-E–derived colonies) or 7 days (for CFU-GM–, and BFU-E–derived colonies) of culture under an inverted microscope according to standard morphologic criteria. Megakaryocytic colonies and isolated megakaryocytes were counted at day 7 on dehydrated and acetone-fixed collagen cultures stained for acetylcholinesterase (AChE) for 6 hours, followed by methyl-green nuclear counter-staining, as described.26 Megakaryocytic colonies (5 or more cells) were considered pure or mixed when containing only AChE+ cells or both AChE+ and AChEneg cells, respectively.
Flow cytometry analysis and megakaryocyte purification
Bone marrow cells were flushed from femurs in Ca++- and Mg++-free phosphate-buffered saline (PBS) supplemented with 1% (vol/vol) bovine serum albumin, 2 mM EDTA, and 0.01% NaN3 and were labeled on ice with the erythroid-specific phycoerythrin (PE)-conjugated Ter-119 (Ly-76) (PharMingen) monoclonal antibody and the megakaryocyte-specific fluorescein isothiocyanate (FITC)–conjugated 4A5 antibody as described.27 Cells incubated with the corresponding irrelevant isotype-matched antibodies were used for gating nonspecific fluorescence, and dead cells were excluded by propidium iodide staining (5 μg/mL; Sigma, St Louis, MO). Megakaryocytes were purified from the spleen as described.27 Briefly, monocellular spleen suspensions were prepared by cutting the spleens into small fragments in 5 mL Ca++- and Mg++-free PBS containing 10% (vol/vol) FBS, 5 mM EDTA, and 2 mM theophylline and by passing the fragments through progressively smaller needles. Spleen light-density mononuclear cells were isolated by centrifugation over Lympholyte-M (ρ = 1.0875 g/mL; Cedarlane Lab, Hornby, British Columbia, Canada) at 800g for 20 minutes at room temperature and washed twice in Ca++- and Mg++-free PBS, and adherent cells were first removed by 2 cycles of adherence to plastic at 37°C for 1 hour. The nonadherent fraction was then enriched for megakaryocytic cells by immunomagnetic selection: briefly, cells were incubated with FITC-conjugated 4A5 rat monoclonal antibody (approximately equal to 1 μg/106 cells) for 30 minutes on ice, washed twice with PBS containing 0.5% (wt/vol) bovine serum albumin and 2 mM EDTA, and suspended in 80 μL buffer and 20 μL MACS microbeads conjugated with a monoclonal mouse antifluorescein antibody (Miltenyi Biotech GmbH, Bergisch Gladbach, Germany). The cell suspension was washed twice with labeling medium and loaded on a MS+/RS+MiniMacs column placed in a MACS separator; 4A5-negative cells were recovered in the effluent fraction, whereas 4A5-positive cells were flushed out of the column. The purity of the sorted fractions was evaluated by reanalysis of the fluorescent cells with the cytometer. Cell aliquots concurrently incubated with irrelevant isotype-matched antibodies were included in each analysis as a negative control.
RNA isolation and semiquantitative RT-PCR analysis
Total RNA from femurs was prepared by freezing the bones, carefully cleaned from the soft tissues, in liquid nitrogen and then grinding them with mortar and pestle directly into a commercial guanidine thiocyanate–phenol solution (Trizol; Gibco BRL, Paisley, United Kingdom). Total RNA (1 μg) was reverse transcribed at 42°C for 30 minutes in 20 μL 10 mM Tris-HCl, pH 8.3, containing 5 mM MgCl2, 1 U RNAse inhibitor, 2.5 U Moloney murine leukemia virus reverse-transcriptase, and 2.5 μM random hexamers (all from Perkin-Elmer, NJ). Gene expression was analyzed by amplifying reverse-transcribed cDNA (2.5 μL) in the presence of the specific sense and antisense primers (100 nM each) described in Table1. The reaction was performed in 100 μL of 10 mM Tris-HCl, pH 8.3, containing 2 mM MgCl2, 200 μM each dNTP, 0.1 μCi of [α32P]dCTP (specific activity, 3000 Ci/mmol [110 TBq/mmol]; Amersham Italia, Cologno Monzese, Italy), and 2 U AmpliTaq DNA polymerase. Primers specific for β2-microglobulin (50 nM each) were added to each amplification after the first 10 cycles as a control for the amount of cDNA used in the reaction.33 PCR conditions were as follows: 60 seconds at 95°C, 60 seconds at 60°C, and 60 seconds at 72°C. All reactions were performed using a GeneAmp 9700 Perkin-Elmer thermocycler and were analyzed in the linear range of amplification defined by preliminary experiments to be between 20 and 35 cycles for osteocalcin, TGF-β1,PDGF, FGF-A, and VEGF and 20 to 30 cycles for β2-microglobulin. Positive (RNA from adult marrow) and negative (mock cDNA) controls were included in each experiment. Aliquots (20 μL) were removed from the PCR mixture after amplification at different cycle numbers, and the amplified bands were separated by electrophoresis on 4% polyacrylamide gel. Gels were dried using a Bio-Rad apparatus (Hercules, CA) and were exposed to Hyperfilm-MP (Amersham) for 2 hours at −70°C. All procedures were performed according to standard protocols.34
Statistical analysis
Statistical analysis of the data was performed by analysis of variance using Origin 3.5 software for Windows (Microcal Software, Northampton, MA). The probability of mice to survive over time was calculated by the Kaplan-Meier method with censored data using the SigmaStat 2.0 program for Windows (SPSS, Erkrath, Germany).23 Animals were censored from the survival curve when killed for experimental purposes. Survival probability curves obtained for the GATA-1low and the W/Wv mice were compared using the Mann-Whitney rank sum test.
Results
Changes in the hematologic parameters of GATA-1low mice with age
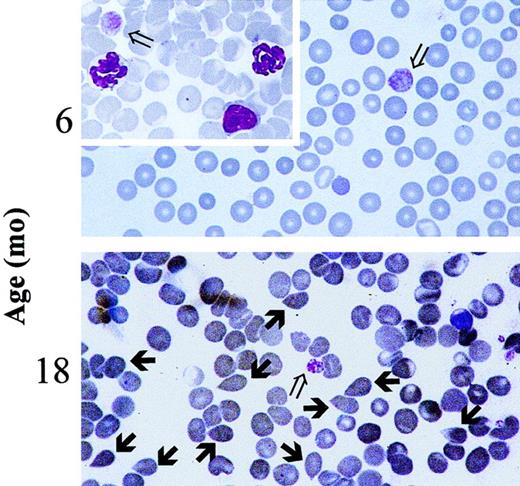
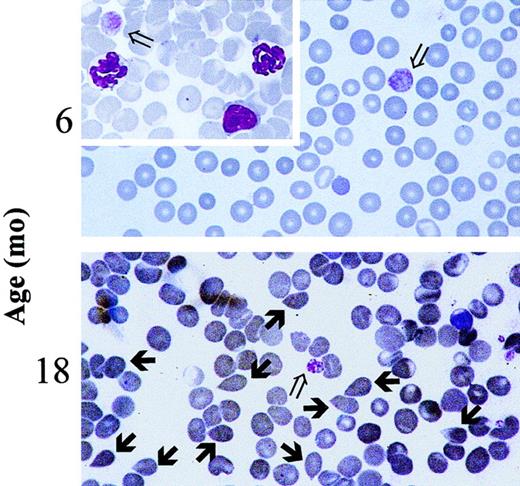
Blood values in progressively older GATA-1low and wild-type littermates are summarized in Table2. Mice were divided into 3 age groups (4-8, 8-12, and 15-20 months of age) for convenience. In the normal littermates, small but not statistically significant variations in the blood cell counts occurred during the aging of the animals (Table 2). The Hct (50.1 ± 3.9 vs 45.3 ± 3.1 at 4-8 vs 15-20 months of age, respectively) and the white cell counts (8.1 ± 4.3 vs 6.7 ± 2.3) slightly decreased with age, whereas the platelet counts slightly increased (728 ± 135 vs 1060 ± 189). In contrast, age-matched GATA-1low animals underwent significant changes of hematologic parameters with age. In particular, the number of circulating red cells decreased significantly at 15 to 20 months of age (Hct 47.2 ± 2.3 vs 30.0 ± 3.9; P < .05) (Table 2) when tear-drop poikilocytes (Figure 1) and erythrocytes with Howell-Jolly bodies and polychromatophilia were detectable in the blood. The frequency of Howell-Jolly body-positive erythrocytes increased from less than 0.1% at 12 months to 1% to 2% at 15 months of age. Although the total number of circulating white cells did not significantly change with age, differential counts revealed changes in relative cell distributions. There was a progressive increase in the percentages of neutrophils, which became statistically significant at 15 to 20 months, and a corresponding decrease in the percentages of lymphocytes. Furthermore, immature myeloid cells were released in the circulation of the mutant mice starting from 8 months of age (Table 2). No variations were observed during aging of the mutant mice in terms of platelet counts that remained significantly lower than normal all through the lifespan (Table 2). The morphology of the circulating platelets remained abnormally large and dysplastic (Figure 1).
Presence of tear-drop poikilocytes in the blood of 18-month-old GATA-1low mice.
May-Grünwald-Giemsa staining of representative blood smears obtained from GATA-1low mice at 6 months (upper panel, as negative control) and 18 months (lower panel) of age. Open arrows indicate the dismorphic platelets characteristic of the blood of the Gata-1low mice.18 21 Solid arrows indicate the tear-drop poikilocytes that circulated in the blood from these mutants since 15 months of age. Similar results were observed in blood smears from at least 4 to 6 mice. In particular, 18 mice were analyzed in the 12- to 18-month age group. (Original magnification, × 100).
In the blood of the wild-type animals, the number of circulating progenitor cells did not significantly change with age but remained at the lower limit of detection in all the experimental groups (fewer than 10 CFC/10 μL; Table 3). In contrast, the number of progenitor cells (of all types) circulating in the blood from the GATA-1low mice increased by 2- to 10-fold at 8 to 12 months and remained higher than normal in older mice (15-20 months). Larger changes were observed for CFU-E, detected at all ages in the blood from the mutants, and reached a peak concentration as high as 114 ± 13 CFU-E per 10 μL blood at 8 to 12 months of age (Table 3).
Development of myelofibrosis in the GATA-1low mice with age
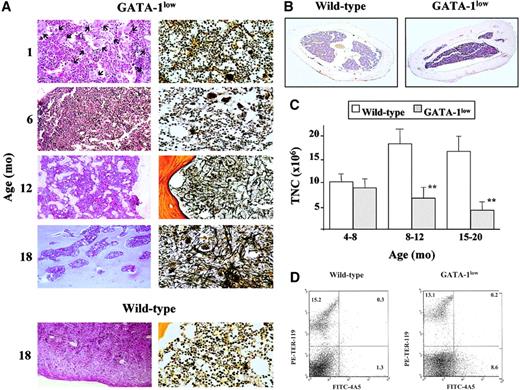
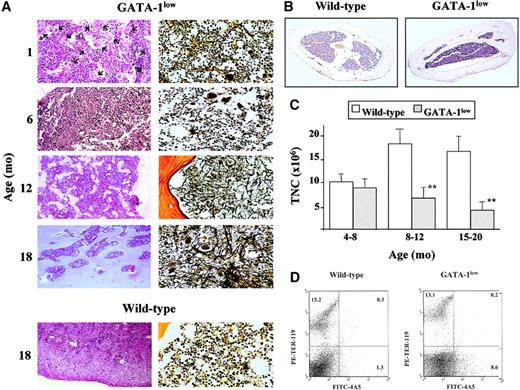
Myelofibrotic degeneration of the marrow and spleen of the GATA-1low mice with age is documented in Figures2 and 3, respectively. Hematoxylin and eosin examination of bone marrow sections from 1-month-old mutants shows the great prevalence of Mk in the marrow without any sign of alterations detectable in the intracellular space by Gomori staining (Figure 2A). As shown by FACS analysis (Figure 2D), the marrow of 1-month-old GATA-1low animals contains approximately 7 times more Mk cells than the marrow from their normal littermates (8.6% vs 1.3%, respectively).
Development of myelofibrosis in the bone marrow of the GATA-1low mice.
(A) Representative hematoxylin-eosin (left column) and Gomori silver (right column) staining of longitudinal sections of femurs from progressively older (1 to 18 months) GATA-1low mice. Representative stainings of the corresponding sections from an 18-month-old wild-type mouse are also shown for comparison (bottom panels). (Original magnifications: left column, × 20 in all cases, except for the × 40 hematoxylin-eosin staining at 1 month of age as evidence of the massive presence of Mk shown by the arrows; right column, × 40). Similar results were observed in at least 4 mice per age group. In particular, 12 mice were analyzed from the 12- to 18-month-old age group. (B) Hematoxylin-eosin staining of representative transversal sections of femur diaphysis from 18-month-old wild-type (left) and GATA-1low (right) mice (original magnification, × 5). Similar results were observed in at least 3 mice per experimental group. (C) Total number of mononuclear cells (TNC) in the femur of progressively older wild-type (white bars) and GATA-1low (gray bars) mice. Mice were arbitrarily divided into the same age groups used in Tables 2 and 3. Results are presented as the mean (± SD) of 4 to 8 separate determinations per age group, for a total of 12 wild-type and 22 GATA-1low mice analyzed. **P < .01 with respect to the values observed in the age-matched wild-type group. (D) Flow cytometry analysis of the expression of TER-119 and 4A5 in bone marrow cells harvested from wild-type (on the right) and GATA-1low (on the left) animals at 1 month of age. Bone marrow from the GATA-1lowanimals contains approximately 6- to 7-fold more 4A5 cells than the marrow from the wild-type animals.
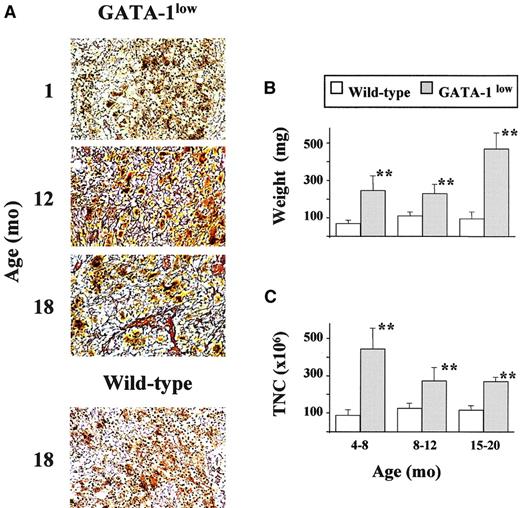
Development of myelofibrosis in the spleen of GATA-1lowmice.
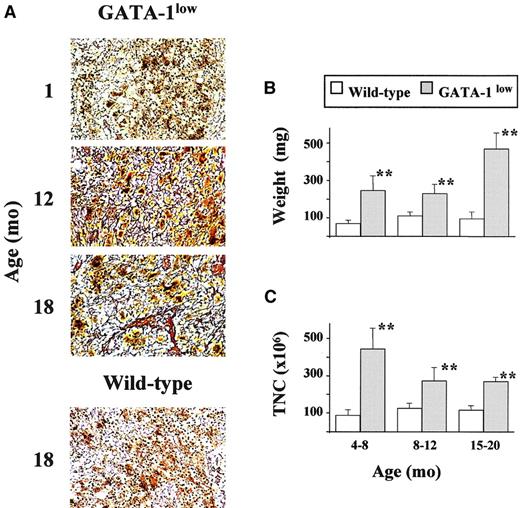
(A) Gomori reticulum staining of representative spleen sections from GATA-1low mice at 1, 12, and 18 months of age that show the progressive appearance of fibers with age. Corresponding staining of a representative section from one 18-month-old wild-type mouse is also presented for comparison (original magnification, × 20). Similar results were obtained in at least 3 independent experiments per age group. In particular, 12 mice were analyzed for the 12- to 18-month-old age group. (B) Weight (in milligrams) of the spleen from wild-type (white bars) and GATA-1low (gray bars) littermates arbitrarily divided into progressively older age groups (the same as used in Table 2). Results are presented as the mean (± SD) of at least 4 independent determinations per experimental group for a total of 12 wild-type and 18 mutant mice analyzed. **Values in the GATA-1low age groups that are significantly (P < .01) different from those found in normal controls of the same age. (C) Total cellularity (TNC) of the spleen from wild-type (white bars) and GATA-1low (gray bars) littermates arbitrarily divided into progressively older age groups. The same animals as those presented in panel B. See legend to panel B for further details.
Starting from 12 months of age, there was a progressive reduction of the space available in the marrow for hemopoietic cells because of the simultaneous increase of bone trabeculae and of intercellular matrix. The massive presence of newly formed bone trabeculae in the femoral cavity led, by 18 months, to a decrease in the space available for hemopoietic cells (see the hematoxylin-eosin staining in the left panels of Figure 2A). In the oldest mice, increased osteogenesis eventually occluded the femoral cavity, as evident in the cross-sections of the femur diaphysis that show the thickness of the cortical region with the interconnecting bone trabeculae occluding the lumen.
Progressive accumulation of fibers in the intercellular space of the marrow from the GATA-1low mutants was also documented by Gomori silver staining (Figure 2A, right panels). The fibers changed from fine and diffuse reticulin fibers at 6 months of age to gross collagen fibers from 12 months on and ultimately almost completely filled the femoral cavity.
The reduction of the space available in the marrow for hemopoietic cells was associated with a reduction in total marrow cellularity (Figure 2C). Although the cellularity of the marrow from the wild-type mice increased with age, that of the mutant animals, which was slightly but significantly lower than normal already in the 4- to 8-month group, was further reduced by 2-fold in the 15- to 20-month-old group (Figure2C).
Changes were specifically observed in the frequency of progenitor cells in the marrow from the GATA-1low mice with age. In fact, though no consistent change was found to be associated with age in normal mice, a significant (2- to 3-fold) decrease was observed in the frequency of all types of progenitor cells in the GATA-1low mice with age (Table 3), which, if adjusted for the reduction in total marrow cellularity, corresponds to a 4-fold reduction in total number of progenitor cells per femur (Figure 2D).
The accumulation of reticulin fibers with age was also documented by Gomori staining in the GATA-1low spleen (Figure 3A). Additional proof for the fibrotic degeneration of this organ came from the fact that the size of the already massive spleen of the mutant mice further increased with age (Figure 3B), but the total spleen cellularity—though remaining significantly higher than that of the spleen from the normal mice—decreased with age (Figure 3C). Therefore, the increase in spleen weight observed in the GATA-1lowmice at 15 to 20 months of age resulted from an accumulation of collagen fibers (Figure 3). The total number of cells in the spleen was found to be reduced for the first time at 8 to 12 months of age when the highest number of CFU-E was present in the circulation (Figure 3; Table 3).
No changes were observed in the frequency of progenitor cells in the spleen of the wild-type littermates with age (Table 3), but, in the spleen of the GATA-1low mice, only the frequency of the myeloid progenitors (CFU-GM) remained constant. Those of the erythroid progenitors (BFU-E, CFU-E), though higher than in normal animals, decreased 2- to 3-fold over time. On the other hand, the frequency of megakaryocytic progenitors (CFU-Mkp and CFU-Mkm), which had already been higher than normal in the 4- to 8-month group,21 further increased to 62 ± 6 per 105 cells to 80 ± 15 per 105 cells at 15 to 20 months. However, because of the overall decrease in spleen cellularity (Figure 3B), the total number of progenitor cells of all types in the spleen actually decreased with age.
Liver as site of extramedullary hematopoiesis in the old Gata-1low mice
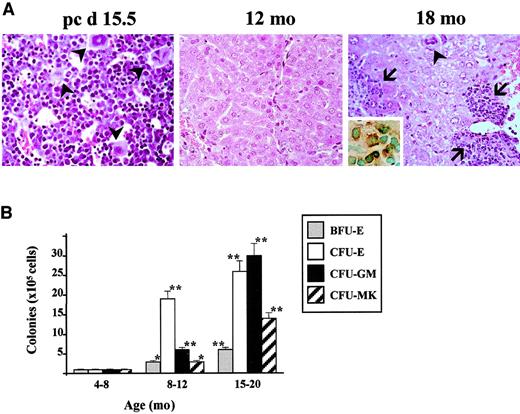
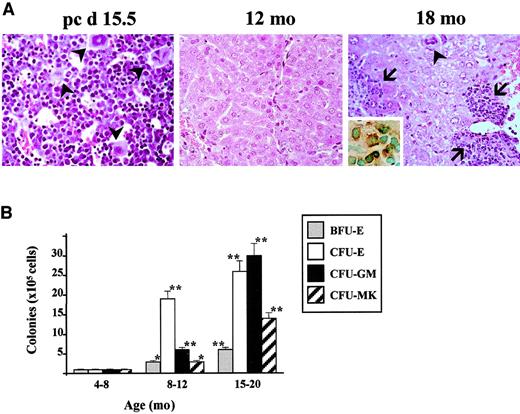
As expected, the hematoxylin-eosin staining of fetal liver shows a hemopoietic organ with abundant Mk in its parenchyma (Figure4A), but no sign of active hemopoiesis was detectable in the liver of the GATA-1low mice after birth (1-12 months of age) (Figure 4A and results not shown). However, by 18 months, foci of hematopoiesis were recognized again within the liver parenchyma of the mutant animals, as confirmed by CD45− immunostaining of the consecutive liver section (Figure 4A, right panel, inset). These foci were never found in liver sections obtained from age-matched wild-type mice (results not shown).
Liver as an extramedullary site of hematopoiesis in old GATA-1low mice.
(A) Hematoxylin-eosin staining of liver sections from a 15-day postcoitum GATA-1low fetus (left panel) or from adult GATA-1low mice at 12 (middle panel) or 18 (right panel) months of age. The inset in the left panel presents CD45 immunohistochemical staining of the liver section immediately following that stained with hematoxylin-eosin. MK are indicated by solid arrowheads and solid nests of hemopoietic cells are indicated by solid arrows. Six mice were independently analyzed in the 12- to 18-month-old age group (original magnification, × 20 for the left panel, × 10 for the middle and right panels, and × 40 for the inset). (B) Frequency of hemopoietic colonies (BFU-E, CFU-E, CFU-GM, and CFU-Mk, as indicated) per 105 liver cells from GATA-1lowmice. Animals were arbitrarily divided into the same age groups used in Table 2. Results are presented as the mean (± SD) of 3 independent experiments for a total of at least 4 mice analyzed per experimental group.
Progressive involvement of the liver as a site of active hemopoiesis in the old GATA-1low mice was further confirmed by the analysis of progenitor cells in this organ (Figure 4B). Until 4 to 8 months of age, progenitor cells were detectable in the liver of the mutant mice at low frequencies and were similar to those found in the liver of normal mice of all ages (Kurata et al35 and results not shown). However, starting from 8 to 12 months, significant numbers of progenitor cells were detected in the liver of the mutants (0.35% of all the cells; Figure 4B). The frequency of these cells further increased (0.8% of all the liver cells) in the 15- to 20-month-old mice. CFU-E were among the most frequent types of progenitor cells in the liver of old animals. Foci of hematopoiesis were not detectable in sections of lungs and kidneys of the mutant or normal littermates at any age (results not shown).
RT-PCR of the expression of TGF-β, PDGF, FGF-A, VEGF, and osteocalcin by the femur and by isolated Mk from GATA-1lowand wild-type mice
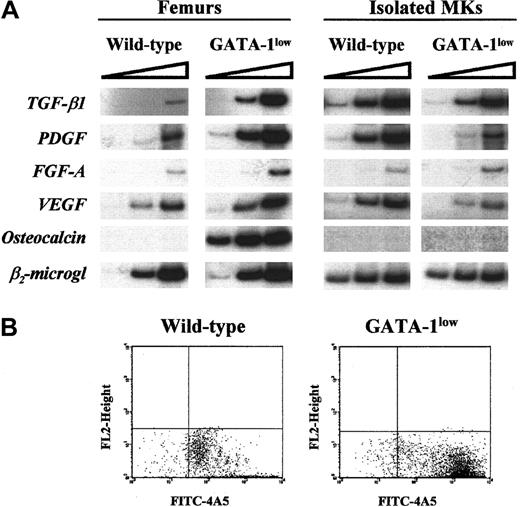
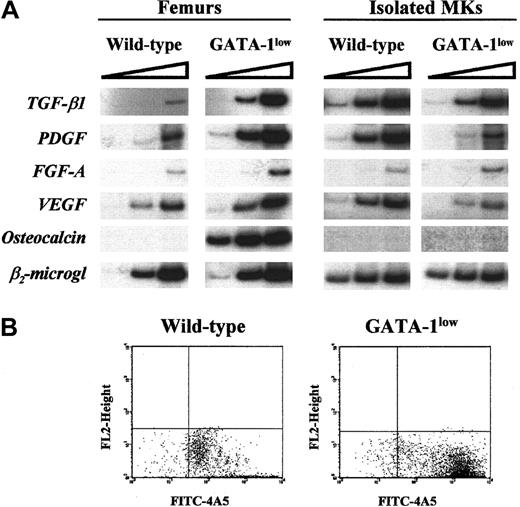
Using RNA prepared from the entire femur of each wild-type animal, cDNA fragments specific for TGF-β, PDGF, and VEGF were amplified at detectable levels only at the highest PCR cycles (Figure5A). On the other lane, cDNA fragments for osteocalcin were never amplified, even when the reaction was extended up to 40 cycles (Figure 5A and results not shown). Our results confirm that these genes are expressed at low levels by preparations of unfractionated bone and marrow cells from adult wild-type mice. In contrast, with RNA prepared from GATA-1low femurs, cDNA fragments for osteocalcin were readily amplified, and amplification of cDNA fragments for TGF-β, PDGF, and VEGF was detectable even after a few cycles (Figure 5A). These results indicate that all these genes are expressed at higher levels in the femur of the mutant mice than in that of the normal ones. Because fragments for FGF-A were barely amplified at the highest PCR cycles using RNA from normal and GATA-1low femurs, it is not possible to draw any conclusion about its relative levels of expression in the GATA-1lowversus the wild-type femur (Figure 5).
(A) RT-PCR expression of Mk (TGF-β1, PDGF, FGF-A, and VEGF) and osteoblast-derived growth factors (osteocalcin) in the whole femurs (left panel) and in Mk cells (right panel) isolated from the spleens of wild type and Gata-1low mice.
β2-microglobulin was amplified as positive control, and mock-extracted RNA was amplified as negative control (not shown). Each product was amplified for increasing numbers of cycles within the linear portion of the respective amplification kinetics (21, 24, and 27 cycles for β2-microglobulin and 25, 30, and 35 cycles for all the other genes), as indicated by the triangle on the top of the panel. Similar results were obtained in 2 additional experiments. (B) Flow cytometry reanalysis for purity of the Mk cells isolated by immunomagnetic selection from the spleens of wild-type (left) and GATA-1low (right) mice as described in “Materials and methods” and used for the RT-PCR shown in panel A.
To clarify whether the high expression of growth factors known to be produced by Mk in the GATA-1low femur resulted from its increased Mk content (Shivdasani et al18, Vannucchi et al21, and Figure 2A) or from altered gene expression by the mutated cells, Mk were purified (greater than 90%; see the FACS dot plots in Figure 5B) with standard immuno-affinity techniques from the spleens of normal and mutant littermates, and the RNA extracted from them was used to analyze the levels of expression of TGF-β, PDGF, FGF-A, and VEGF by semiquantitative RT-PCR (Figure 5A, right panels). β2-microglobulin was amplified with similar kinetics using RNA extracted from GATA-1low and normal Mk. cDNA fragments for TGF-β1, PDGF, and VEGF were amplified less efficiently with RNA from GATA-1low Mk than from the corresponding wild-type cells. Once again, amplification of the cDNA for FGF-A was observed only at the highest PCR cycles, making it impossible to draw any conclusions about its relative levels of expression in normal and mutant cells.
Survival of the GATA-1low mice with age
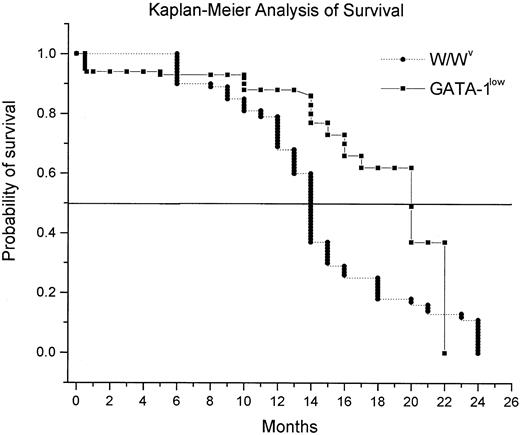
Kaplan-Meier analysis of the probability of survival of the GATA-1low mice with age is shown in Figure6. Mice killed for experimental purposes were censored from the analysis. It is difficult to calculate the percentage of survival of the GATA-1low mice at birth because only 30% of the pregnancies induced (as established by the presence of the vaginal plug 24-48 hours after mating) resulted in viable pups. Once the pups were born, however, they were highly vital. Only 9 of 178 GATA-1low mutants born alive died within the first 15 days of life (Figure 6). Few mice died from 15 days to 13 months. Most of the deaths (10 of 25 natural deaths recorded) occurred between 14 and 20 months of age, and only 9 animals were alive after 20 months. Because normal littermates in numbers sufficient for survival studies were unavailable, the probability for survival of the mutant mice was compared with that of mice harboring the W/Wvmutation, a mild genetic defect that, as the GATA-1lowmutation, causes anemia and mast cell deficiency (Nocka et al36 and manuscript in preparation). GATA-1low mice had a probability of survival over time significantly higher than that of the W/Wv mice (50% of mice dead at 20 vs 14 months of age, respectively;P < .001 by rank sum test) (Figure 6).
Kaplan-Meier analysis of the probability of survival with age for GATA-1low (squares) and W/Wv(triangles) mice.
For the GATA-1low mice, the probability of survival was calculated starting with 178 mutants born in the facility over a period of 3 years. Because the birth of the animals was not synchronous and animals were killed for experimental purposes, the number of mice used to calculate the survival curve changed with age and included a total of 147 animals up to 13 months and 31 animals from 14 months on. In the case of the W/Wv mice, the survival probability was calculated on a cohort of 204 mice, 50 of which were censored because they were killed for other experiments. The 2 survival curves are statistically different (P < .001) by Mann-Whitney rank sum test.
Discussion
This paper describes that mice harboring the GATA-1lowmutation, unlike their normal littermates, develop at 15 months of age an IM-like disease characterized by the presence of (1) anemia (Table2), tear-drop poikilocytes (Figure 1), and progenitor cells (Table 3) in the blood; (2) collagen fibers in the marrow (Figure 2) and in the spleen (Figure 3); and (3) hemopoietic foci in the liver (Figure 4). The phenotype was expressed by hemizygous males and homozygous females, with an apparent penetrance of 100%. These results suggest that development of the disease in these mice may be the direct consequence of the GATA-1low mutation.
Although the GATA-1 gene has been identified since 1989 as a pivotal gene in erythroid differentiation,37 genetic GATA-1 alterations have not been found associated with human abnormalities for a long time. In fact, the extreme severity of the phenotype expressed by GATA-1 mutations experimentally induced in mice had suggested that alterations of this gene, possibly occurring in humans, would go undetected because of their lethality. Most recently, GATA-1 mutations altering either the FOG-binding or the DNA-binding domain of the protein have been described to be associated with human inherited diseases characterized by alterations in the megakaryocytic and the erythroid differentiation pathways, such as dyserythropoietic anemia,38 and X-linked thrombocytopenia,39,40and thalassemia.41
IM is a clonal disease that can be experimentally transmitted in mice10 and cured in mice9 and humans42 by bone marrow transplantation. It is associated with Mk accumulation in the marrow and with thrombocytopenia and anemia in the blood. These facts suggest that IM may be caused by gene defects that impair the stem cell ability to differentiate along the Mk and the erythroid pathways. TPO and its receptor, Mpl, the 2 genes most likely to cause defective Mk differentiation,6 have not been found altered in 14 IM patients carefully analyzed for this purpose.12 Therefore, the search for the genetic defect involved in the development of IM is still open. We suggest that, at least in some patients, human IM may result from altered regulation ofGATA-1 gene expression or from other mutations in the GATA-1 functional pathway because IM, as do the human genetic diseases associated with GATA-1 mutations described so far,38-41presents defective differentiation of the megakaryocytic and the erythroid pathways, because the slightly higher incidence of IM in males than in females (0.73 and 0.40 new diagnoses every year per 100 000 males and females, respectively43) indicates that its cause may be partially X-linked, and because of the phenotype of the GATA-1low mice as described in this paper. Current experiments are under way to verify this hypothesis.
Several animal models have been developed in recent years for the study of IM. The major difference found between the IM traits expressed by the GATA-1low mice and those expressed by other models for the disease is represented by the rate of the progression toward its final exitus that was slow in the GATA-1low mice but rapid in the other models. In fact, wild-type mice that received transplants of bone marrow cells infected with a TPO-containing retrovirus developed a fatal IM syndrome within 2.5 to 3 months, and the final exitus was recorded approximately 7 months from transplantation.9,10 Furthermore, mice transgenic for the TPO gene survived only shortly after birth.7 In contrast, the GATA-1low mice manifested their first IM symptoms (reticulin fibers in the marrow and in the spleen [Figures 2, 3] and alterations in the frequencies of progenitor cells in the various organs [Table 3; Figure 4]) at 8 to 12 months of age, whereas a clear picture of IM was not observed until 15 months (Figures 1-3). However, few of the GATA-1low mice survived more than 2 to 4 months after the first sign that the disease had became manifested (Figure 6). The slow appearance of the first IM traits followed by a rapid final exitus has strong analogies with the human disease. In fact, human IM is usually diagnosed in the second half of life, but, when the first sign of the disease becomes manifested, the final exitus occurs within 4.5 years.3 In contrast with human IM that may evolve into acute leukemia, leukemic cells and growth factor–independent hemopoietic progenitors were never detected in tissues from GATA-1low mice (Vannucchi et al21 and data not shown). However, the transformation of an abnormally proliferating stem–progenitor cell pool represents the final step of a disease progression that may not have the time to occur within the 2-year lifespan of a mouse. Serial transplantation in congenic mice will be required to clarify whether the GATA-1low stem cell pool will undergo transformation with time.
GATA-1low mice express in their marrows and spleens 10 times more Mk cells than normal tissues at 1 month of age (McDevitt et al,17,20 Shivdasani et al,18 and Figure 2), but they manifest the first signs of fibrosis 11 months later. In contrast, TPO over-producing mice develop the disease 2 to 3 months after their marrow Mk content increases by 2-fold.6-9 To clarify this difference, we compared by semiquantitative RT-PCR the expression levels of genes encoding growth factors associated with the development of IM by the femur and by Mk cells of GATA-1low mice and of their normal littermates. Osteocalcin, TGF-β1, PDGF, and VEGF were all found to be expressed at higher levels in the femur of the GATA-1lowmice than in that of the normal littermates, but the levels of expression of the Mk-specific genes were not as high as expected on the basis of the absolute Mk content of their marrow (Figure 5). Indeed, Mk purified from the spleen of the mutants expressed lower levels of TGF-β1, PDGF, and VEGF than the corresponding cells from normal spleens (Figure 5), indicating that the GATA-1low mutation impairs the capacity of Mk to differentiate into proplatelets17,18 and impairs their capacity to express certain growth factors. The presence of many functionally impaired Mk in the tissue of these mice may, then, underlie their slow progression toward IM. Alternatively, causes other than the accumulation of Mk cells in the marrow may contribute to the development of IM in the GATA-1low animals. In fact, increased numbers of Mk in the marrow is necessary, but not sufficient, for the development of the disease in mice. Wild-type9 and SCID10 mice that over-express human TPO by retrovirus-mediated gene transduction develop IM, but NOD-SCID mice infected with the same virus10 and a transgenic line in which TPO over-expression was targeted to the liver6 do not. Because all these mice express similarly high levels of TPO in the serum and of Mk in the marrow, genetic components different from those that regulate Mk cells and that are probably linked to those involved in the regulation of the monocytes–macrophages may represent important cofactors in the development of the disease in mice.
In conclusion, the GATA-1low mutants represent a new animal model for human IM, and the observed association between poor capacity of the mutated Mk cells to produce growth factors with a low morbidity of the disease may provide insights into possible treatment strategies for humans.
We thank Dr Stuart Orkin for providing the GATA-1lowmouse model and for continuous support and critical reading of the manuscript, and we thank Prof Giuliano D'Agnolo for encouragement. We also thank Luca Marsilli for assistance with the breeding program, Andrea Beni for help in cell cultures, and Eugenio Torre for technical assistance.
Prepublished online as Blood First Edition Paper, May 17, 2002; DOI 10.1182/blood-2001-11-0006.
Supported by Ministero per la Ricerca Scientifica e Tecnologica, Progetti di Ricerca di Interesse Nazionale 2000, 2001, and 2002; MURST (PRIN 2000, grant MM06103241); grant E1172 from the Telethon Foundation, Fondi Ricerca Corrente, Ministry of Health and institutional funds from Istituto Superiore di Sanità, Rome, Italy; Associazione Italiana per le Leucemie “30 ore,” Florence and by a donation from Famiglia Cecchi. L.B. and C.C. are recipients of fellowships from Fondazione Italiana Ricerca sul Cancro, Milan, Italy.
The publication costs of this article were defrayed in part by page charge payment. Therefore, and solely to indicate this fact, this article is hereby marked “advertisement” in accordance with 18 U.S.C. section 1734.
References
Author notes
Anna Rita Migliaccio, Clinical Biochemistry, Istituto Superiore Sanità, Viale Regina Elena 299, 00161 Rome, Italy; e-mail: migliar@iss.it.

