Abstract
Red cell (RBC) deformability and membrane-bound immunoglobulin G (IgG) were studied to better understand premature clearance of erythrocytes in hereditary spherocytosis. Averaged deformability profiles from cells having comparable cell age revealed that splenectomy was more beneficial for spectrin/ankyrin-deficient than for band 3–deficient RBCs. Splenectomy prevented an early loss of young cells in both types of deficiencies. It had an additional beneficial effect on spectrin/ankyrin-deficient but not band 3–deficient RBCs. It prolonged the survival of mature spectrin/ankyrin-deficient RBCs such that they lost their deformability more slowly than RBCs from patients who had not undergone splenectomy. Band 3–deficient RBCs lost their deformability at the same rate before and after splenectomy. In HS patients with band 3 deficiency who underwent splenectomy, RBC deformability inversely correlated with the number of RBC-bound IgG (up to 140 molecules per cell). In spectrin/ankyrin deficiency, RBC-bound IgG remained at control levels (60 IgG or less per cell). It appears that spectrin/ankyrin-deficient RBCs escaped opsonization by releasing band 3–containing vesicles because their band 3 content and deformability dropped in parallel with increasing cell age. Band 3–deficient RBCs did not lose band 3 with increasing cell age. Hence, it is possible that band 3 clusters required for bivalent binding of low-affinity–IgG, naturally occurring antibodies were retained in band 3–deficient RBCs with a relative excess of skeletal proteins but were released from spectrin/ankyrin-deficient RBCs, in which vesicle budding was facilitated by an impaired skeleton.
Introduction
Hereditary spherocytosis (HS) is characterized by the presence of spherocytes in peripheral blood smears with varying degrees of hemolysis and splenomegaly (for review see references 1 and 2). HS is caused by inherited family-specific mutations. These involve 5 proteins that link the membrane skeleton to the overlaying lipid bilayer: α and β spectrin,3 ankyrin,4band 3,5,6 and protein 4.2.7 Most mutations leading to HS were found in ankyrin4,8,9 and spectrin. More than 10 β spectrin alleles cause the formation of an unstable transcript or a truncated polypeptide that is inefficiently incorporated into the red blood cell (RBC) membrane.1,10,11 Band 3 mutations are also inherited as a dominant trait, but with relatively mild anemia and spherocytosis.2 Substitution of highly conserved amino acid residues12-15 positioned at the internal boundaries of transmembrane segments of band 3 protein probably interfere with the cotranslational insertion of band 3 into the membrane of the endoplasmic reticulum or the stability of the inserted protein. A 22-residue insertion in the transmembrane domain of band 3 Milano prevents incorporation of the polypeptide in the membrane because the mutant form of the protein was not found in the RBC membranes of the affected patients.16 Thus, in most cases, the defective genes are not expressed or proteins encoded by these genes are not incorporated in the membrane. Consequently, most HS results from an imbalance among the normal membrane proteins taking part in the vertical anchorage of the skeleton to the membrane.17 The imbalance does not equal 50%, but it varies from 10% to 30% in mild cases and higher percentages in moderate to severe cases because of different degrees of compensation by normal alleles in single heterozygotes or by other mutations in compound heterozygotes.2 Deficiency of a skeletal or an integral membrane protein involved in anchorage undoubtedly reduces the number of vertical, membrane-stabilizing interactions, but this alteration occurs in different contexts depending on whether it concerns an integral or a peripheral membrane protein. With skeletal protein deficiency, a reduced number of vertical interactions coexists with an almost normal number of integral membrane proteins. In band 3 deficiency, however, a lower number of vertical interactions coexists with a normal cytoskeleton. It is therefore conceivable that the 2 types of imbalance result in different membrane alterations and clearance mechanisms.
Little is known about the membrane alterations occurring in the 2 groups of HS,18,19 and even less is known about the mechanisms by which the altered HS RBCs are prematurely cleared. One reason is that the fate of HS RBCs is governed not only by their membrane defect but also by the spleen that aggravates the inherent defect through what is called splenic conditioning. Although HS RBCs have an increased Na+ level and a decreased K+content,20 RBCs from the splenic pulp have particularly diminished K+ and water contents21 and are more fragile and spherical than those from the circulation.22 Another reason for the limited knowledge about membrane alterations in HS is that RBC properties are difficult to compare,23 when determined on whole RBC populations, because the populations differ in cell age distribution between healthy controls and HS patients, among different HS types, and before and after splenectomy. Based on these premises we studied membrane deformability and RBC-bound IgG of the 2 groups of HS RBCs with virtually normal integral (spectrin/ankyrin deficient) or normal cytoskeletal protein content (band 3 deficient) on density-fractionated HS RBCs as a function of their absolute cell age.24 We compared membrane properties in family members who did and did not undergo splenectomy and focused on the HS RBCs of those who did in studying cell-bound IgG and deformability.
Patients, materials, and methods
Patient material
Blood samples were obtained from patients with HS and hematologically healthy controls, usually from the same families, or from healthy laboratory personnel at the site of blood collection. Informed consent was obtained from patients and their family members. Unless indicated, splenectomized patients were compared with unsplenectomized members of the same family (HS pairs). Each patient was assigned a number and the initials of the clinician who had earlier characterized the type of deficiency. Some of the patients with band 3 deficiency and mild to moderate anemia had different known genetic defects (Table 1), and the deficiency levels ranged from 19% to 30%. Some of the spectrin/ankyrin-deficient patients had spectrin deficiency, others had combined spectrin/ankyrin deficiency, with levels ranging from 20% to 44%. Unsplenectomized family members had moderate to severe anemia. In one patient pair (SE), a frameshift mutation in ankyrin was identified (1069delGC).4 Hematologic parameters determined at analysis of unsplenectomized and splenectomized family members are summarized in Table 2. Clinical expression of anemia was similar in all patients before splenectomy (Table 3), except that the extent of reticulocytosis was higher in most patients who then underwent splenectomy.
Blood collection and filtration
Blood was collected from HS patients and controls and was filtered to remove white cells using sterile blood filtration devices assembled by us. Thirty milliliters blood was collected into a collection bag (R4R2004; Baxter, Switzerland) supplemented with 4.2 mL CPD-type (citrate-phosphate-dextrose) anticoagulant. The bag with the anticoagulant was placed on a balance near the patient's bed to monitor the amount of blood collected. Once disconnected from the patient, blood filtration was performed within 1 hour at room temperature by passive flow through a Sephacell R-200 filter (Asai Medical). The filter was connected to a sterile transfer bag. When all blood had left the collection bag, 14 mL sterile isotonic sodium chloride was injected to rinse the filter. Filtered blood samples were brought on ice to Zurich within 4 to 18 hours, except in one case (36 hours). RBC, hct, and MCV levels were measured using a Sysmex F-800 cell counter (TOA Medical Electronics Europe GmbH, Hamburg, Germany).
RBCs from unrelated controls
To obtain sufficient amounts of normal RBCs with a low band 4.1a/4.1b ratio, larger volumes of normal RBCs had to be fractionated. In this case, whole human control blood (0 Rh+) collected in CPD-adenine (Swiss Red Cross; Blood Bank, Zurich) was filtered through cellulose to remove white blood cells25 as described.26
RBC density separation on self-forming Percoll gradients
Filtered blood was centrifuged at 478g for 10 minutes, and the supernate was discarded. Pelleted cells were added to a Percoll buffer (854 g/L Percoll (Amersham Pharmacia Biotech AB, Uppsala, Sweden), 10 mM NaKHPO4, 144 mM NaCl, 0.5 mM EDTA (ethylenediaminetetraacetic acid), 5 g/L d-glucose, 30 μg/mL phenylmethylsulfonyl fluoride, osmolality 320 mOsm/kg, pH 7.4) to a hematocrit of 10% as described elsewhere.26 The suspension was mixed and centrifuged at 33 000g for 30 minutes in an angle rotor. The banding pattern of RBC density gradients was photographed. Density-separated RBCs were fractionated into 4 to 6 portions from the top to the bottom of the tube.26Fractionated RBCs were diluted with glucose-supplemented phosphate-buffered saline (PBS-G), centrifuged at 478g for 10 minutes, and washed 3 times with 5 to 10 vol PBS-G by gentle RBC mixing and recentrifugation.
Measurement of erythrocyte deformability by ektacytometry
RBC deformability was measured using a laser diffraction technique with an Ektacytometer (Technikon Products, Bayer, Germany).27 RBCs were suspended in a viscous solution containing Dextran T70 (Amersham Pharmacia Biotech AB). Dextran T70 initially dissolved in bi-distilled water at a concentration of 20% was diluted to 18% by supplementing with 10 mM NaKHPO4 (pH 7.45), 1 g/L d-glucose, and 0.08% sodium azide. The concentration of NaCl was adjusted to give the desired final osmolality. Red cells (3-4 × 10⁸ RBC/mL) were suspended in 4 mL isotonic dextran solution (300-320 mOsm/kg) immediately before they were subjected to constant shear stress (150 rpm, 159 dyne/cm2) over an osmolality gradient from 120 to 650 mOsm/kg. Osmoscans of RBCs yielded the deformability (elongation index [EI]) as a function of the applied osmolality. Averaged osmoscans were obtained by determining the values of the EI maximum, the osmolality values at the minima in the hypotonic and hypertonic arms of the curve, and the minimal and maximal osmolality values, where EI was maximal. Means of these data points were calculated for RBCs of comparable cell age from spectrin/ankyrin- and band 3–deficient unsplenectomized and splenectomized patients.
Radioiodination of protein G
Recombinant protein G (Sigma, St Louis, MO) was125I-iodinated (Na125I, Amersham, Little Chalfont, England) by using chloramine T as an oxidant.28Unreacted free 125I was removed by passage through a desalting column with Sephadex G-25 and was equilibrated with PBS containing 1 mM NaI, 1 mM EDTA, and 0.005% gelatin. Specific activities of the recovered protein ranged from 15 to 40 × 106 cpm/μg. Labeled protein was stored in aliquots at −20°C. Before use, labeled protein G was supplemented with ovalbumin (Sigma) to a final concentration of 10 mg/mL, dialyzed against PBS, and adjusted to a protein G concentration of 3 to 6 μg/mL with unlabeled protein G.
Radioimmunoassay for protein G binding to RBC
Binding assays were performed by a phthalate oil separation method described elsewhere.29 The assay was performed in PBS-G buffer. Washed RBCs were adjusted to a cell number of 2 to 3 × 10⁹ RBC/mL. RBC suspensions of 25 μL were added to an equal volume of 125I-labeled protein G (4 × 10⁷ cpm/mL, 3-6 μg/mL) containing 10 mg/mL ovalbumin, mixed, and incubated on ice for 1 hour. The reaction was stopped by adding 150 μL PBS-G (4-fold dilution) and centrifuging an aliquot of 150 μL through 200 μL of a precooled phthalate oil mixture (70% dibutyl phthalate and 30% di-isonyl phthalate) in 400 μL polyethylene centrifuge tubes for 4 minutes at maximal speed in a Beckman Mikrofuge. Tubes were frozen on dry ice, tips containing pelleted cells were cut, and RBC-bound radioactivity was determined in a γ-counter (Kontron MR 480; Zurich, Switzerland).
Isolation of RBC membranes
RBC membranes were prepared from washed cells by lysis with 30 vol cold hemolysis buffer (5 mM NaKHPO4, 1 mM EDTA, pH 7.4). Pelleted membranes were resuspended and washed twice with 30 vol cold hemolysis buffer, which in the first wash was supplemented by 0.8 mM di-isopropylfluorophosphate. Membranes were diluted with hemolysis buffer to the initial volume of packed cells. They were solubilized and alkylated by adding sodium dodecyl sulfate (SDS) and NEM to final concentrations of 1% and 5 mM, respectively. Aliquots were stored at −70°C.
SDS–polyacrylamide gel electrophoresis (SDS-PAGE) was performed according to a modified Neville procedure.30 Samples were heated for 3 minutes in a boiling water bath in sample buffer (60 mM Tris-HCl, pH 6.8, 10 mM EDTA, 5% glycerin, 2% SDS, 0.002% bromphenol blue [Sigma], 40 mM dithiothreitol) and then were alkylated with 50 mM NEM. Gels containing 7% to 8% total acrylamide (0.5-mm–thick minigels) were run for 45 to 90 minutes at 50 mA in a BioRad gel electrophoresis apparatus (BioRad, Hercules, CA), stained with 0.28 g/L Coomassie brilliant blue R-250 (Sigma) in 50% methanol and 7% acetic acid, and destained in 20% methanol and 10% acetic acid.
Absolute cell age parameter and densitometric quantification of proteins on SDS-PAGE
Band 4.1 appears in 2 bands (4.1a and 4.1b) on SDS-PAGE.24,31,32 Chemical conversion of 4.1b to 4.1a occurs in a time-dependent manner24,32 because of deamidation at Asn 502.24 Deamidation at this single amino acid residue alters the electrophoretic mobility of the protein so that type 4.1a can be separated from type 4.1b on SDS-PAGE. The ratio of the amount of band 4.1a to band 4.1b is considered to be an excellent absolute red cell age parameter.26,33 34 The ratios of 4.1a/4.1b and of band 3/spectrin+ankyrin were quantified as follows: wet SDS polyacrylamide gels, stained with Coomassie brilliant blue R-250, were scanned with a Personal densitometer (Molecular Dynamics, Sunnyvale, CA). Digitized pictures were quantified with the Image Quant program (Molecular Dynamics) using magnified images of the gels. Background signals were subtracted.
Results
Osmotic deformability profiles of whole cell populations from HS RBCs with band 3 or spectrin/ankyrin deficiencies
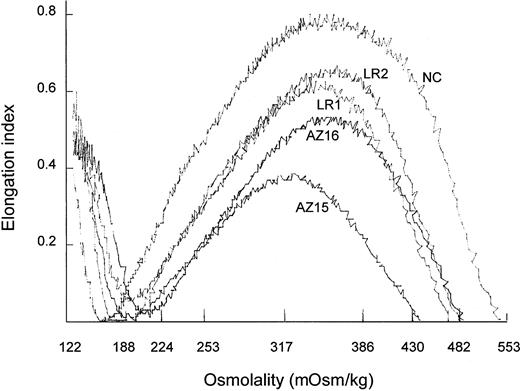
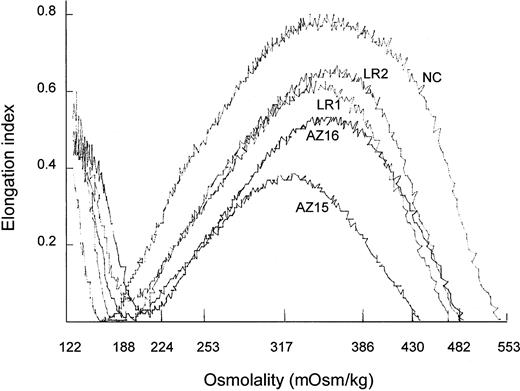
Osmotic deformability profiles (osmoscans)27 of whole RBC populations from HS patients were compressed compared with those of normal RBCs (Figure 1). The EI maxima of HS RBCs from unsplenectomized patients were lower in RBCs with spectrin/ankyrin deficiency (AZ15) than in RBCs with band 3 deficiency (LR1). Deformability of the whole RBC population was higher in splenectomized than in unsplenectomized HS patients with either type of deficiency. The EI maxima, however, increased more in spectrin/ankyrin than in band 3 deficiency. Although this suggested a more pronounced beneficial effect of splenectomy on HS RBC deformability in spectrin/ankyrin than in band 3 deficiency, comparisons of whole cell population properties remain incomplete because these populations differ greatly in cell age distribution and reticulocyte numbers. Reticulocyte numbers from unsplenectomized patients were higher in those with spectrin/ankyrin deficiency than with band 3 deficiency (Table 2). Hence, osmoscans from whole RBC populations should be compared at the same extent of reticulocytosis, a criterion that was only fulfilled for postsplenectomy populations with 1.4% ± 0.7% and 1.5% ± 0.5% reticulocytes in the 2 types of deficiencies. To distinguish between abnormalities in the 2 types of deficiencies and to study the effect of splenectomy, ideally cells of the same age had to be compared.
Osmotic deformability profiles of whole RBC populations from unsplenectomized and splenectomized HS patients.
Ektacytometry was performed on whole filtered blood obtained from an unsplenectomized spectrin/ankyrin-deficient patient (AZ15) and from a splenectomized family member (AZ16), from an unsplenectomized band 3–deficient patient (LR1) and from the splenectomized family member (LR2), and from a healthy control (NC).
Splenectomy improved deformability of cell age-matched RBCs to a larger extent in spectrin/ankyrin than in band 3 deficiency
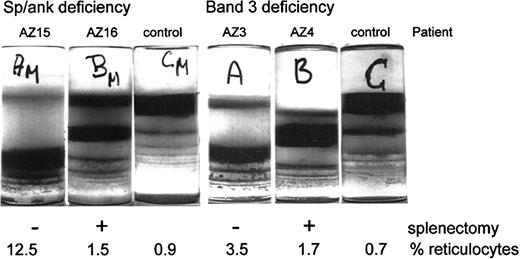
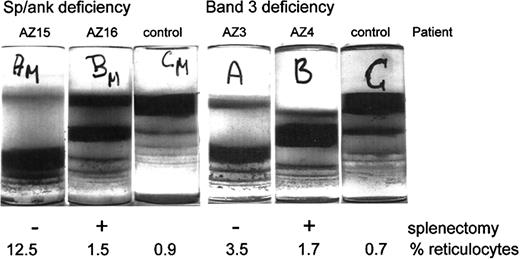
RBCs of a given population can be separated according to density, but not according to cell age.26 Given that density increases differently with cell age in control and patient RBC populations, RBCs from the various populations were fractionated by density and their properties were related to their absolute cell age as determined by the band 4.1a/4.1b ratio. RBCs from unsplenectomized HS patients banded primarily at high densities (Figure2). Cells from splenectomized family members distributed at lower densities. The splenectomy-mediated shift of RBCs from higher to lower densities was observed with both deficiencies but was more pronounced for RBCs with a spectrin/ankyrin deficiency (Figure 2).
Density distributions of HS RBCs with spectrin/ankyrin or band 3 deficiency from unsplenectomized and splenectomized patients.
Blood from HS pairs and controls was filtered, and RBCs were separated on Percoll density gradients. Photographs of these gradients are shown. Patient identification and the actual percentage reticulocytosis are given for each patient.
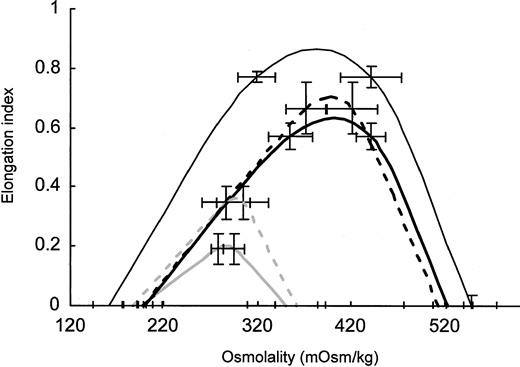
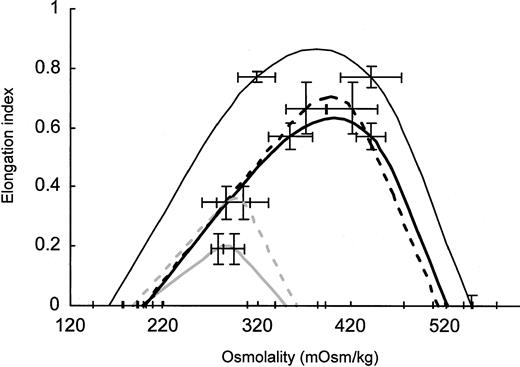
RBCs from 4 to 6 density fractions were collected, washed, and studied by ektacytometry. Membranes from fractionated RBCs were prepared and analyzed for their absolute cell age. To construct an average deformability profile, the profiles of RBCs with comparable 4.1.a/4.1.b ratios were averaged for spectrin/ankyrin or band 3 deficiency from splenectomized and unsplenectomized family members (Figure3). These profiles demonstrate that RBCs from patients with both types of deficiencies profited from splenectomy by having considerably improved deformability. The maximal RBC deformability was 3 times higher after splenectomy in spectrin/ankyrin deficiency. In band 3 deficiency, maximal RBC deformability of cell age-matched RBCs was only 2 times higher in patients who underwent splenectomy. The increase in maximal deformability in spectrin/ankyrin deficiency was underestimated because RBCs of unsplenectomized patients were younger (average, 4.1a/4.1b = 0.55; n = 2) than those of splenectomized patients (average, 4.1a/4.1b = 0.9 ± 0.012; n = 4). It was not possible to compare RBCs of exactly the same cell age because RBCs with a band 4.1a/4.1b ratio higher than 0.55 were already eliminated in vivo in unsplenectomized HS patients with spectrin/ankyrin deficiency. It was furthermore not possible to collect enough material from similarly young cells (4.1a/4.1b ≈ 0.5) from controls and splenectomized patients because such cells comprised a small portion of the whole cell populations. All other RBC fractions compared in Figure 3 had virtually the same cell age—band 4.1a/4.1b ratios varied from 0.9 ± 0.14 to 1.08 ± 0.06. Hence, RBC populations with comparable cell age from unsplenectomized patients with the 2 types of deficiencies differed in their deformability but had virtually the same improved maximum deformability, surface-volume ratio, and density after splenectomy.
Averaged osmotic deformability profiles of cell age-matched RBCs with spectrin/ankyrin and band 3 deficiency from unsplenectomized and splenectomized patients.
RBCs were separated on Percoll density gradients. RBC density fractions were isolated, and ektacytometry was performed on 4 to 5 fractions from each patient. RBC membranes were isolated from all fractions, and the ratio of band 4.1a to 4.1b was determined. Averaged osmotic deformability profiles of RBCs with a comparable 4.1a/4.1b ratio from unsplenectomized and splenectomized patients in both types of deficiencies were calculated for each group of patients, as outlined. Averaged deformability profiles ± 1 SD are given for all types of RBCs if more than 2 samples were studied. In the deformability profile of spectrin/ankyrin-deficient RBCs from unsplenectomized patients (n = 2), minimal and maximal values are represented by error bars. The profiles for spectrin/ankyrin-deficient HS are depicted by solid heavy curves in gray for unsplenectomized and in black for splenectomized patients. The profiles for band 3–deficient HS are shown by dashed heavy curves in gray for unsplenectomized and in black for splenectomized patients. Data from healthy controls are shown by a fine line in black. The band 4.1a/4.1b ratio was 0.55 in unsplenectomized spectrin/ankyrin-deficient patients (n = 2), 0.90 ± 0.01 in splenectomized patients (n = 4), 1.08 ± 0.06 in unsplenectomized band 3–deficient patients (n = 5), 1.05 ± 0.17 in splenectomized patients (n = 5), and 0.90 ± 0.14 (n = 3) in healthy controls.
Splenectomy prolonged red cell age of mature spectrin/ankyrin-deficient RBCs
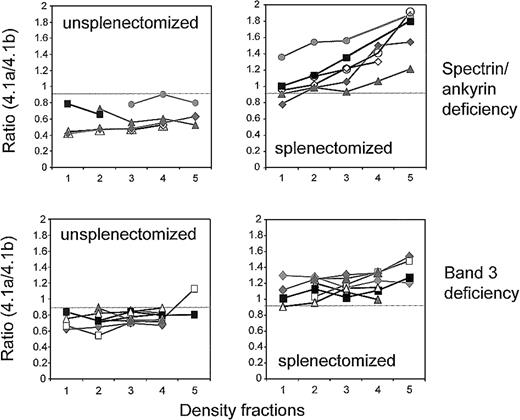
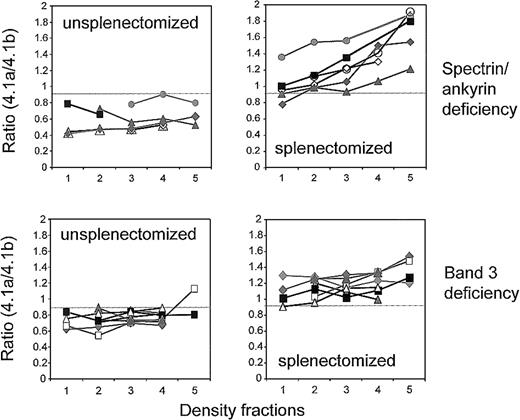
Additional information on the 2 types of deficiency was obtained by analyzing the band 4.1a/4.1b ratio on membrane proteins from density-fractionated RBCs. The band 4.1a/4.1b ratio was low and did not significantly increase with density in membranes from unsplenectomized patients, implying that RBCs were young and did not age considerably (Figure 4). Splenectomy altered the band 4.1a/4.1b ratio in all types of deficiencies. In band 3 deficiency, the band 4.1a/4.1b ratio was higher by 0.3 to 0.4 units but did not significantly increase with RBC density (Figure 4). In spectrin/ankyrin deficiency, the lightest fraction (fraction 1) revealed a similar shift in the band 4.1a/4.1b ratio compared with that of the paired sample. In addition, splenectomy had a unique effect on RBCs with spectrin/ankyrin deficiency—it significantly increased the ratio of band 4.1a to 4.1.b in cells with higher densities. Hence, splenectomy increased their absolute cell age and thus their in vivo survival.
Band 4.1a/4.1b ratios in density-fractionated RBCs of unsplenectomized and splenectomized patients with spectrin/ankyrin and band 3 deficiencies.
Results are shown for unsplenectomized and splenectomized family members. Spectrin/ankyrin deficiency: AZ15.1/AZ16.1 (closed diamonds); AZ17/AZ18 (closed triangles); HL1/HL2 (open diamonds); EG 5.2/EG 6.2 (closed rectangles); SE1/SE2 (closed circles); and from 2 unpaired patients who did (HE, open circles) and did not (AI 4, open triangles) undergo splenectomy. Band 3 deficiency: AZ1/AZ2 (open triangles); AZ3/AZ4 (gray diamonds); AZ5/AZ4 (AZ5, closed rectangles in fractions 2-4; AZ4, gray diamonds); AZ8/AZ9 (closed rectangles); WR1.1/WR2.1 (closed diamonds); WR4/WR5 (closed triangles); LR1/LR2 (open rectangles).
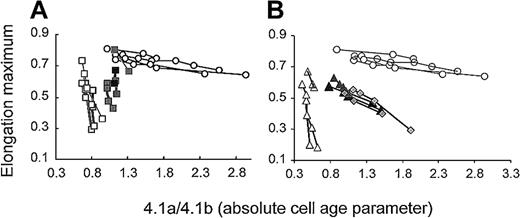
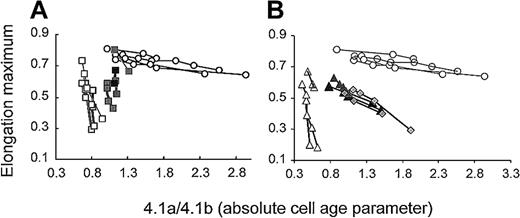
In some of the patients, we had sufficient amounts of density-fractionated RBCs to measure deformability and correlate maximum deformability with absolute cell age. Maximum deformability of RBCs from unsplenectomized patients decreased steeply within a narrow range of cell age for band 3– and spectrin/ankyrin-deficient RBCs (Figure 5, open rectangles and open triangles). In contrast, maximum deformability of normal RBCs decreased little with cell age (Figure 5, open circles). Splenectomy resulted in a shift of the starting points of these curves to a higher cell age. The extent of this shift was comparable for both types of deficiencies (Figure 5, closed rectangles and closed triangles). The finding implies that cells with similarly high deformability were significantly older in all splenectomized patients (Figures 4, 5). The 2 groups of deficiencies differed, however, in the loss of deformability with cell age. RBCs with spectrin/ankyrin deficiency lost their deformability at a reduced rate with increasing cell age than RBCs from unsplenectomized patients. Half-maximum deformability (EI = 0.4) compared with control cells was reached at a band 4.1a/4.1b ratio of approximately 0.5 in unsplenectomized and approximately 1.5 in splenectomized patients, respectively. A similarly slow decrease of deformability with cell age was found for 2 splenectomized HS patients with an established spectrin/ankyrin deficiency (no unsplenectomized family members available) (Figure 5, filled diamonds).
Maximum RBC deformability as a function of cell age in unsplenectomized and splenectomized HS patients with band 3 deficiency and spectrin/ankyrin deficiency.
(A) Band 3 deficiency. RBCs from unsplenectomized patients AZ1, AZ3, AZ8, WR4 (open rectangles). RBCs from splenectomized family members AZ2, AZ4, AZ9, WR5 (closed rectangles). In 3 of these patients, only 2 data points are included because the amount of RBCs recovered from denser fractions allowed band 4.1a/4.1b ratio determination but not ektacytometry. Band 4.1a/4.1b ratios did not significantly increase in denser fractions (Figure 4), suggesting a similarly rapid decay of maximum deformability in denser fractions as found for the lighter 2 fractions. (B) Spectrin/ankyrin deficiency. RBCs from unsplenectomized patients AZ15, AZ17, HL1 (open triangles). RBCs from splenectomized family members AZ16, AZ18, HL2 (closed triangles) and RBCs from 2 unpaired, splenectomized patients (HE and EG 6.2, filled diamonds). Results from control RBCs are shown in both graphs with open circles.
Band 3–deficient RBCs responded differently to splenectomy. Splenectomy increased the cell age of all fractions to a comparable extent (Figure 4). Hence, band 3–deficient RBCs from splenectomized patients lost their deformability at a rate similar to those from unsplenectomized patients (Figure 5). Half-maximum deformability (EI = 0.4) compared with control cells was reached at a band 4.1a/4.1b ratio of approximately 0.8 in unsplenectomized and approximately 1.2 in splenectomized patients, respectively. Thus, the increment in cell age units was less than half that found for spectrin/ankyrin-deficient RBCs.
Firmly bound IgG on HS RBCs from splenectomized patients
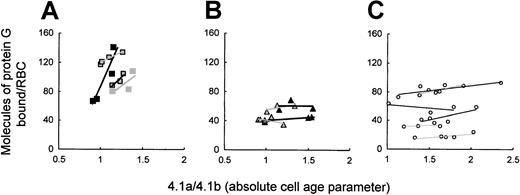
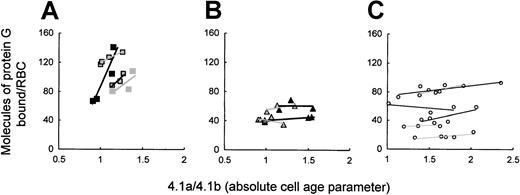
To study whether the premature clearance of HS RBCs was related to IgG opsonization, we studied in vivo IgG opsonization on density-fractionated RBCs from splenectomized patients. Binding of labeled protein G was used to assess RBC-bound IgG. Its amount varied among control cells and only slightly increased within the cell age range studied, which did not include the very old RBCs (Figure6C). In contrast to this, protein G binding was high and increased with cell age in band 3–deficient patients, reaching 2 to 5 times the number recorded for control cells (P < .0001) (Figure 6A). On RBCs with a spectrin/ankyrin deficiency, however, bound protein G was comparable to that in control cells and did not increase with cell age (Figure 6B). Thus, only RBCs from splenectomized patients with band 3 deficiency showed increased opsonization with cell age that paralleled their rapid loss of deformability (Figure 5).
Cell age-dependent in vivo IgG opsonization of band 3–deficient and spectrin/ankyrin-deficient RBCs from splenectomized patients and healthy controls.
RBC-bound IgG was determined by 125I-labeled protein G on density-fractionated RBCs and is given as a function of cell age. (A) Band 3 deficiency: patients AZ2 (closed rectangles), AZ4 (gray rectangles), AZ10 (framed rectangles), WR2.2 (framed rectangles with heavy line). (B) Spectrin/ankyrin deficiency: patients AZ16, AZ18, EG6, SE2. (C) Control RBCs. In the text to Figure 6, Prefers to the significance of the difference between the highest values and corresponding controls in all 4 cases.
In vivo IgG binding to whole populations of unspecified HS RBCs had earlier been determined by agglutination. It was low before and higher after splenectomy but remained within the normal range.35Given that HS is usually caused by spectrin/ankyrin deficiencies, the earlier finding appears to be in agreement with our results on spectrin/ankyrin-deficient RBCs from splenectomized patients. The high binding of IgG, naturally occurring autoantibodies (NAbs) to band 3–deficient RBCs in this study was clearly not due to hypergammaglobulinemia because none of the patients had more than 16 mg IgG/mL and 2 had values below 10 mg/mL (not shown).
Spectrin/ankyrin-deficient, but not band 3–deficient, RBCs released band 3
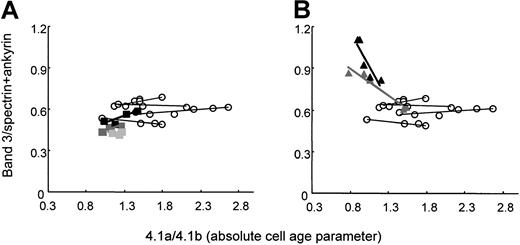
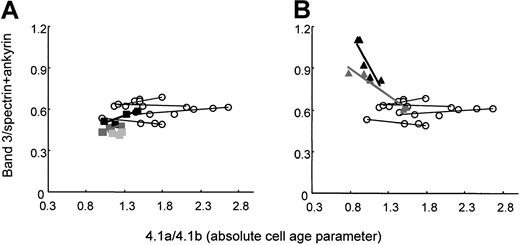
HS RBCs with common spectrin/ankyrin deficiency lose surface in the form of vesicles.36 The loss of vesicles may deprive the cells of integral membrane proteins. Thus, we measured the relative content of band 3 by determining the band 3/spectrin+ankyrin ratio in membranes of density-separated RBCs from splenectomized patients. The band 3/spectrin+ankyrin ratio was inherently low in band 3–deficient RBCs and remained at the same level with increasing cell age or slightly increased (Figure 7A). In spectrin/ankyrin-deficient RBCs, the band 3/spectrin+ankyrin ratio was high because of the low content of skeletal proteins. This ratio decreased significantly from values as high as 1.13 to 0.8 or 0.9 to 0.6 (Figure 7B). Thus, spectrin/ankyrin-deficient RBCs released band 3 with increasing cell age.
Ratio of protein band 3 to spectrin+ankyrin in RBC membranes from band 3–deficient and spectrin/ankyrin-deficient patients as a function of cell age.
Ratios of protein band 3:spectrin+ankyrin and those of band 4.1a/4.1b were determined on density-fractionated RBCs. Filled symbols indicate patients; open circles, controls. (A) Band 3 deficiency: patients LR2 (black rectangles), AZ10 (dark gray rectangles), WR2 (light gray rectangles). (B) Spectrin/ankyrin deficiency: patients AZ18 (black triangles), AZ16 (gray triangles).
Discussion
Splenectomy had 2 beneficial effects in HS. First, it prevented the loss of a substantial fraction of the youngest cells in both deficiencies. This effect of splenectomy illustrates our interpretation of the finding that the lightest RBC after splenectomy had deformability similar to that of corresponding fractions of RBCs before splenectomy but a cell age that was higher by 0.3 to 0.4 units of the band 4.1a/4.1b ratio. This implies that the functional impairment of RBCs was significantly delayed after splenectomy, irrespective of the type of defect. Such an explanation is likely because reticulocytes and young RBCs are known to have the highest KCl cotransport potential that is rapidly activated by swelling, low pH,37 and oxidative damage.38 Low pH and oxidative damage may occur in splenic cords. Because only a fraction of the blood passes at any time through the splenic sinuses, it is possible that the portion of young cells that traversed the spleen might have suffered considerably more from splenic conditioning than cells that entered the spleen at a higher cell age.
Second, as presumed, splenectomy prolonged the survival of mature RBCs, but only in spectrin/ankyrin and not significantly in band 3 deficiency. Band 3–deficient RBCs lost their deformability with cell age as rapidly in splenectomized as in unsplenectomized patients. In contrast to this, maximum deformability decreased at a considerably slower pace with cell age in splenectomized patients with spectrin/ankyrin deficiency. Hence, these RBCs reached a higher cell age than those from patients with band 3 deficiency, implying that the mechanisms leading to premature RBC clearance differed between the 2 types of deficiencies. The pronounced age-dependent loss of band 3 protein from spectrin/ankyrin-deficient RBCs and the complete retention of band 3 in band 3 deficiency represent the molecular hallmarks of the different clearance mechanisms.
In spectrin/ankyrin deficiency, the cytoskeleton that normally forms a nearly monomolecular submembranous layer on the inner surface39 has a decreased density. As a result, areas of the plasma membrane that are not attached to the skeleton are more abundant than in normal cells and are prone to be released from the cells in the form of vesicles.40,41 Selective loss of band 3 from spectrin/ankyrin-deficient RBCs suggests that the released vesicles contained band 3, lacked skeletal proteins, and therefore might have had properties similar to those of skeleton-free vesicles released from adenosine triphosphate (ATP)–depleted normal RBCs.42 These vesicles had their band 3 protein clustered (clustered means forming interdimeric and intertetrameric oligomers rather than pre-existing dimers and tetramers) because the extent of exoplasmic chemical cross-linking was up to 10-fold higher than in intact normal RBCs.43 In support of this analogy, lateral mobility of band 3, which is a prerequisite for cluster formation, was found to be greater in RBCs from patients with spectrin/ankyrin-deficient RBCs than in control cells.44Thus, the cell-age dependent loss of band 3 from spectrin/ankyrin-deficient RBCs might indeed be attributed to impaired skeletal constraints on the apparent excess of band 3 molecules, which allowed band 3 cluster formation and the release of band 3–containing vesicles.
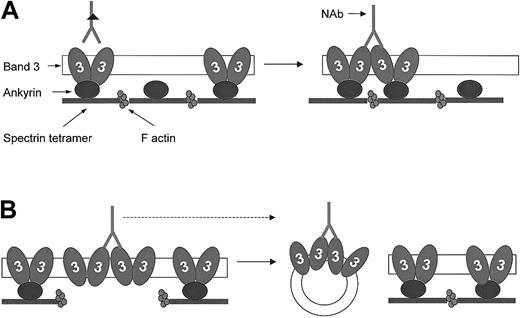
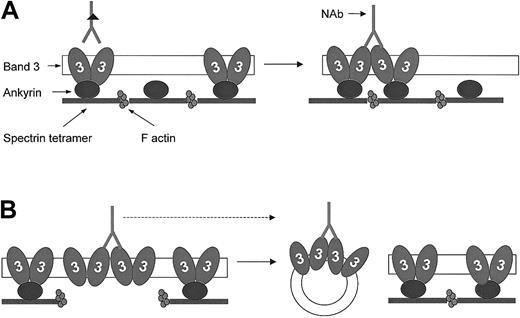
Band 3–deficient RBCs, with their reduced number of band 3 molecules in the healthy cytoskeleton, must have faced a different scenario. Band 3 cluster formation might have occurred to a lower extent, but all clusters were retained by an excess of skeleton because no band 3 was released. The presence of band 3 clusters has recently been established on RBCs from HS patients who underwent splenectomy.45Hence, complete retention of band 3 and its clusters in aging band 3–deficient RBCs may explain their in vivo IgG opsonization (Figure8A). Opsonization was significantly higher than to control cells and reached an extent comparable to that determined on biotinylated, in vivo, aged dog RBCs.46Opsonization might have occurred by pre-existing NAbs, of which some bind to RBC membrane proteins, such as anti–band 3.47Anti–band 3 NAbs have a low affinity, and their firm bivalent binding requires the availability of band 3 clusters48 that are generated by lateral diffusion49 and are fixed in vivo by hemichrome binding50,51 or oxidative damage from within the cell.52 Thus, accelerated clearance of HS RBCs with band 3 deficiency may require opsonization by autologous IgG, as was found for phagocytosis of RBCs with hemoglobin defects53,54 and oxidatively stressed RBCs.52 55
Hypothesis for band 3 protein dynamics and NAb binding to HS RBCs with band 3 and spectrin/ankyrin deficiency.
Band 3 proteins exist in RBC membranes as preformed dimers and tetramers, of which the latter interact with ankyrin (for simplicity, only dimers are shown). These normally existing oligomers do not significantly bind anti–band 3 NAbs, presumably because the location of antigenic sites prevents their bivalent binding.49Lateral mobility and water loss result in the enhanced formation of band 3 clusters and favor bivalent binding of anti–band 3 NAbs. (A) Band 3–deficient RBCs. The excess of skeletal anchorage points compared to the reduced number of band 3 molecules in this deficiency prevents band 3 clusters from dissociation and release. This results in an increased number of IgG-opsonized band 3 clusters compared with healthy cells of the same age. (B) Spectrin/ankyrin-deficient RBCs. These membranes contain an excess of band 3 compared with skeletal anchorage points. Because band 3 clusters are primarily formed in areas detached from the skeleton, they will preferentially bud off as skeleton-free vesicles. This deprives the remaining spherocytes of bound opsonins and thereby may prolong their survival.
Spectrin/ankyrin-deficient RBCs did not carry more IgG than control cells. Thus, it appears as if the release of band 3–containing vesicles from these RBCs was sufficient to prevent IgG opsonization of the remaining spherocytes. The release of membrane areas containing IgG-opsonized band 3 clusters might have allowed these cells to escape long-term opsonization (Figure 8B). Although we have no direct evidence for the involvement of anti–band 3 NAbs in this in vivo opsonization, their participation is likely given that analogous vesicles released from ATP-depleted RBCs and carrying band 3 clusters bound amounts of autologous IgG 14 times higher than those of RBCs from which they were released.56
We thank the patients who volunteered and gave their consent to study their blood. We also thank Baxter (Switzerland) for providing the sterile mini blood bags and filters required for blood collection and filtration.
Supported by grant no. 0-20423-97 from the Swiss Federal Institute of Technology, Zurich.
The publication costs of this article were defrayed in part by page charge payment. Therefore, and solely to indicate this fact, this article is hereby marked “advertisement” in accordance with 18 U.S.C. section 1734.
References
Author notes
Hans U. Lutz, Institute of Biochemistry, Swiss Federal Institute of Technology, ETH-Hönggerberg HPM D14.2, CH 8093 Zurich; e-mail: hlutz@bc.biol.ethz.ch.

