Abstract
The proto-oncogene EVI1 encodes a DNA binding protein and is located on chromosome 3q26. The gene is aberrantly expressed in acute myeloid leukemia (AML) patients carrying 3q26 abnormalities. Two mRNAs are transcribed from this locus: EVI1 and a fusion ofEVI1 with MDS1(MDS1-EVI1), a gene located 5′ ofEVI1. The purpose of this study was to investigate which of the 2 gene products is involved in transformation in human AML. To discriminate between EVI1 andMDS1-EVI1 transcripts, distinct real-time quantitative polymerase chain reaction (PCR) assays were developed. Patients with 3q26 abnormalities often showed highEVI1 and MDS1-EVI1 expression. In a cohort of 319 AML patients, 4 subgroups could be distinguished:EVI1+ andMDS1-EVI1− (6 patients; group I), EVI1+ andMDS1-EVI1+ (26 patients; group II),EVI1− andMDS1-EVI1+ (12 patients; group III), and EVI1− andMDS1-EVI1− (275 patients; group IV). The only 4 patients with a 3q26 aberration belonged to groups I and II. Interestingly, high EVI1 and notMDS1-EVI1 expression was associated with unfavorable karyotypes (eg, −7/7q−) or complex karyotypes. Moreover, a significant correlation was observed betweenEVI1 expression and 11q23 aberrations (mixed lineage leukemia [MLL] gene involvement). Patients from groups I and II had significantly shorter overall and event-free survival than patients in groups III and IV. Our data demonstrate that highEVI1 expression is an independent poor prognostic marker within the intermediate- risk karyotypic group.
Introduction
The EVI1 proto-oncogene is located on human chromosome 3q26 and is involved in pathogenesis of human acute myeloid leukemia (AML) or myelodysplastic syndrome (MDS) carrying 3q26 rearrangements.1,2 Although these rearrangements are infrequent in AML, they are of remarkable prognostic value. Patients with these karyotypes often do not respond to therapy, even when the most active antileukemic therapeutic options are used.3
EVI1 encodes a nuclear DNA binding protein with 2 zinc finger domains, an N-terminal domain containing 7 zinc fingers and a more C-terminal domain with 3 zinc fingers. Both domains recognize and bind to specific DNA consensus sequences.4,5 While most reports indicate that EVI1 gene expression is not detectable in normal blood or bone marrow,6-9 other studies suggest low but detectable expression of EVI1 in normal bone marrow cells.10 High expression of EVI1 has been observed in developing oocytes and in the kidney.11Although the exact mechanism of transformation by EVI1 is still obscure, several studies have shown that inappropriate expression of EVI1 in immature hematopoietic cells interferes with erythroid and granulocytic development.12 It has become evident that EVI1 may form a fusion transcript with theMDS1 gene. MDS1 is a 4-exon gene located upstream of EVI1. Splicing may occur from exon 2 of MDS1to the second exon of EVI1 to form the fusion transcriptMDS1-EVI1. This intergenic splicing may occur in normal tissues as well as in myeloid leukemia.1,13MDS1-EVI1 encodes a longer protein containing the entire EVI1 protein but with an additional, unique N-terminal extension. Although related, the 2 proteins EVI1 and MDS1-EVI1 may have opposite properties.14 15
Previous studies showed that EVI1 may be expressed in patients without 3q268,9,16 17; however, the sets of polymerase chain reaction (PCR) primers that were chosen in these studies did not discriminate between EVI1 andMDS1-EVI1. We designed different primer and probe combinations to discriminate between EVI1 and MDS-EVI1 and quantify the transcript levels by means of real-time PCR analysis. To provide an answer to the question, which of these transcripts are expressed in patients with 3q26 rearrangements, we first screened 7 patients carrying 3q26 abnormalities. Using the same technique, we studied the expression levels of these transcripts in the bone marrow samples of healthy volunteers. To investigate how frequently EVI1, MDS1-EVI1, orMDS1 may be expressed in de novo AML, we determined expression levels of these transcripts in a cohort of 319 AML patients at diagnosis. The results were analyzed in relation to hematologic, cytogenetic, and clinical characteristics as well as outcome of therapy. Our data demonstrate that expression of EVI1 and not of MDS1-EVI1 is associated with highly aggressive AML. High EVI1 expression occurs with high frequency in patients without 3q26 abnormalities, suggesting other mechanisms of aberrant EVI1 expression.
Patients, materials, and methods
Patients and healthy volunteers
Bone marrow samples of AML patients at diagnosis and healthy volunteers (n = 9) were obtained after informed consent. Blasts from AML patients and mononucleated fractions from healthy bone marrow specimens were isolated from the samples by Ficoll-Hypaque (Nygaard, Oslo, Norway) centrifugation.18 The cells were then cryopreserved as described in Delwel et al.19 After thawing cells were washed with Hanks Blanced Salt Solution (HBSS) and further processed for RNA isolation. AML samples treated according to these procedures usually contain more than 90% blasts after thawing.19 Seven patients with 3q26 rearrangements (4 patients with AML, 2 with refractory anemia with excess blasts in transformation [RAEB-t], and 1 with chronic myelogenous leukemia) were selected that had not been included in a clinical trial. A total of 319 de novo AML patients who had been referred to our institution and collaborating centers between 1987 and 2000 were chosen for analysis. Of these patients, 229 were treated according to the HOVON-29 (Dutch-Belgian Haematology-Oncology Group) protocol, 66 according to the HOVON-4 protocol, and 13 according to the HOVON-31 protocol. These treatment protocols have been described elsewhere.20 Eleven patients received other forms of treatment. The clinical and hematologic characteristics of the 319 patients at diagnosis are shown in Table1. AML samples were classified according to FAB nomenclature.21
RNA isolation, cDNA synthesis, and real-time PCR
Total RNA was extracted with guanidium thiocyanate followed by centrifugation in cesium chloride solution. Then 1 μL RNA was transcribed into cDNA using Superscript (Life Technologies, Merelbeke, Belgium) and random hexamers in a 40-μL reaction under standard conditions.
An aliquot of one 20th of the resulting cDNA was used for quantitative PCR amplification. Real-time PCR amplification was performed with the ABI PRISM 7700 Sequence Detector (Applied Biosystems, Nieuwerkerk aan den IJssel, Netherlands), using 50 μL mix containing 2 μL cDNA sample; 250 μM deoxyribonucleoside triphosphates (dNTPs; Amersham Pharmacia Biotech, Roosendaal, Netherlands); 15 pmol forward and reverse primer (Life Technologies); 3 mM MgCl2 (5 mM for porphobilinogen deaminase [PBGD] reaction); 200 nM probe, labeled at the 5′ end with the reporter dye molecule FAM (6-carboxy-fluorescein) for EVI1,MDS1-EVI1, and MDS1 or with JOE (carboxyrhodamine) for PBGD and at the 3′ end with the quencher dye molecule TAMRA (6-carboxy-tetramethyl-rhodamine; Eurogentec, Maastricht, Netherlands); 5 μL 10 × buffer A; 30 μL water; and 1.25 U AmpliTaq Gold (Applied Biosystems). The thermal cycling conditions included 10 minutes at 95°C followed by 45 cycles of denaturation for 15 seconds at 95°C and annealing/extension at 60°C for 30 seconds. The primer/probe combinations were chosen such that we could discriminate between EVI1,MDS1/EVI1, and MDS1 transcripts (Figure 1). The oligonucleotide sequences of the primers and probes are shown in Table2.
Schematic representation of EVI1 andMDS1-EVI1 and the primer and probes used for real-time PCR.
Primers 1 and 2 plus probe A were used to determineMDS1-EVI1 expression levels. EVI1transcript levels were determined using primers 3 and 2 plus probe A.MDS1 expression was measured using primers 1 and 4 plus probe B. Probe C was used for Northern blot analysis.
Using 7 different dilutions of a cDNA sample (equal to 0.0064-100 ng total RNA) prepared from AML cells that were positive for each of the transcripts (patient 2, Table 3), standard curves were made for EVI1 andMDS1-EVI1. As the expression levels ofMDS1 transcripts were too low to measure the efficiency of amplification, MDS1 expression was considered positive (+) when the threshold cycle (Ct) value was below 35.
To determine the expression levels in AML, all samples were tested in duplicate and the average values were used for quantification. To quantify the relative expression of EVI1 andMDS1-EVI1, the Ct values were normalized for endogenous reference (δCt = Cttarget − CtPBGD) and compared with a calibrator, using the δδ Ct method (δδCt = δCt Sample − δCtCalibrator). As calibrator we used the average Ct value of EVI1 and MDS1-EVI1 in the 9 bone marrow samples of the healthy volunteers. We used the δδCt value to calculate relative expression (2−δδ Ct). As the δδCt method is applicable only when the amplification efficiencies of the target and the reference are essentially equal, we analyzed the efficiencies for another 4 patients (patients 25, 28, 29, and 30; Table 4), using the same dilutions indicated above. The mean δCt values (Cttarget − CtPBGD) were plotted against the concentrations of total RNA (log). The slope of the fitted line was then determined. A slope of less than 0.1 is indicative of equal efficiencies.
To define high EVI1 and MDS1-EVI1expression, a cutoff value of 50 (relative expression 2−δ δCt) was chosen. This value was chosen to avoid the influence of particle distribution statistics, particularly in those cases with a slightly higher EVI1 andMDS1-EVI1 expression. To prevent bias, the survival analysis was also performed at cutoff points of 10, 25, and 100.
Northern blotting
Northern blotting was carried out on mRNA isolated from healthy bone marrow samples as well as AML samples. A portion (20 μg) of total RNA from each sample was separated on a 1% agarose, 6% formaldehyde gel and blotted with 10 × SSC (sodium chloride/sodium citrate; Amersham) onto Hybond-N+ nylon membrane (Amersham). The blot was hybridized in 1N NaH2PO4 buffer containing 7% sodium dextran sulfate and 1 mM EDTA (ethylenediaminetetraacetic acid), pH 8.0. As probe, human EVI1 (600-bp HindIII-Ncol fragment) and murine GAPDH (777-bp HindIII-EcoRI fragment)23 were 32P-labeled by random priming (Boehringer, Mannheim, Germany). The blot was hybridized at 65°C overnight and washed for 15 minutes at 65°C in 2 × SSC/0.5% sodium dodecyl sulfate (SDS) and for 15 minutes at 65°C in 1 × SSC/0.5% SDS. It was then analyzed by autoradiography.
Cytogenetic analysis and stratification according to karyotype risk group
Cytogenetic analysis was carried out according to standard techniques, and the abnormalities were categorized in 3 cytogenetic groups. Patients with inv(16)/t(16;16), t(8;21), and t(15;17) abnormalities were considered as being in the favorable-risk category. The unfavorable-risk category was defined by the presence of −5/del(5q), −7del(7q), t(6;9), t(9;22), 3q26 abnormality or complex karyotype (more than 3 abnormalities). All other patients were classified as intermediate risk. Karyotypes were described according to the International System for Human Cytogenetic Nomenclature.22
Analysis of FLT3 internal tandem duplication mutations in AML
The internal tandem duplications in exon 11 of the humanFLT3 gene were determined as described previously.24 Briefly, cDNA (derived from 50 ng total RNA) and genomic DNA (1 μg) were subjected to PCR using primers 11F 5′-CAATTTAGGTAT-3′ and 11R 5′-CAAACTCTAAATTTTCTCT-3′. The PCR cycling conditions were as follows: 3 minutes at 94°C; 30 cycles of 1 minute at 94°C, 1 minute at 54°C, 1 minute at 72°C; and a final step of 10 minutes at 72°C. PCR products were resolved on a 2.5% agarose gel.
Statistical analysis
Statistical analysis was performed with Stata Statistical Software, Release 7.0 (Stata, College Station, TX). Spearman rank correlation, Pearson χ2 test, and Kruskal-Wallis test were used to assess the association between EVI1 andMDS1-EVI1 expression and the clinical and hematologic characteristics of patients. Actuarial probabilities of overall survival (OS, with failure death due to any cause) and event-free survival (EFS, with failure in case of no complete remission (CR) at day 1 or at relapse or at death in first CR) were estimated by the method of Kaplan and Meier. The Cox proportional hazards model was applied to determine the association of highEVI1 expression with OS and EFS, without and with adjustment for other factors such as age, cytogenetic risk, and FLT3 internal tandem duplication (FLT3-ITD). All tests were 2-sided, and aP of less than .05 was considered statistically significant.
Results
Quantification of EVI1, MDS1-EVI1, andMDS1 by real-time PCR
EVI1, MDS1-EVI1, andMDS1 expression levels were analyzed by real-time PCR employing specific primer/probe combinations (Figure 1; Table 2). Efficiency of the quantification method for EVI1 andMDS1-EVI1 was examined by standard curves made using mRNA isolated from AML samples that were positive forEVI1 or MDS1-EVI1. Linear correlation between Ct values and copy numbers was obtained for EVI1 andMDS1-EVI1, with correlation coefficients of 0.94 and 0.98, respectively. The efficiency of amplification, determined in cDNA obtained from a bone marrow sample from patient 2, was approximately 1.00 for EVI1, 0.95 forMDS1-EVI1, and 0.96 for PBGD. To evaluate whether the δδCt method used in our study was indeed applicable, we verified the differences in efficiencies of amplification in another 4 AML samples ( samples 25, 28, 29, and 30). The slopes of the fitted lines for the mean δCt values at different mRNA concentrations were −0.089 for EVI1 and 0.036 forMDS1-EVI1, indicating that the δδCt method was indeed applicable. The expression levels of MDS1transcripts were too low to measure the efficiency of amplification. Therefore we decided not to quantify the MDS1 expression level but to show whether it was expressed (+) or not (−).
As calibrator, we used the average expression of EVI1 andMDS1-EVI1 in 9 bone marrow samples from healthy volunteers. The mean Ct values of EVI1 andMDS1-EVI1 in these normal samples were 38.4 ± 1.5 and 38.3 ± 2.6, respectively. The values obtained were normalized for the internal reference, PBGD. The mean PBGD value for normal bone marrow samples was 23.2 ± 0.9. MDS1expression was undetectable in bone marrow samples from healthy volunteers.
EVI1, MDS1-EVI1, and MDS1expression in AML patients carrying 3q26 abnormalities
The relative expression of EVI1 andMDS1-EVI1 transcripts in patients with 3q26 abnormalities is shown in Table 3. In 3 AML patients carrying an inv(3)(q22;q26) and in 1 AML patient with a translocation t(3;3)(q22;q26), high expression of EVI1 as well asMDS1-EVI1 transcripts was observed. One of the 2 RAEB-t patients with t(3;12) showed high EVI1 levels and a moderate increase in MDS1-EVI1 expression, while in the other RAEB-t patient MDS1-EVI1 expression was high and EVI1 expression was comparable to that of normal bone marrow. A CML patient with t(3;17) showed weak expression of EVI1 and no detectable expression ofMDS1-EVI1. Expression of MDS1 was observed in patient 6 only.
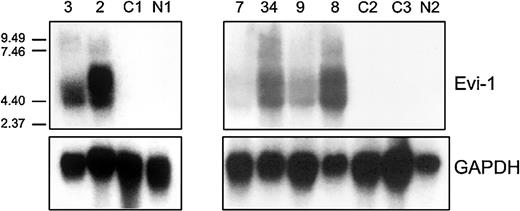
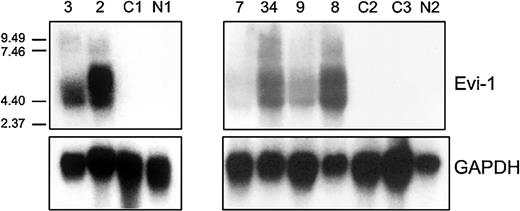
Northern blot analysis was carried out using an EVI1 cDNA probe on total mRNA isolated from 2 patients (patients 2 and 3) carrying inv(3)(q22q26) and a CML patient (patient 7) with a translocation t(3;17) (Figure 2). Although this probe does not discriminate between the EVI1and MDS1-EVI1 transcripts, high expression as observed by real-time PCR was confirmed. No expression was observed by Northern blot analysis in a normal bone marrow sample (N1) or in a sample from an AML patient without 3q26 abnormality (C1); these 2 samples were negative for different transcripts as determined by real-time PCR (Figure 2).
EVI1 mRNA expression in AML samples as determined by Northern blotting.
Human 600-bp HindIII-Ncol EVI1 probe (see Figure 1) was used, which does not discriminate betweenEVI1 and MDS1-EVI1. Murine GAPDH fragment was used as control. Patients 2, 3, and 7 carry a 3q26 abnormality (Table 3); patients 8, 9, and 34 have high EVI1expression but no 3q26 abnormality (Table 4). C1, C2, C3 represent AML patients without EVI1 expression. N1 and N2 represent normal bone marrow samples.
EVI1, MDS1-EVI1, andMDS1 expression in a cohort of 319 de novo AML patients
The expression levels of EVI1,MDS1-EVI1, and MDS1 were next investigated by real-time PCR in bone marrow samples of 319 patients newly diagnosed with AML. This cohort did not include the 7 patients from Table 3. Of these 319 patients, 44 expressed EVI1,MDSI-EVI1, or both (Table 4): 6 expressed EVI1only (group I), 26 expressed EVI1 as well asMDS1-EVI1 (group II), and 12 expressedMDS1-EVI1 only (group III). In the remaining 275 patients (group IV), neither EVI1 norMDS1-EVI1 was expressed. In 15 patients theMDS1 gene expression (+) was detectable. MDS1expression was always associated with high levels of EVI1plus MDS1-EVI1 (Table 4).
To confirm the results obtained by real-time PCR, Northern blot analysis was carried out in 6 cases. Patients who appeared to be highly positive for EVI1 and/or MDS1-EVI1 by real-time PCR (patients 8, 9, and 34) also showed the proper size transcripts by Northern blotting analysis (Figure 2). Two patients who were negative by real-time PCR (C2 and C3) and a normal bone marrow sample (N2) showed no transcripts by Northern blot analysis.
3q26 abnormalities in de novo AML samples expressing EVI1 or MDS1-EVI1
Cytogenetic analysis among the 44 patients who were positive forEVI1 and/or MDS1-EVI1 revealed that only 4 AML patients (patients 12, 23, 35, and 39) carried a 3q26 abnormality (Table 4). None of the patients within group IV (EVI1− andMDS1-EVI1−) carried 3q26 aberrations.
EVI1 expression correlates with unfavorable karyotypes
3q26 defects in AML are frequently accompanied by additional unfavorable cytogenetic abnormalities (eg, −7/7q−). In fact, in 2 cases shown in Table 3 (patients 1 and 6) and all 4 cases with a 3q26 aberration shown in Table 4 (patients 12, 23, 35, and 39), chromosome 7 abnormalities were observed. We next investigated whetherEVI1 and/or MDS1-EVI1 expression in de novo AML without a 3q26 abnormality also correlated with the presence of poor-risk karyotypes (Tables 4 and 5). In 67% of patients (4 of 6) from group I (EVI1 only) and 42% of patients (11 of 26) from group II (EVI1+ andMDS1-EVI1+), unfavorable karyotypic abnormalities (ie, −7/7q−, −5/5q−, t(9;22), t(6;9)) or complex karyotypes (> 3 abnormalities) were present. In contrast, only 8% (1 of 12) of the patients from group III (EVI1−and MDS1-EVI1+) and 12% (33 of 275) of the patients from group IV (EVI1− andMDS1-EVI1−) carried unfavorable karyotypes. Thus EVI1 expression (groups I and II) correlated with unfavorable karyotypes (P < .0001), whereas the presence of MDS1-EVI1 alone (group III) did not. Moreover, favorable-risk karyotypes, that is, t(8;21), t(15;17) or inv(16), were not noted in any of theEVI1-expressing AML patients from group I or group II. In contrast, 33% (4 of 12) of the patients in group III (EVI1− andMDS1-EVI1+) and 19% (53 of 275) of the patients in group IV (EVI1− andMDS1-EVI1−) exhibited favorable-risk karyotypes (Table 5).
Among the 212 cases that belong to the leukemias with intermediate-risk karyotypes, 14 showed an 11q23 translocation (MLLrearrangement). Interestingly, 8 of these 14 patients (57%) were found in group II, that is, patients expressing EVI1+and MDS1-EVI1+ (Table 4). These data suggest a strong correlation between EVI1 expression and the presence of MLL rearrangements.
Correlation of EVI1 andMDS1/EVI1 expression with other prognostic indicators
We next investigated whether EVI1 and/orMDS1/EVI1 expression showed any correlation with other known prognostic indicators. Internal tandem duplication in the FLT3 receptor tyrosine kinase gene has been observed in approximately 20% to 30% of patients with AML. Moreover, this mutation appears to confer a poor prognosis in many studies carried out in the past 5 years.25 26 In 85 (27%) of the 319 cases investigated, an FLT3-ITD was found. As shown in Table 5, high EVI1and MDS1-EVI1 expression rarely coincided with FLT3-ITD mutation. Almost all the patients with an FLT3-ITD mutation belonged to group IV, and 82% (70 of 85) carried an intermediate-risk karyotype. No significant correlation was found between EVI1and/or MDS1-EVI1 expression and sex, age, WBC count, platelet count, blast counts in blood or bone marrow, or FAB classification (data not shown).
EVI1 an independent unfavorable prognostic marker in the intermediate-risk karyotypic group
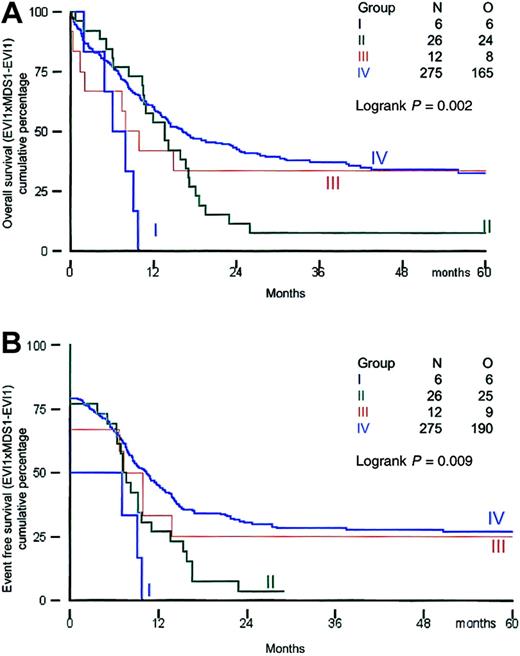
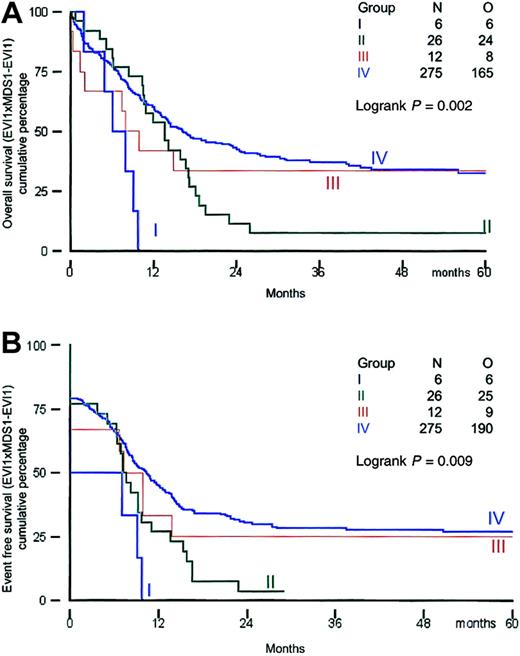
All patients received induction therapy and were included in the survival analysis. Clinical outcome was investigated in the distinct groups of patients based on their EVI1 andMDS1-EVI1 expression. Survival analysis was performed using a cutoff value of 50. The remission rates for patients in groups I, II, III, and IV were 50%, 77%, 67%, and 79%, respectively (Table 6). All patients in group I died within 12 months, and 25 of 26 patients in group II (EVI1+ andMDS1-EVI1+) died within 30 months (Table 6; Figure 3A,B).
Overall survival and event-free survival in AML patients based on EVI1 and MDS1-EVI1expression.
(A) Overall survival; (B) event-free survival.
Overall survival and event-free survival in AML patients based on EVI1 and MDS1-EVI1expression.
(A) Overall survival; (B) event-free survival.
The actuarial survival probabilities at 60 months were 33% in groups III and IV and only 0% for group I and 8% for group II (Table 6; Figure 3A,B). Thus patients in groups I and II had a significantly shorter OS (P = .002). The EFS probabilities at 60 months for groups I and II (0% and 4%, respectively) were much lower than those for groups III and IV (25% and 27%, respectively). A significant difference (P = .002) was also observed between EFS in patients with high EVI1 expression (groups I and II) and that in AML patients without EVI1 expression (groups III and IV). We also analyzed survival using alternative cutoff values (ie, 10, 25, and 100). Although the numbers of patients within the 4 different subgroups were slightly different, changing the cutoff values did not alter the conclusions drawn from the analysis at cutoff value 50 (data not shown).
Cox regression analysis was applied to assess the prognostic significance of high EVI1 expression for OS and EFS (Table7). High EVI1 expression was associated with an increased hazard ratio for death (OS; HR = 1.85) or failure (EFS; no CR, death in CR, or relapse, HR = 1.82), which was statistically significant in univariable analysis. After adjustment for karyotypic risk factors, age, and FLT3 in a multivariable analysis, high EVI1 expression was still associated with an increased hazard ratio (P = .09). As high EVI1 expression is often associated with unfavorable karyotypes, its prognostic value seemed to be overshadowed. To exclude the effect of unfavorable cytogenetics, we decided to investigate the prognostic value ofEVI1 in the intermediate-risk group.
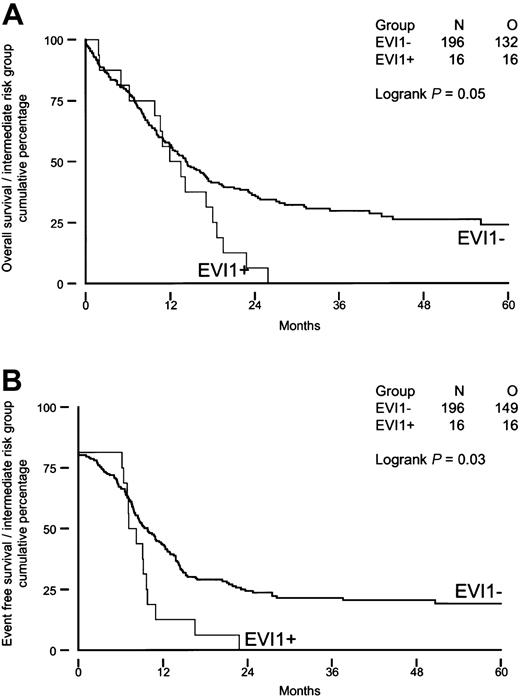
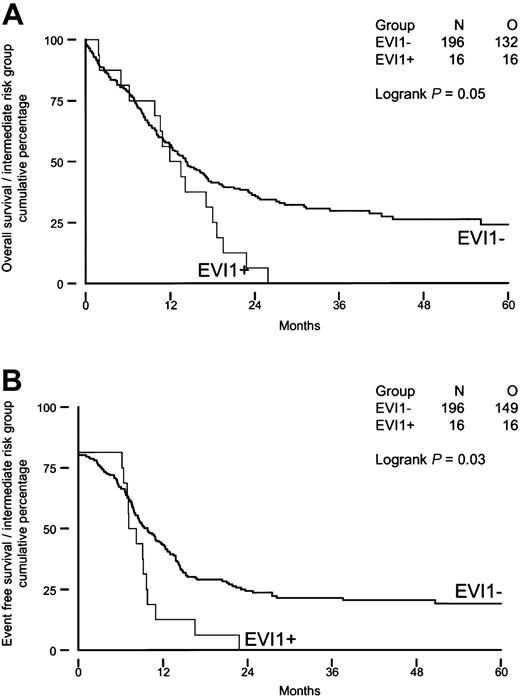
We investigated whether high EVI1 expression would be of prognostic value for patients carrying intermediate-risk karyotypes, as half of the patients with EVI1 expression (groups I and II) belonged to this risk group. As shown in Figure 4A-B, intermediate-risk patients with high EVI1 expression (n = 16) had significantly shorter OS and EFS (P = .05 and P = .03) than theirEVI1-negative counterparts (n = 196). Furthermore, the disease-free survival was significantly shorter in patients with high EVI1 expression (P = .007). None of the EVI1-overexpressing patients carried an FLT3-ITD, whereas FLT3-ITD was observed in 36% (70 of 196) of the patients without high EVI1 expression. Univariable and multivariable analysis revealed that high EVI1 expression serves as an independent prognostic marker for EFS and OS in the intermediate-risk group (Table 8).
Overall survival and event-free survival in AML patients with immediate-risk karyotype based on EVI1 expression.
(A) Overall survival; (B) event-free survival.
Overall survival and event-free survival in AML patients with immediate-risk karyotype based on EVI1 expression.
(A) Overall survival; (B) event-free survival.
Discussion
We developed a sensitive method to quantify EVI1 and its fusion transcript MDS1-EVI1 in AML. Our data demonstrate that EVI1 rather thanMDS1-EVI1 is a strong indicator for poor treatment response and survival. MDS1 expression was seen in 5% (15 of 319) of the AML patients and was always associated with highEVI1 and MDS1-EVI1 expression. HighEVI1 mRNA expression was observed in 10% (32 of 319) of the patients with newly diagnosed AML. Poor clinical outcome of patients with 3q26 abnormality has previously been reported.3 27-29As we demonstrated in this study, patients with 3q26 abnormality represent a minor subgroup of patients with high EVI1expression. In fact, only 12.5% (4 of 32) of the patients with highEVI1 expression carried a 3q26 abnormality. HighEVI1 expression was significantly correlated with the presence of unfavorable cytogenetic abnormalities. Favorable-risk karyotypes were not present among the EVI1-expressing groups.
Evi1 was first discovered as a proto-oncogene in retrovirally induced myeloid leukemias in the mouse. Retroviral insertions in the Evi1 locus in those tumors mostly occurred in close vicinity of the first 2 or 3 exons ofEvi1, causing Evi1 overexpression.30These data underline that EVI1 rather thanMDS1-EVI1 is the transforming gene in AML. This conclusion is further strengthened by the fact that in the cohort of de novo AML patients investigated in the present study, EVI1and not MDS1-EVI1 expression correlated with unfavorable-risk leukemias.
In contrast to what has been published previously, we demonstrate thatEVI1 expression in de novo AML may be an important parameter to define a subgroup of poor-risk AML patients. Langabeer et al31 studied 197 de novo AML patients but did not find any prognostic value for high EVI1 expression. This is not surprising, however, as the investigators did not discriminate betweenEVI1 and MDS1-EVI1 expression. A number of EVI1-positive patients in this study carried a favorable-risk karyotype, indicating that these patients are most likely expressing MDS1-EVI1 rather thanEVI1. Furthermore, previous studies were carried out using classical reverse transcriptase–PCR, while we performed quantitative real-time PCR to be able to determine high EVI1expression levels based on a defined cutoff value.
Cytogenetic analysis provides a powerful approach to discriminate between favorable-risk and unfavorable-risk groups of AML patients. However, using karyotyping, only 30% to 40% of the AML patients can be classified within these 2 subgroups. In other words, a majority of AML patients belong to intermediate or unknown karyotypic risk groups. A major challenge will be discriminating favorable-risk from unfavorable-risk patients within this heterogeneous group of patients by means of molecular biologic approaches. Among the patients with intermediate-risk karyotype studied, 33% (70 of 212) harbored an FLT3-ITD mutation that predicts poor prognosis. Sixteen (8%) of the 212 patients had high EVI1 expression and showed very poor survival. Interestingly, none of the EVI1-positive patients harbored an FLT3-ITD, indicating that the EVI1-expressing group represents a distinct subclass of poor-response leukemias. Within the same group of patients with intermediate-risk karyotype, a subpopulation of poor responders has been defined with very low mRNA levels of the CEBPα gene.32 Again, no overlap was found with the other 2 molecularly defined classes. Moreover, mutation analysis revealed another subset of intermediate-risk AML patients that harbored 3′ mutations within the CEBPα gene. These cases could be categorized as leukemias with a good prognosis.32 These observations encourage additional gene expression studies and mutation analyses to further unravel different classes of AML, particularly within the intermediate-risk karyotypic subgroup of AML.
In 8 of 14 patients with an 11q23 abnormality, we observed highEVI1 and MDS1-EVI1 expression. In previous studies, the correlation between EVI1 and 11q23 has been overlooked, as the cohorts were not large enough and the methods used did not discriminate between EVI1 andMDS1-EVI1. Two of 16 EVI1-positive patients screened by Ohyashiki et al17 and 1 of 29EVI1-positive patients studied by Langabeer et al31 carried an 11q23 abnormality. Translocations involving chromosome band 11q23 disrupt the MLL gene. MLL is a putative transcription regulator that may form complexes with other transcription factors. It contains both a strong activation domain and a repression domain.33 In de novo leukemia, 75% of the breakpoints in MLL are mapped to the centromeric half of the breakpoint cluster region (BCR),34which is located in the repression domain. Disruption of the repression domain in these particular 11q23 translocations might lead to an alteration of the repressor function of MLL, leading to an up-regulation of downstream target genes. A possible explanation for high EVI1 and MDS1-EVI1 expression in a large proportion of patients with 11q23 defects could therefore be that transcription of those genes is under the control of MLL. We hypothesize that MLL normally represses EVI1 andMDS1-EVI1 expression. This repression might then be disrupted as a result of a chimeric protein generated by 11q23 translocation, as has been suggested for Hox genes.5Cloning and nucleotide sequencing analysis of the MLL fusion genes inEVI1-positive versus EVI1-negative patients may provide critical information on this issue.
One of the goals of this study was to investigate whetherEVI1, MDS1-EVI1, or both transcripts were expressed in AML patients with 3q26 aberrations. All of the 8 AML patients with a classical t(3;3) or an inv(3) (Tables 3 and 4) showed high expression of EVI1. High EVI1 expression in 7 patients was associated with high MDS1-EVI1. Thus, although our data suggest that EVI1 rather thanMDS1-EVI1 is the critical gene involved in transformation of myeloid precursors, it is noteworthy thatMDS1-EVI1 is also frequently expressed. Since the 3q26 breakpoints are often located between the MDS1 andEVI1 loci, the normal allele is responsible forMDS1-EVI1 expression.MDS1-EVI1 expression might be directly or indirectly up-regulated by EVI1 expression. Another possible explanation is that aberrantly expressed EVI1 as a result of 3q26 aberration mainly transforms progenitor cells that normally have high EVI1 and/or MDS1-EVI1 levels. Fractionated CD34+ progenitor cell populations indeed show high EVI1, MDS1-EVI1, andMDS1 expression (S.B.v.W.v.D.-K. et al, unpublished data, January 2001). Previous studies10 35 also confirmedEVI1 expression in early CD34+ progenitor cells. In fact, transformation in these progenitors may be a result of a disturbance in the tightly controlled balance between EVI1and its fusion transcript.
The mechanism by which EVI1 is expressed in patients without 3q26 is unknown. It is conceivable that defects in the EVI1promoter or in EVI1-regulatory genes affect expression. It is also possible that CD34+ progenitor cells naturally expressing EVI1 and/or MDS1-EVI1 are transformed by other mechanisms and arrested at that particular stage of differentiation. It should be noted that high EVI1expression is often associated with the presence of poor-risk abnormalities. For example, complex karyotypes are seen twice as often in patients with high EVI1 expression than in patients without EVI1 expression. Our data point to a critical role that EVI1 may play in genomic instability in AML patients expressing this gene.
The data presented here demonstrate that EVI1 overexpression in AML patients correlates with poor treatment outcome. We propose that EVI1 gene expression measurements with real-time PCR should be incorporated into the diagnostic procedures for de novo AML patients, especially in the subpopulation with intermediate- or unknown-risk karyotypes. Determination ofEVI1 expression levels in this particular category of AML patients will be useful in distinguishing a subgroup of patients with poor prognosis. Identification and classification of subtypes of AML with specific molecular defects will be of great value in designing unique stratified treatment approaches.
A. Hagemeijer of the Center for Human Genetics, Catholic University of Leuven, Belgium, is acknowledged for the cytogenetic analysis performed on patient samples obtained from that institute. We thank our colleagues from the bone marrow transplantation group and the molecular diagnostics laboratory, Institute of Hematology, Erasmus Medical Centre, for preparation and storage of AML samples. We wish to thank Karola van Rooijen for preparation of the figures.
Prepublished online as Blood First Edition Paper, October 3, 2002; DOI 10.1182/blood-2002-05-1459.
Supported by grants from the Dutch Cancer Society (Koningin Wilhelmina Fonds) and the Erasmus University Medical Centre (Revolving Fund).
The publication costs of this article were defrayed in part by page charge payment. Therefore, and solely to indicate this fact, this article is hereby marked “advertisement” in accordance with 18 U.S.C. section 1734.
References
Author notes
Ruud Delwel, Institute of Hematology, Erasmus Medical Centre, PO Box 1738, 3000 DR Rotterdam, Netherlands; e-mail: delwel@hema.fgg.eur.nl.


